
South Africa Wire and Cable Market Size and Share
Market Overview
| Study Period | 2020 - 2031 |
|---|---|
| Forecast Data Period | 2026 - 2031 |
| Base Year Market Size (2025) | USD 0.87 Billion |
| Market Size (2026) | USD 0.89 Billion |
| Market Size (2031) | USD 1.05 Billion |
| Growth Rate (2026 - 2031) | 3.36 % |
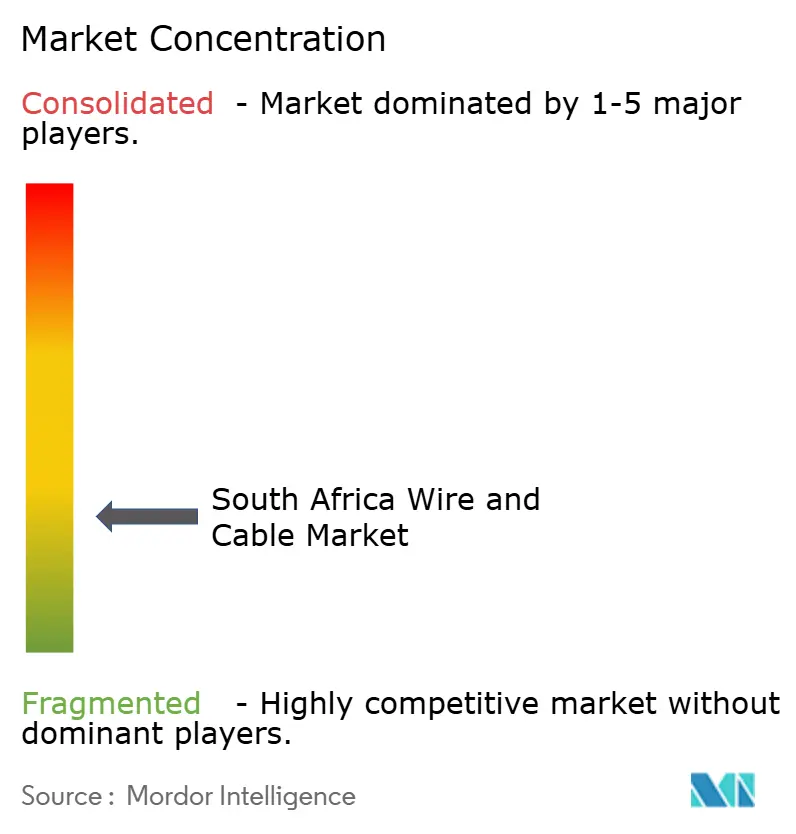
| Market Concentration | Low |
Major Players *Disclaimer: Major Players sorted in no particular order Image © Mordor Intelligence. Reuse requires attribution under CC BY 4.0. | |
South Africa Wire and Cable Market Analysis by Mordor Intelligence
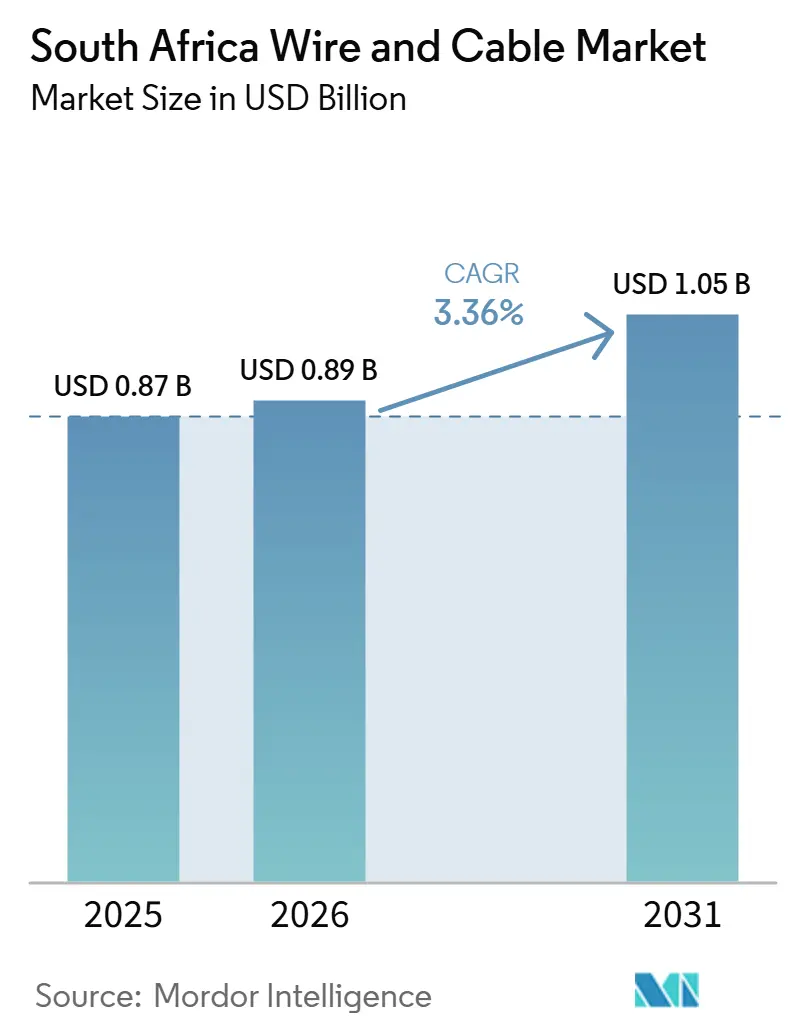
The South Africa wire and cable market size is projected to expand from USD 0.87 billion in 2025 and USD 0.89 billion in 2026 to USD 1.05 billion by 2031, registering a CAGR of 3.36% from 2026 to 2031. Transmission expansion, renewable generation, rural electrification, and municipal network rehabilitation are expected to support demand for power, control, and communication cables. Digital infrastructure spending also broadens demand beyond traditional utility projects, particularly for fiber links, data center power systems, and equipment connections. Procurement is becoming more sensitive to quality certification, local-content requirements, the ability to meet higher-voltage specifications, and suppliers' capacity to deliver on project schedules. Import pressure, theft, input-cost volatility, grid connection delays, and municipal payment risk continue to limit margins and can delay investment decisions. The South African wire and cable market, therefore, offers opportunities across grid, distributed energy, mining, logistics, and digital infrastructure, although each requires a different mix of conductor materials, insulation, voltage rating, and installation method.
Key Report Takeaways
- By voltage, low-voltage (below 1 kV) cables held 45.82% of revenue share in the South Africa wire and cable market in 2025, while extra- and high-voltage (above 35 kV) cables are projected to expand at a 4.58% CAGR through 2031.
- By cable type, power cable accounted for 69.36% of revenue share in the South Africa wire and cable market in 2025, while fiber-optic cable is projected to grow at a 4.91% CAGR through 2031.
- By conductor material, copper conductors held 53.74% of revenue share in the South Africa wire and cable market in 2025, while optical glass/polymer conductors are projected to advance at a 5.03% CAGR through 2031.
- By installation, overhead cables accounted for 47.18% of revenue share in the South Africa wire and cable market in 2025, while underground cables are projected to expand at a 4.21% CAGR through 2031.
- By end-user vertical, power infrastructure (utilities and renewables) held 27.46% of revenue share in the South Africa wire and cable market in 2025 and is projected to grow at a 4.74% CAGR through 2031.
- By insulation, insulated cables accounted for 89.72% of revenue share in the South Africa wire and cable market in 2025 and are projected to expand at a 3.52% CAGR through 2031.
Note: Market size and forecast figures in this report are generated using Mordor Intelligence’s proprietary estimation framework, updated with the latest available data and insights as of January 2026.
South Africa Wire and Cable Market Trends and Insights
Drivers Impact Analysis*
| Driver | (~) % Impact on CAGR Forecast | Geographic Relevance | Impact Timeline |
|---|---|---|---|
| Transmission and Renewable-Energy Grid Expansion | +1.2% | National, concentrated in Northern Cape, Eastern Cape, and Western Cape, where transmission capacity must connect renewable-energy zones to the national grid | Long term (≥ 4 years) |
| Rural Electrification and Municipal Network Upgrades | +0.5% | National, priority in Limpopo, Eastern Cape, North West, and KwaZulu-Natal, including rural settlements and stressed municipal distribution systems | Medium term (2-4 years) |
| Data Center, 5G and Fiber-Broadband Buildout | +0.4% | National, anchored in Gauteng, Western Cape, and KwaZulu-Natal, with network extensions also serving public facilities and underserved communities | Short term (≤ 2 years) |
| Mining, Industrial and Logistics Electrification | +0.3% | Northern Cape, Limpopo, Mpumalanga, and North West, where mines, industrial facilities, and transport networks require dedicated electrical connections | Medium term (2-4 years) |
| Rooftop Solar, Battery Storage and Distributed Energy Interconnection | +0.2% | National, concentrated in urban and commercial centers, where distributed generation needs safe connection to customer premises and local networks | Short term (≤ 2 years) |
| Private Transmission Projects and Local Manufacturing Pull | +0.2% | Northern Cape, North West, and Gauteng across 7 ITP corridors, with local-content opportunities in transmission components and substation equipment | Medium term (2-4 years) |
| Source: Mordor Intelligence | |||
Transmission and Renewable-Energy Grid Expansion
South Africa's transmission buildout is expected to remain the strongest structural driver for the South Africa wire and cable market through 2031. The National Transmission Company of South Africa's Transmission Development Plan set out ZAR 440 billion (USD 24.4 billion) of investment over 10 years for 14,500 km of powerlines and 133,000 MVA of transformer capacity by 2034, and the plan also identified ZAR 112.5 billion (USD 6.25 billion) for the first 5 years of implementation, giving suppliers greater visibility on the initial procurement period.[1]National Transmission Company South Africa, “Transmission Development Plan 2024: Public Report,” National Transmission Company South Africa, ntcsa.co.za The program directs procurement toward 400 kV corridors, aluminum-conductor steel-reinforced lines, and cross-linked polyethylene insulated feeder cables. The National Treasury reported that phase 1 of the Independent Transmission Program covers 1,164 km across 7 corridors and had 7 prequalified international-led consortia.[2]National Treasury, “Media Statement: Independent Transmission Programme,” National Treasury, treasury.gov.za The scale requires the delivery of an average of 1,450 km of new lines each year, compared with a historical pace of 800 km, underscoring the need for capable supply chains. These projects require suppliers to meet exact technical standards and provide predictable project pipelines, and the transmission program also supports a shift toward extra- and high-voltage products, which are projected to grow faster than the overall South Africa wire and cable market.
Rural Electrification and Municipal Network Upgrades
Rural electrification and municipal rehabilitation support steady demand for low-voltage and medium-voltage cable systems. The Department of Electricity and Energy allocated ZAR 13 billion (USD 722 million) to the Integrated National Electrification Program for its 2030 universal-access target. The program addresses 1.6 million households without electricity, many in rural areas and informal settlements, where overhead conductors and service-connection cables remain necessary. Municipal networks also require refurbishment after delayed maintenance, particularly in 11 kV and 22 kV distribution systems, where distribution upgrades increase the need for compliant replacement cables, rather than only new connections, while Distribution Agency Agreements can direct ring-fenced revenue to distressed municipalities. SANS 1507 and compulsory specification VC 8075 provide a quality baseline for low-voltage fixed installations.[3]South African Bureau of Standards, “SANS 1507 Series: Electric Cables with Extruded Solid Dielectric Insulation for Fixed Installations,” South African Bureau of Standards, sabs.co.za This demand is spread across provinces and offers a more regular order pattern than large transmission projects.
Data Center, 5G and Fiber-Broadband Buildout
Data centers, 5G networks, and broadband expansion are creating additional demand for fiber-optic, power, and control cables in the South Africa wire and cable market. The government allocated ZAR 3 billion (USD 167 million) for SA Connect Phase 2, which targets 1,180 km of new fiber links for government facilities and underserved communities. The Digital Connectivity Investment Roadmap to 2035 identified ZAR 108-142 billion (USD 6.0-7.9 billion) of broadband infrastructure investment needs, which supports the longer-term rationale for fiber procurement. Fiber construction requires optical cable, power distribution, backup-system connections, and equipment wiring at network sites. Data centers also require dense low-voltage cable assemblies and medium-voltage feeders from substations. This demand is concentrated in Gauteng and the Western Cape, although network expansion also reaches KwaZulu-Natal and rural communities.
Mining, Industrial and Logistics Electrification
Mining, industrial, and logistics projects add a separate source of cable demand outside utility procurement. Energy-intensive sites require medium-voltage connections, earthing systems, control wiring, and equipment cables to improve energy supply and production processes. Renewable systems at mines can add interconnection cables, battery wiring, and earthing conductors to the usual industrial cable requirement. The 68 MWac solar project commissioned at Grootegeluk Mine and the 63 MW embedded solar offtake agreement for Sishen Mine illustrate the growing relevance of mine-level power systems. Mining activity in Limpopo, Mpumalanga, North West, and the Northern Cape supports demand for cables designed for more demanding operating conditions. Rail modernization can also require signal and control cable for communications and automated train-protection systems, and these applications give the South Africa wire and cable market exposure to operating investments that are not dependent on residential construction.
Restraints Impact Analysis*
| Restraint | (~) % Impact on CAGR Forecast | Geographic Relevance | Impact Timeline |
|---|---|---|---|
| Copper, Aluminum and Polymer Price Volatility | -0.7% | Global, with direct impact on all South Africa wire and cable producers through imported metals, polymer inputs, currency exposure, and contract pricing | Short term (≤ 2 years) |
| Cable Theft and Replacement-Cycle Disruption | -0.4% | National, with highest severity in Gauteng, KwaZulu-Natal, and Eastern Cape, where network density and resale opportunities increase exposure | Short term (≤ 2 years) |
| Grid-Connection Bottlenecks and Project Delays | -0.3% | Northern Cape, Eastern Cape, and Western Cape renewable energy zones, where delayed grid availability can defer generation and cable installation work | Medium term (2-4 years) |
| Eskom Liquidity, Tariff Uncertainty and Municipal Payment Risk | -0.2% | National, with the highest impact in distressed municipalities, where constrained budgets and late payments affect network maintenance and supplier confidence | Long term (≥ 4 years) |
| Source: Mordor Intelligence | |||
Copper, Aluminum and Polymer Price Volatility
Raw-material volatility remains the most immediate restraint on cable manufacturers and purchasers. Copper, aluminum, and polymer inputs influence quoted prices for power cables, building wire, and insulated products. Copper traded in a USD 13,000-14,000 per metric ton range in the first half of 2026, while aluminum reached USD 3,787.50 per metric ton in June 2026. Because key metal inputs are traded in USD, exchange-rate fluctuations can further increase local procurement costs. Price uncertainty can shorten quotation validity, make long project contracts more difficult to price, and encourage substitution between copper and aluminum where specifications permit. The effect is especially relevant for the South African wire and cable market, as copper products accounted for 53.74% of the material segment's revenue in 2025.
Cable Theft and Replacement-Cycle Disruption
Cable theft damages networks and limits the money available for planned expansion. Eskom identified infrastructure crime as a continuing risk to the reliable supply of electricity and public safety. The input reported annual copper-theft costs to Eskom of ZAR 5-7 billion (USD 278-389 million), plus ZAR 2 billion (USD 111 million) for replacement cables. Replacement work can create short-term cable orders, but it diverts capital from network extensions and system upgrades. Utilities and municipalities must also manage unplanned procurement and uncertain delivery schedules, while higher theft exposure increases the value placed on lower-scrap-value designs, secure routes, and protected installations. This pattern reduces planning certainty for buyers and suppliers in the South Africa wire and cable market.
*Our forecasts treat driver/restraint impacts as directional, not additive. The impact forecasts reflect baseline growth, mix effects, and variable interactions.
Segment Analysis
By Voltage: Grid Transition Lifts High-Voltage Cable Demand
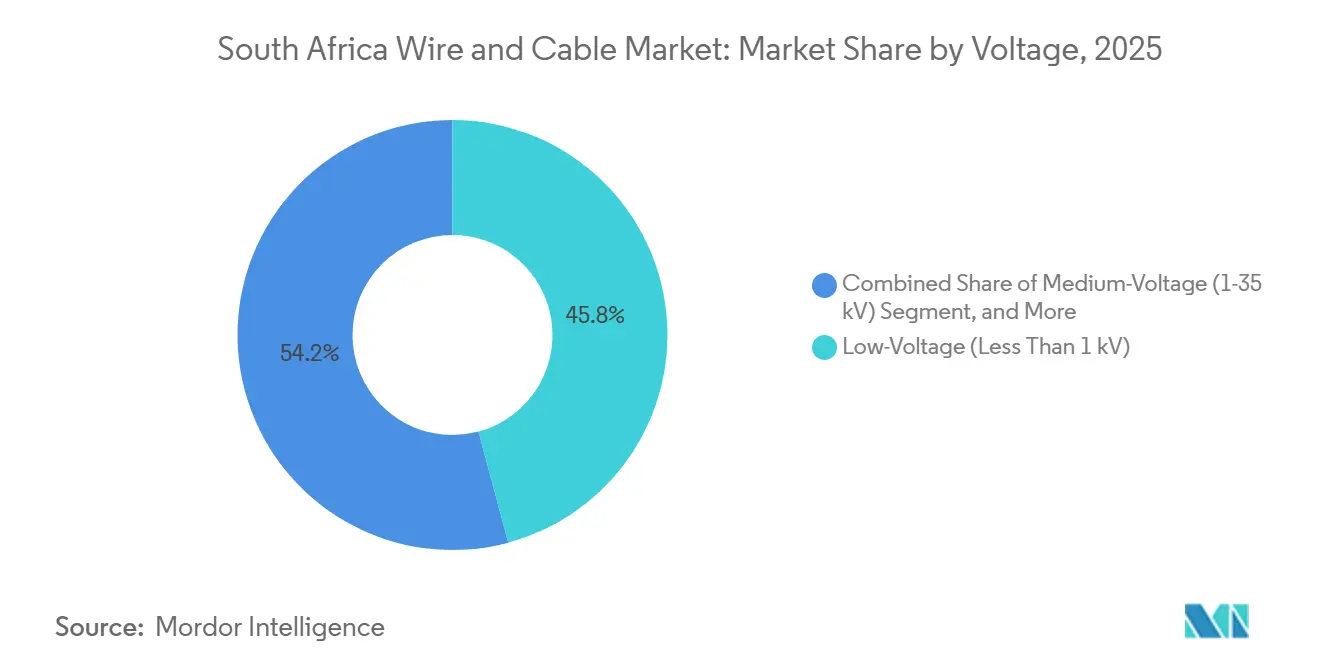
Low-voltage products held 45.82% of segment revenue in 2025, reflecting their use in residential, commercial, and municipal distribution networks. The installed base of low-voltage service connections supports both extension work and replacement purchases. Medium-voltage cables serve distribution substations and industrial feeders across urban networks. Extra- and high-voltage cables are projected to grow at a 4.58% CAGR through 2031, supported by new transmission corridors and renewable-energy connections.
The South Africa wire and cable market size for higher-voltage systems is supported by 400 kV transmission development and substation feeder requirements. The Transmission Development Plan favors applications that need specialized conductors and cross-linked polyethylene insulation. Higher-voltage work also has stricter technical and qualification requirements than routine low-voltage supply. These requirements may favor manufacturers that can produce compliant products and support project delivery. Digital infrastructure adds demand across voltage tiers, from internal low-voltage cable trays to medium-voltage feeder connections. Substation projects also require earthing, control, and communication cables, in addition to the main transmission conductor. The product mix, therefore, varies between inter-regional line construction and urban connection works.



By Cable Type: Power Cables Lead as Fiber Optics Accelerate
Power cables accounted for 69.36% of segment revenue in 2025, as they are used across utilities, industrial sites, commercial buildings, and renewable projects. Utility and renewable construction requires medium-voltage and high-voltage connections between generation assets, substations, and the grid. Signal and control cables support protection relays, process instrumentation, and supervisory control and data acquisition systems. Coaxial and data cables serve broadcast, telemetry, and industrial automation applications.
Fiber-optic cable is projected to grow at a 4.91% CAGR through 2031, supported by broadband and network expansion. The South Africa wire and cable market is also affected by the government's SA Connect Phase 2 program, which targets new fiber links for public facilities and underserved communities. Grid operators need fiber for communications and protection systems as well as telecom networks. Compliance with recognized optical-fiber specifications remains important for procurement quality. Fiber growth, therefore, adds a distinct communication-focused demand stream alongside power cable volume. Local fiber producers can benefit when network operators seek dependable lead times and recognized technical compliance. The category also depends on deployment schedules for access networks, mobile backhaul, and data-center connectivity.
By Conductor Material: Copper Leads Amid Optical Glass Rise
Copper conductors accounted for 53.74% of material-segment revenue in 2025, supported by their established use in utility and industrial installations. Copper's conductivity and established installation base maintain its role in many electrical systems. Aluminum conductors are lighter and lower cost, and they are widely used in overhead transmission lines. The materials used in a project depend on technical standards, installation design, theft exposure, and the cost of inputs.
Optical glass and polymer conductors are projected to grow at a 5.03% CAGR through 2031, the highest rate among conductor materials. Fiber-to-the-home, fiber-to-the-business, 5G backhaul, and data-center connections support this outlook. The South African wire and cable market share of copper remains exposed to substitution, as aluminum can meet the required specifications. Material choice can also shift toward products with lower scrap value in theft-prone locations. SANS 1507 requirements limit material switching in regulated low-voltage infrastructure. Optical fiber does not replace a metallic conductor in all applications, since it is used for communication rather than electrical power transfer. This keeps growth in optical glass and polymer products, adding to rather than replacing much of the power cable base.
By Installation: Overhead Cables Dominate While Underground Gains Ground
Overhead installations held 47.18% of segment revenue in 2025, driven by transmission expansion and rural low-voltage distribution. Aerial systems remain cost-effective across large, lower-density areas. The planned transmission corridors rely primarily on overhead lines, which support demand for aluminum-conductor steel-reinforced products. Submarine cables remain the smallest installation sub-segment and serve specialized nearshore and connection applications.
Underground cables are projected to grow at a 4.21% CAGR through 2031, supported by urban density, reliability needs, and theft mitigation. The South Africa wire and cable market size for underground systems is linked to urban substations and distribution upgrades that require buried feeder cables. Underground cross-linked polyethylene cables can reduce the exposure of copper to theft but require more complex civil work. VC 8075 and SANS 1339 provide relevant safety and product requirements for fixed installations and medium-voltage cable. This creates a different demand profile from the large overhead transmission program. Underground projects may involve smaller route lengths than transmission corridors, but they can require specialized joints, terminations, and installation practices. Their use is most relevant where space, security, or service reliability makes aerial systems less suitable.
By End-User Vertical: Power Infrastructure Anchors Demand Across All Channels
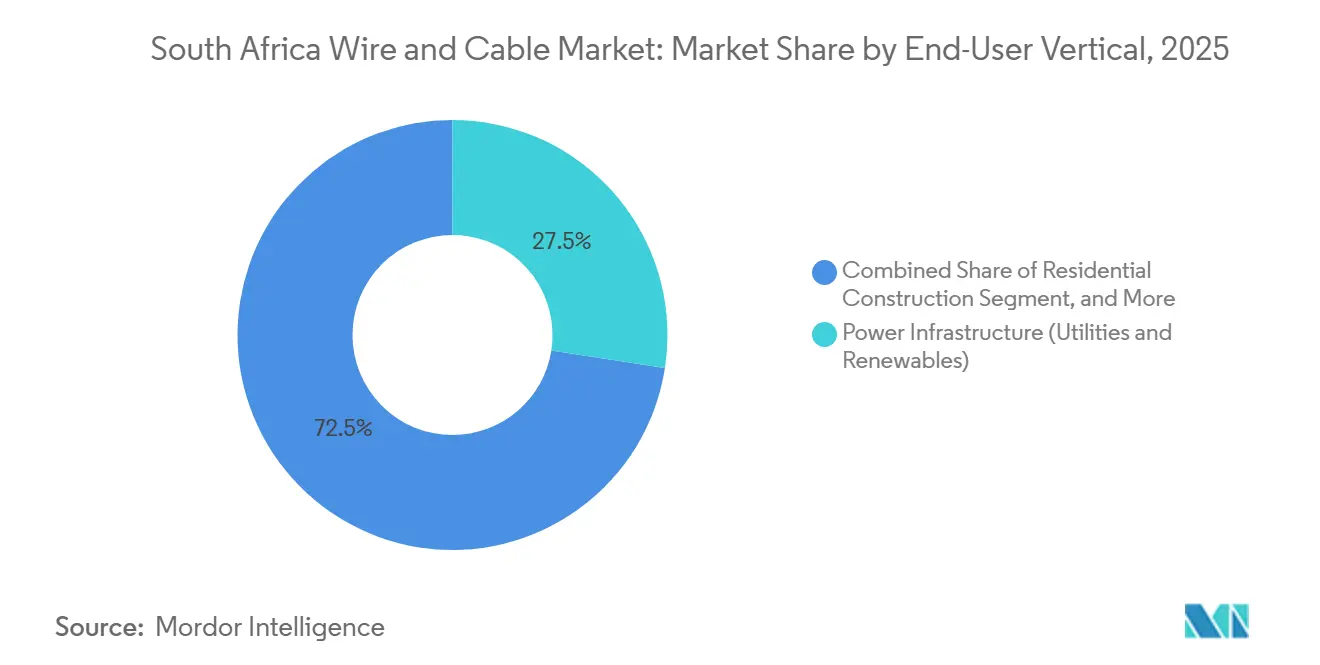
Power infrastructure, including utilities and renewable energy, held 27.46% of end-user segment revenue in 2025. It is also projected to grow at a 4.74% CAGR through 2031, the fastest rate among end-user categories. Grid rehabilitation, new transmission lines, and private renewable projects support demand for power and control cables. The South Africa wire and cable market share held by this vertical reflects its connection to national electricity infrastructure.
Residential and commercial construction provides demand for building wire and distribution cable, particularly in major metropolitan areas. Telecommunications and data centers support fiber, power, and internal cabling requirements. Mining, manufacturing, and logistics also use control, signal, and heavy-duty power cables. Industrial buyers often need cables suited to specific equipment and operating conditions. This broad set of users reduces dependence on any single construction cycle, while power infrastructure remains the core demand source. Different end users also place different emphasis on fire performance, durability, mechanical protection, and data transmission quality. Suppliers that serve several verticals can balance large project orders with recurring maintenance and replacement demand.
By Insulation: Insulated Cables Command Near-Complete Market Coverage
Insulated cables accounted for 89.72% of segment revenue in 2025 and are projected to expand at a 3.52% CAGR through 2031. Their large share reflects the wide range of installations that require electrical insulation for safety and performance. Low-voltage fixed installations are subject to the SANS 1507 series and compulsory specification VC 8075. Cross-linked polyethylene, polyvinyl chloride, and rubber insulation are used according to voltage, heat, and operating requirements.
Cross-linked polyethylene is increasingly used at medium and high voltage because it supports higher operating temperatures and lower dielectric losses than polyvinyl chloride. Non-insulated conductors make up the remaining 10.28% and are used mainly in overhead transmission applications. The South Africa wire and cable market relies on both insulated and bare-conductor products because grid projects have different engineering requirements. Product compliance is significant because substandard insulation can create safety and reliability risks. This distinction supports continued demand for tested and certified insulated cable in regulated infrastructure. Insulation selection also affects a cable's suitability for heat, moisture, chemical exposure, and mechanical stress. Product design must therefore align with the engineering requirements of the final installation.
Geography Analysis
Gauteng accounts for the largest share of cable demand, driven by commercial construction, data centers, and distribution refurbishment. Johannesburg's dense electricity network requires regular maintenance and replacement work. The province also has a high concentration of digital infrastructure that needs fiber and power connections. These conditions support demand for low-voltage, medium-voltage, fiber-optic, and control cables. The South Africa wire and cable market size in Gauteng is therefore linked to both economic activity and network reliability needs.
The Western Cape and Northern Cape form another important demand area, although their drivers differ. Western Cape demand is associated with Cape Town's data infrastructure, commercial construction, and connectivity activity, while the Northern Cape has concentrated solar and wind development that requires high-voltage feeders and overhead conductors. NTCSA transmission planning prioritizes grid strengthening in renewable-energy regions, including the Northern Cape, Eastern Cape, and Western Cape. These projects are expected to support cable demand connected to substations and transmission lines.
KwaZulu-Natal, Limpopo, North West, and the Eastern Cape form an electrification and industrial demand group. KwaZulu-Natal combines port logistics, industrial activity, and residential development, while Limpopo and North West are priorities for electrification work under the Integrated National Electrification Program. The Eastern Cape has automotive manufacturing activity, while mining in Mpumalanga, Limpopo, and North West supports demand for industrial cables. This geographic mix distributes the South African wire and cable market across urban, rural, industrial, and renewable-energy applications. Provincial demand is consequently shaped by local infrastructure needs instead of a single national purchasing pattern.
Competitive Landscape
The South Africa wire and cable market has a hybrid competitive structure. Large domestic manufacturers compete with multinational suppliers and fiber-focused companies with international parent companies. Aberdare Cables and CBi-electric: African cables are established local participants, while Nexans Trade, Prysmian, and NKT represent multinational competition. Mid-sized companies include Alvern Cables, South Ocean Electric Wire, Malesela Taihan Electric Cable, and Unity Cables, with competition based on product range, local manufacturing capabilities, compliance with standards, delivery performance, and customer relationships.
Higher-voltage capability is becoming more important as transmission projects move toward 400 kV corridors and related substation work. NTCSA's transmission plan provides a clear reason for suppliers to develop suitable high-voltage products and services. Local-content development in transmission components can strengthen the position of domestic producers that meet specifications, while fiber specialists, including AM Hengtong Africa Telecoms, Yangtze Optics Africa Cable, and ZTT South Africa, address demand for optical cable. Their supply chains may support competitive pricing in a category expected to grow faster than other cable types.
Imports remain a material competitive challenge, particularly in low-voltage products. Compliance with SANS 1507 and VC 8075 is important because it creates a common quality requirement for fixed-installation cable. Manufacturers with current type testing and recognized quality records can have stronger access to utility and municipal procurement. Cable theft also creates demand for lower-scrap-value products and protected installation options. The South Africa wire and cable market is therefore competitive but not dominated by a single supplier. The available information does not provide combined share data for the leading companies, so a numeric concentration score cannot be substantiated.
South Africa Wire and Cable Industry Leaders
Aberdare Cables (Pty) Ltd
CBi-electric: African Cables (Pty) Ltd
Malesela Taihan Electric Cable (Pty) Ltd
South Ocean Electric Wire Company (Pty) Ltd
Alvern Cables (Pty) Ltd
- *Disclaimer: Major Players sorted in no particular order

Recent Industry Developments
- July 2026: Exxaro Resources' wholly owned energy business, Cennergi, confirmed commercial operations of the 68 MWac Lephalale Solar Project at Grootegeluk Mine in Limpopo, South Africa's first operating behind-the-meter solar facility for a coal mine. The project, operating under a 25-year power purchase agreement and designed to generate 176 GWh of renewable electricity annually, required dedicated XLPE medium-voltage cables and inverter-wiring infrastructure. It is also licensed for future battery energy storage integration, potentially adding further cable scope.
- June 2026: The NTCSA awarded Eskom Rotek Industries a ZAR 53.2 million (USD 2.96 million) stringing and cabling contract for transformer replacement at Impala substation in KwaZulu-Natal. The award, confirmed on June 26, 2026, reflected ongoing high-voltage cable work embedded within the TDP refurbishment stream and demonstrated sustained substation-level cable procurement.


South Africa Wire and Cable Market Report Scope
The South Africa wire and cable market revenue is generated through the sale of low-, medium-, and high-voltage wires and cables, including power, fiber-optic, signal and control, and coaxial/data cables with copper, aluminum, or optical glass/polymer conductors, along with associated value-added products and installation-specific solutions for overhead, underground, and submarine network deployments.
The South Africa wire and cable market report is segmented by voltage (extra- and high-voltage (greater than 35 kV), medium-voltage (1-35 kV), and low-voltage (less than 1 kV)), cable type (power cable, fiber-optic cable, signal and control cable, and coaxial and data cable), conductor material (copper, aluminum, and optical glass/polymer), installation (overhead, underground, and submarine), end-user vertical (residential construction, commercial construction, power infrastructure (utilities and renewables), telecommunications and data centers, oil and gas and petrochemicals, automotive and mobility, and industrial manufacturing), and insulation (insulated and non-insulated). The market forecasts are provided in terms of value (USD).
| Extra- and High-Voltage (Greater Than 35 kV) |
| Medium-Voltage (1-35 kV) |
| Low-Voltage (Less Than 1 kV) |
| Power Cable |
| Fiber-Optic Cable |
| Signal and Control Cable |
| Coaxial and Data Cable |
| Copper |
| Aluminum |
| Optical Glass/Polymer |
| Overhead |
| Underground |
| Submarine |
| Residential Construction |
| Commercial Construction |
| Power Infrastructure (Utilities and Renewables) |
| Telecommunications and Data Centers |
| Oil and Gas and Petrochemicals |
| Automotive and Mobility |
| Industrial Manufacturing |
| Insulated |
| Non-Insulated |
| By Voltage | Extra- and High-Voltage (Greater Than 35 kV) |
| Medium-Voltage (1-35 kV) | |
| Low-Voltage (Less Than 1 kV) | |
| By Cable Type | Power Cable |
| Fiber-Optic Cable | |
| Signal and Control Cable | |
| Coaxial and Data Cable | |
| By Conductor Material | Copper |
| Aluminum | |
| Optical Glass/Polymer | |
| By Installation | Overhead |
| Underground | |
| Submarine | |
| By End-User Vertical | Residential Construction |
| Commercial Construction | |
| Power Infrastructure (Utilities and Renewables) | |
| Telecommunications and Data Centers | |
| Oil and Gas and Petrochemicals | |
| Automotive and Mobility | |
| Industrial Manufacturing | |
| By Insulation | Insulated |
| Non-Insulated |


Key Questions Answered in the Report
What is the size of the South Africa wire and cable market?
The South Africa wire and cable market was valued at USD 0.87 billion in 2025 and is estimated at USD 0.89 billion in 2026. It is forecast to reach USD 1.05 billion by 2031, with a 3.36% CAGR during 2026-2031. These figures describe total market value and should not be used to infer the value of individual segments.
What is driving wire and cable demand in South Africa?
Transmission expansion, renewable projects, municipal network upgrades, electrification, and fiber deployment support demand for electrical and communication cables. Mining and logistics electrification add further requirements for power, signal, control, and earthing products.
Which voltage category is growing fastest in South Africa?
Extra- and high-voltage cables are projected to expand at a 4.58% CAGR through 2031, supported by transmission and renewable-energy connections. The category benefits from the planned 400 kV corridors and associated substation feeder projects.
Which cable type has the largest share in South Africa?
Power cable accounted for 69.36% of segment revenue in 2025 because it serves utility, industrial, commercial, and renewable-energy applications. It covers connections across generation, distribution, buildings, and operating equipment, which makes it the core cable category for many end users.
Why is fiber-optic cable demand rising in South Africa?
Fiber-optic cable is projected to grow at a 4.91% CAGR through 2031, supported by broadband expansion, 5G networks, data centers, and public connectivity programs. It is used for telecommunications links, network backhaul, and grid communications systems.
What issues affect cable suppliers in South Africa?
Input-cost volatility, theft, import competition, standards compliance, grid connection delays, and municipal payment risk can affect procurement and margins. These factors can influence contract pricing, delivery planning, product selection, and the timing of capital investment across projects, routine network maintenance, and replacement activity throughout the cable supply chain.
Page last updated on:





