
South Africa Data Center Rack Market Size and Share
Market Overview
| Study Period | 2020 - 2031 |
|---|---|
| Forecast Data Period | 2026 - 2031 |
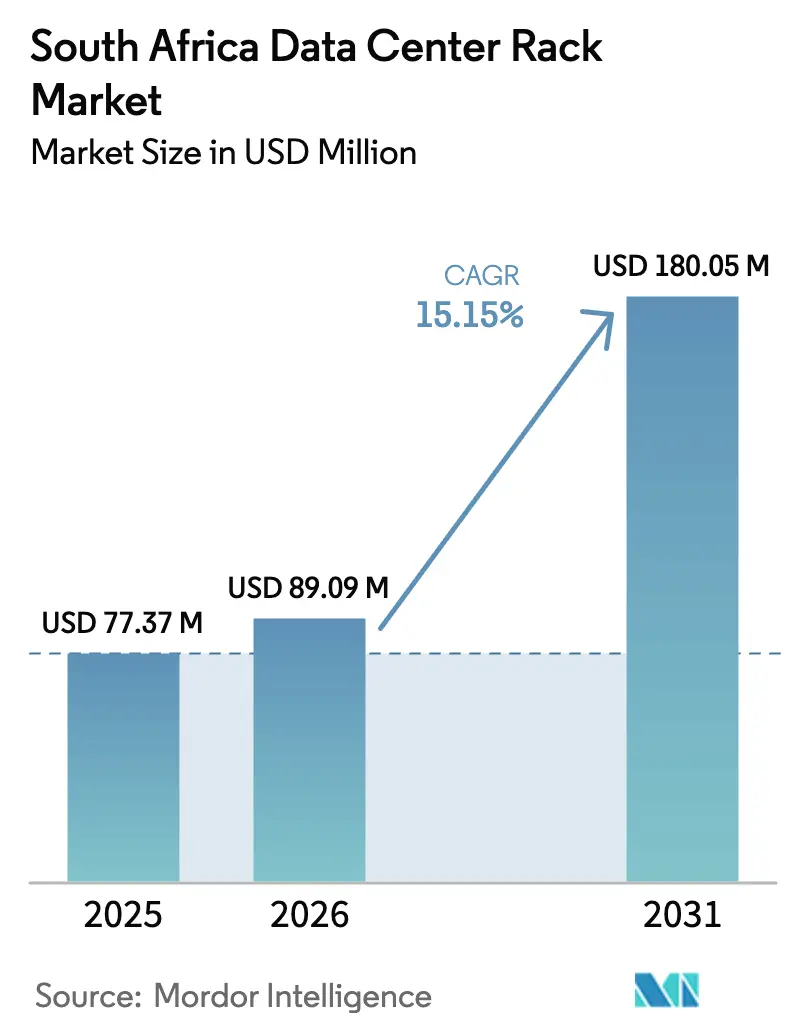
| Base Year Market Size (2025) | USD 77.37 Million |
| Market Size (2026) | USD 89.09 Million |
| Market Size (2031) | USD 180.05 Million |
| Growth Rate (2026 - 2031) | 15.15 % |
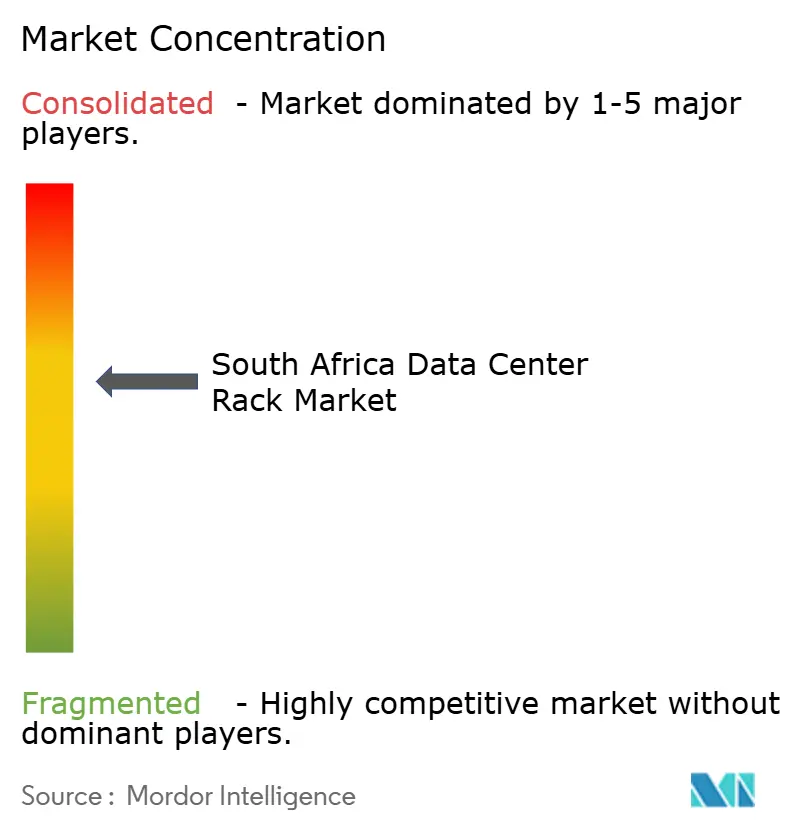
| Market Concentration | Medium |
Major Players *Disclaimer: Major Players sorted in no particular order Image © Mordor Intelligence. Reuse requires attribution under CC BY 4.0. | |
South Africa Data Center Rack Market Analysis by Mordor Intelligence
The South Africa data center rack market size was valued at USD 77.37 million in 2025 and estimated to grow from USD 89.09 million in 2026 to reach USD 180.05 million by 2031, at a CAGR of 15.15% during the forecast period (2026-2031). Heightened hyperscale investments, expanding enterprise cloud migration, and greater reliance on AI workloads are propelling demand for standardized, high-density racks across both new builds and facility retrofits. Microsoft’s ZAR 5.4 billion (USD 300 million) AI infrastructure commitment highlights the scale of capital flowing into the country’s digital backbone. At the same time, Teraco’s syndicated R8 billion loan and Google Cloud’s Johannesburg region have elevated South Africa to Africa’s preferred connectivity hub. Market momentum is also supported by 5G roll-outs, FTTH/B expansion, and new submarine-cable landings that together push compute closer to users and ignite edge rack demand. Supply-chain realignments—including the closure of ArcelorMittal’s long-steel line and Hillside Aluminium’s capacity expansion—are reshaping material choices and cost structures within the South Africa data center rack market
Key Report Takeaways
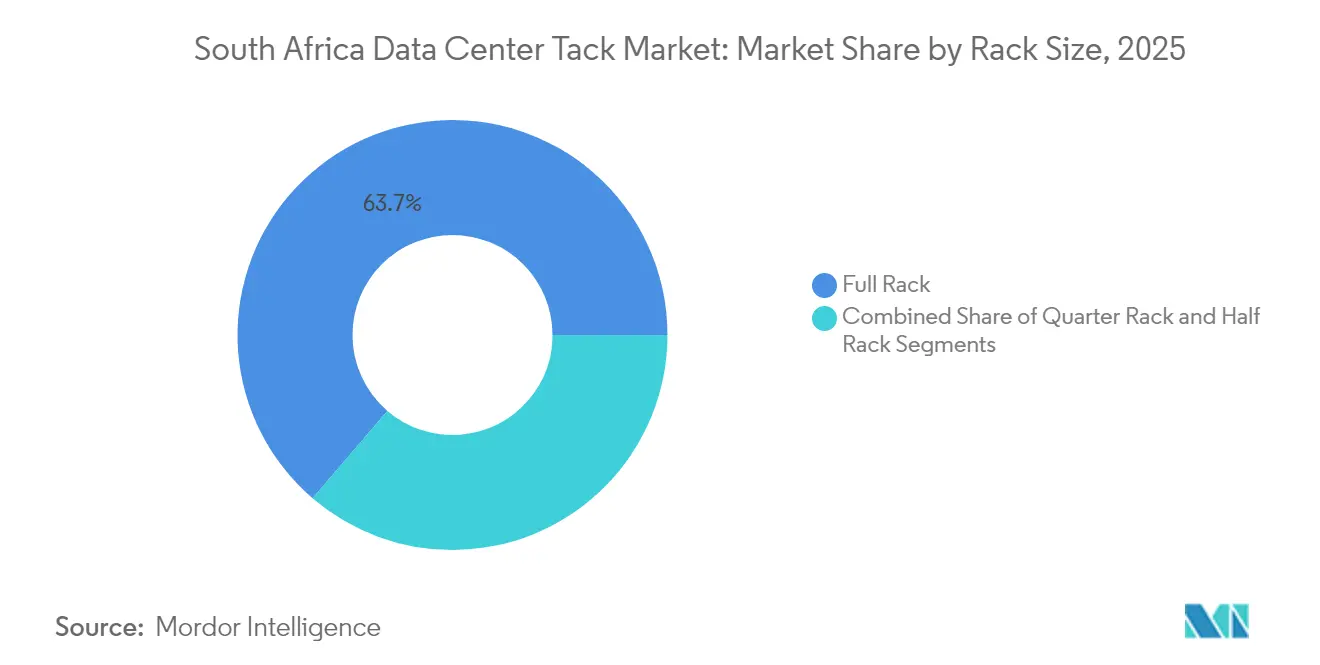
- By rack size, full racks led with 63.72% of South Africa data center rack market share in 2025; quarter racks recorded the fastest 16.65% CAGR through 2031.
- By rack height, the 42U segment held 51.45% revenue share of the South Africa data center rack market size in 2025, while 48U is projected to advance at a 15.74% CAGR to 2031.
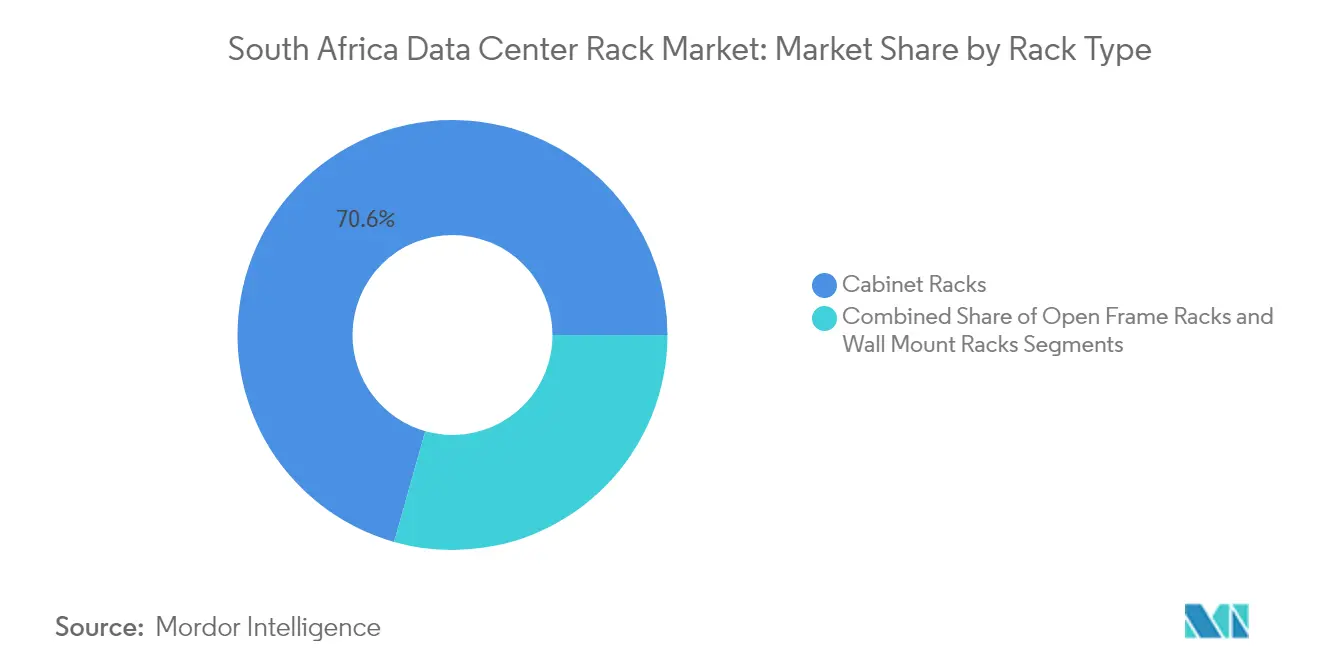
- By rack type, cabinet racks accounted for 70.62% of 2025 revenue; open-frame racks are poised for a 15.35% CAGR through 2031.
- By data-center type, colocation facilities captured 52.88% of 2025 deployments; hyperscale and cloud service providers are expanding at a 17.05% CAGR.
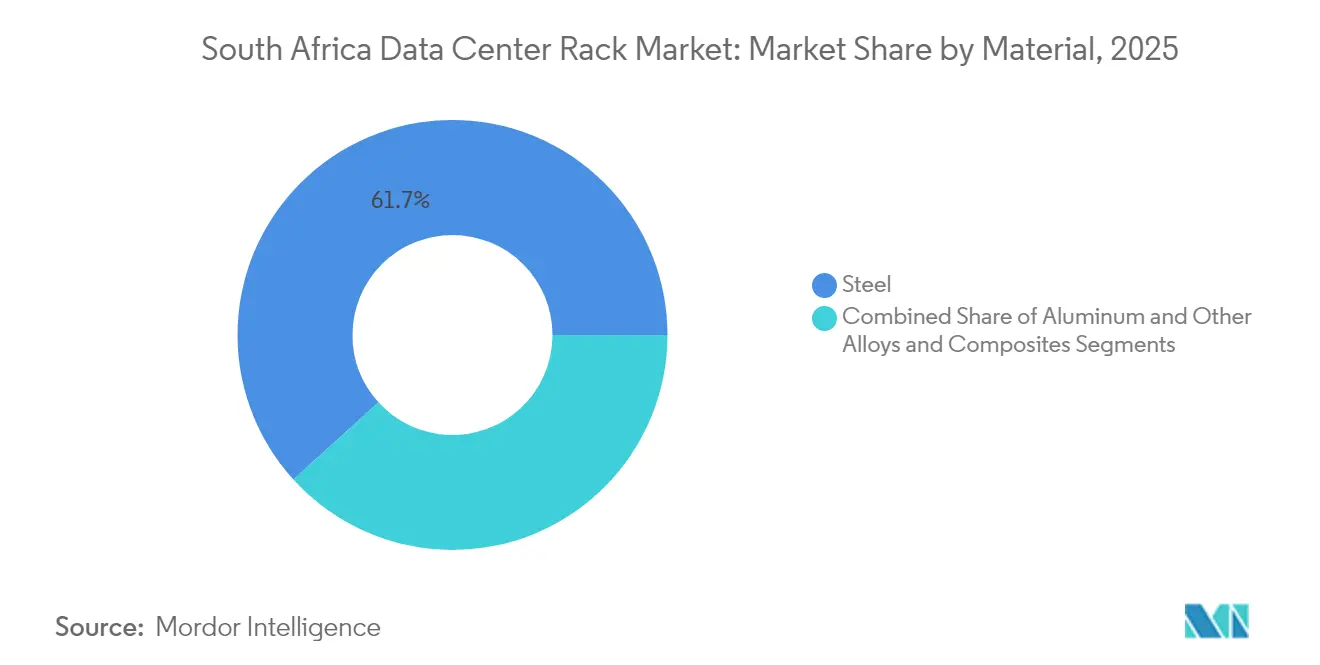
- By material, steel commanded 61.74% of 2025 revenue, whereas aluminum is forecast to grow at a 15.62% CAGR as operators seek lighter, corrosion-resistant alternatives.
Note: Market size and forecast figures in this report are generated using Mordor Intelligence’s proprietary estimation framework, updated with the latest available data and insights as of 2026.
South Africa Data Center Rack Market Trends and Insights
Drivers Impact Analysis*
| Driver | (~)% Impact on CAGR Forecast | Geographic Relevance | Impact Timeline |
|---|---|---|---|
| Rapid expansion of hyperscale and local cloud regions | +3.2% | National, concentrated in Johannesburg and Cape Town | Medium term (2-4 years) |
| Surging 5G & FTTH/B penetration driving edge racks | +2.8% | National, with early gains in Gauteng, Western Cape, KwaZulu-Natal | Long term (≥ 4 years) |
| Enterprise shift from on-prem to colocation facilities | +2.1% | National, primarily Johannesburg financial district | Short term (≤ 2 years) |
| Upcoming submarine-cable landings boosting traffic | +1.9% | Coastal regions, Cape Town and Durban landing points | Medium term (2-4 years) |
| Eskom grid-modernization incentives for onsite renewables | +1.4% | National, prioritizing grid-constrained areas | Long term (≥ 4 years) |
| Local‐content procurement boosting domestic rack build | +1.1% | National, manufacturing hubs in Gauteng | Medium term (2-4 years) |
| Source: Mordor Intelligence | |||
Full Rack is Expected to Grow Significantly
Hyperscale operators now set the pace for the South Africa data center rack market. Microsoft’s record domestic investment, AWS’s Cape Town presence, and Google Cloud’s new Johannesburg region drive uniform rack requirements that allow enterprises to adopt multi-cloud strategies with minimal integration risk.[1]Google Cloud, “Johannesburg Cloud Region Now Open,” cloud.google.comThese facilities demand fully loaded, 42U- or 48U-high racks engineered for 30 kW-plus thermal envelopes, spurring suppliers to deliver precision-cooled enclosures with tool-less cable management. Capital outlays from Vantage Data Centers—backed by a EUR 1.4 billion (USD 1.61 billion) EMEA fund raise—reinforce confidence in the local hyperscale pipeline.
Surging 5G & FTTH/B Penetration Driving Edge Racks
National 5G coverage surpassed 50% of the population in 2024 and, coupled with nearly 2 million fiber-to-home lines, is pushing compute workloads toward smaller, hardened racks in base-station shelters and roadside cabinets. MTN and Vodacom specify short-depth racks with integrated dust filters and DC-power buses suited to telecom power plants, while industrial firms adopt ruggedized enclosures for mining sites where latency requirements preclude centralized processing.[2] ITWeb, “Edge Computing in Industrial Sectors,” itweb.co.za
Enterprise Shift from On-Prem to Colocation Facilities
Power-supply instability and escalating security standards are encouraging South African companies to exit self-hosted server rooms. Old Mutual’s full migration of 215 applications to AWS typifies this pivot, while Takealot’s relocation of core databases to Google Cloud underscores the shift toward hybrid cloud architectures. As a result, colocation providers standardize full-rack footprints that blend high-density power shelves with modular blanking panels, supporting rapid capacity scale-out without custom engineering.
Upcoming Submarine-Cable Landings Boosting Traffic
The 2Africa, Equiano, and newly announced Meta Mumbai route cables will more than triple international bandwidth landing in South Africa by 2027, lowering transit prices and drawing CDN nodes into Cape Town and Durban. Content providers respond by leasing contiguous rack lines for cache clusters requiring 400 Gbps spine fabrics, advancing full-rack sales ,and accelerating demand for non-blocking power distribution units.
Restraints Impact Analysis*
| Restraint | (~)% Impact on CAGR Forecast | Geographic Relevance | Impact Timeline |
|---|---|---|---|
| High data-centre CAPEX & security requirements | -2.3% | National, affecting all facility types | Short term (≤ 2 years) |
| Electricity-supply instability & costly backup power | -3.1% | National, severe in industrial areas | Short term (≤ 2 years) |
| Volatile local steel prices after safeguard duties | -1.8% | National, manufacturing centers | Medium term (2-4 years) |
| Skilled‐labour shortage in precision fabrication | -1.4% | National, concentrated in Gauteng manufacturing | Long term (≥ 4 years) |
| Source: Mordor Intelligence | |||
High Data-Center CAPEX & Security Requirements
New Tier III/Tier IV facilities require redundant feeds, biometrics, and rack-level access logs that lift enclosure costs 25-30% above commodity frames.[3]Government of South Africa, “National Cybersecurity Policy Framework,” gov.za Teraco’s JB7 build illustrates the capital burden, with rack systems representing nearly one-fifth of the project spend . Some enterprises delay refresh cycles or extend equipment life, which tempers near-term volume growth across the South Africa data center rack market.
Electricity-Supply Instability & Costly Backup Power
Load-shedding stages throughout 2024 forced operators to install larger battery strings and diesel generators, prompting rack designs that accommodate in-row UPS modules and busway redundancy. Teraco’s 120 MW solar plant addresses long-term resilience but also shifts specification toward racks pre-wired for renewable-friendly DC buses. Smaller facilities struggle to fund similar upgrades, limiting broad-based rollouts in the South Africa data center rack industry.
*Our forecasts treat driver/restraint impacts as directional, not additive. The impact forecasts reflect baseline growth, mix effects, and variable interactions.
Segment Analysis
By Rack Size: Full Racks Enable Standardized Growth
Full racks captured 63.72% revenue in 2025 and are forecast to expand at 16.12% CAGR, a dual leadership underpinned by hyperscale purchasing frameworks favoring uniform footprints. This dominance steers manufacturers toward volume production that lowers per-unit cost and reduces supply risk across the South Africa data center rack market. Quarter racks remain essential for micro-edge cabinets deployed in 5G base stations, while half-rack uptake centers on mid-tier enterprises consolidating into suburban colocation halls.
The standardization of full racks converges with the 42U and 48U height formats, enabling shared accessory ecosystems—rails, PDUs, blanking panels—that simplify stocking for distributors. Operators such as Microsoft design AI clusters around full racks that sustain 80 kg per-U static loads, necessitating reinforced frames with cold-aisle containment kits. These functional convergences continue to broaden the customer base for full racks throughout the South Africa data center rack market.



By Rack Height: 48U Ascends While 42U Retains Core Position
The 42U format held 51.45% revenue in 2025 but loses incremental share to 48U racks advancing at 15.74% CAGR. Hyperscalers prize the taller design for augmented GPU count per footprint, thereby improving facility power-usage effectiveness without lengthening build timelines.
Edge sites, in contrast, prefer shorter enclosures that fit beneath false ceilings or inside street cabinets. Consequently, suppliers offer convertible kits that allow 42U frames to stack 600 mm extensions, maintaining backwards compatibility while letting clients test higher-density layouts. This adaptability helps balance legacy support with emergent 48U demand across the South Africa data center rack market.
By Rack Type: Cabinet Security Sustains Premium Demand
Cabinet racks accounted for 70.62% of 2025 shipments and continue to outpace open-frame alternatives due to mandatory compliance with the National Cybersecurity Policy Framework. Financial institutions require swing-handle locks and dual-factor access logging, features natively integrated into sealed cabinets but costly to retrofit on open frames.
Open-frame racks serve high-airflow zones and test labs where fast hardware swaps eclipse security. Wall-mount racks cater to edge deployments at cellular base-stations. This tiered mix encourages manufacturers to maintain three distinct product lines while channel partners bundle in-rack cooling or door-mounted power meters that raise margins in the South Africa data center rack market.
By Data Center Type: Hyperscale Growth Outruns Colocation Base
Colocation halls delivered 52.88% of 2025 rack deployments, reflecting enterprise preferences for hosted infrastructure that preserves hardware control. Hyperscale and cloud provider builds, however, post a 17.05% CAGR as Amazon, Microsoft, and Google extend regional footprints and align with data-residency mandates.
Hyperscale procurement favors bulk orders of thousands of identical racks, often sourced through global framework contracts. Domestic OEMs compete by offering last-mile modifications—solar-ready busbars, tamper-evident doors, or high-altitude ventilation kits—that international suppliers cannot deliver within tight lead times. This localization edge differentiates local contenders within the South Africa data center rack market.
By Material: Aluminum Climbs Despite Steel Supremacy
Steel secured 61.74% of 2025 sales, aided by Buy-Local rules and well-established milling capacity. Yet ArcelorMittal’s long-steel shutdown and volatile import duties raise price variance, nudging operators toward aluminum frames that cut weight by 35% and improve corrosion resistance.
Hillside Aluminium’s 719,000 ton plant supplies raw billet, but limited precision-fabrication skills constrain domestic rack output. Importers bridge gaps with knock-down kits assembled in Johannesburg free-zones to satisfy local-content thresholds. Composite alloys serve EMI-shielded cabinets for military and financial clients, but remain niche in the broader South Africa data center rack market.
Geography Analysis
Gauteng province dominates rack demand, anchored by Johannesburg’s financial hub and Pretoria’s government agencies. The cluster contains four hyperscale campuses and more than 60% of colocation white-space, creating sustained pull for full racks and spurring local assembly plants that shorten delivery cycles.
The Western Cape follows, driven by AWS’s Cape Town region and proximity to Equiano and 2Africa cable landings. Coastal latency advantages encourage CDN operators to lease contiguous rows of GPU-oriented racks for video streaming and generative AI inference. The South Africa data center rack market size attributed to the Western Cape is growing at a high-teens CAGR as these operators layer new halls onto existing sites.
KwaZulu-Natal ranks third, leveraging Durban’s role as a logistics gateway and emerging manufacturing zone. Provincial incentives support modular containerized data centers serving maritime and petrochemical operations that require hardened, salt-spray resistant racks. The Eastern Cape and Free State trail due to limited backhaul fiber and grid constraints, but renewable-energy corridors under Eskom’s modernization program could unlock future rack deployments if micro-grid pilots prove viable.
Regulatory Landscape
South Africa's data center rack requirements are shaped by national policy and sector compliance expectations around data protection, cybersecurity, and public-sector procurement. The Protection of Personal Information Act (POPIA) governs personal-data processing and imposes conditions on cross-border transfers. That dynamic supports in-country hosting and increases demand for standardized, secure cabinet racks with access control and auditability. In 2024, the National Policy on Data and Cloud formalized a public-sector cloud and data approach and tasked the State Information Technology Agency (SITA) with developing technical standards for public-sector data center acquisition and operations, reinforcing specification-driven rack deployments in government workloads.
At the same time, policy signaling on infrastructure resilience is placing data centers alongside other strategic utilities. In February 2026, industry coverage highlighted a policy shift that treats data centers as critical infrastructure alongside categories such as electricity and ports, with the stated intent of improving prioritization in areas such as grid connection and self-generation approvals. This direction, alongside dtic investment tools and industry bodies such as ISPA and ADCA engaging on enabling conditions, is pushing rack specifications toward power-resilient designs (space for in-row UPS, busways, and monitoring) while raising the compliance bar for physical security and operational controls.
Competitive Landscape
Competition centers on a blend of global OEMs and agile domestic fabricators. Schneider Electric, Vertiv, and Rittal capture large enterprise and hyperscale contracts thanks to global certifications, on-shore spare parts, and 24/7 service desks They bundle racks with PDUs, intelligent monitoring, and containment aisles, positioning themselves as one-stop infrastructure vendors in the South Africa data center rack market.
Local suppliers—Modac Data Centre Design, CPS Technologies, and Server-Racks Africa—leverage quick turn-around, custom metalwork, and BBBEE compliance to win mid-size and edge projects. Their familiarity with Eskom’s grid codes enables bespoke busbar integrations that global rivals rarely offer on short notice.
Strategic moves underscore widening moats:
- Schneider Electric opened a Johannesburg experience center in 2024 to showcase liquid-cooling-ready cabinets.
- Vertiv expanded its BBBEE-compliant partnership with i-Rack Africa to assemble Italian frame designs locally.
- Teraco’s 120 MW solar-powered campus incorporates Vertiv’s SmartAisle ECO system, illustrating co-innovation between operator and rack vendor
South Africa Data Center Rack Industry Leaders
Schneider Electric SE
Vertiv Group Corporation
Rittal GmbH & Co. KG
Delta Electronics (Delta Power & Cooling)
Eaton Corporation plc
- *Disclaimer: Major Players sorted in no particular order

Market Opportunities and Future Outlook
A clear opportunity is compliance-aligned, standardized rack and enclosure packages for the public sector and other regulated industries, where procurement and operational standards are converging. The 2024 National Policy on Data and Cloud assigns SITA a role in technical standards for public-sector data center acquisition and operations. That creates a pathway for suppliers to offer repeatable 42U/48U cabinet platforms with locking, logging, and lifecycle documentation that can map to procurement checklists. POPIA-driven needs for in-country hosting also keep domestic capacity relevant, increasing the value of secure cabinets and rack-level auditing features for enterprises consolidating into colocation.
A second opportunity is faster build-out through modularization and power-integrated rack ecosystems, particularly in grid-constrained projects. dtic programs such as the Critical Infrastructure Programme, along with the broader investment toolkit referenced in market briefs (including mechanisms such as SEZ-linked incentives), support infrastructure rollouts. The February 2026 shift to recognize data centers as critical infrastructure also strengthens the case for prioritized connections and streamlined self-generation approvals. On the supply side, the local material and assembly ecosystem remains uneven, and ArcelorMittal South Africa's long-steel closure adds friction for rack makers. That disruption increases demand for alternative materials, knock-down assembly models, and vendor-managed inventory in Gauteng and coastal projects that need predictable lead times.
Recent Industry Developments
- July 2026: Eaton announces successful installation of its bespoke xModular modular power system at Africa Data Centres' 10 MW facility in Johannesburg, an off-site modular build scalable for upgrades. The deployment demonstrates a scalable power and rack integration approach in SA. It expands the footprint of modular power systems in Johannesburg's data center market.
- June 2026: Open Access Data Centres (Parklands) / Vertiv standardises on Vertiv infrastructure solutions for its Johannesburg data centre to enable faster capacity deployment. The arrangement shows local adoption of integrated cabinet and power systems. It could broaden the use of rack and module based deployments across SA markets.
- April 2026: Vertiv announces four new or expanding manufacturing facilities to grow capacity for infrastructure solutions, power, and integrated cabinets including rack related manufacturing capacity for AI high density data centres. The move strengthens supply of cabinet and rack solutions in SA adjacent markets. It supports faster project timelines and broader rack market adoption in South Africa.


Research Methodology Framework and Report Scope
Market Definition and Coverage
This market covers the value of data center racks sold and installed in South Africa for use in commercial and enterprise data center facilities, including standard enclosures used to mount IT and network equipment and related rack configurations.
Scope exclusions: This sizing excludes servers, power and cooling equipment, building construction, and ongoing colocation service revenues that sit outside rack hardware demand.
Segmentation Overview
- By Rack Size
- Quarter Rack
- Half Rack
- Full Rack
- By Rack Height
- 42U
- 45U
- 48U
- Other Heights (52U and Custom)
- By Rack Type
- Cabinet (Closed) Racks
- Open-Frame Racks
- Wall-Mount Racks
- By Data Center Type
- Colocation Facilities
- Hyperscale and Cloud Service Provider DCs
- Enterprise and Edge
- By Material
- Steel
- Aluminum
- Other Alloys and Composites
Data Sources, Market Sizing, and Validation
Desk Research
Desk work was used to build the base demand picture for South Africa and to make sure inputs like data center expansion timing and infrastructure constraints were grounded in public signals. We referred to sources such as Statistics South Africa for macro and industry context, ICASA for telecom and connectivity indicators, and the South African Department of Communications and Digital Technologies for policy direction that influences local hosting.
To convert these signals into a usable sizing model, we also reviewed data center pipeline announcements from operator releases, customs and trade statistics where available for metal and fabricated products, and relevant standards and technical publications that describe rack form factors and installation practices. In addition, paid subscriptions for company financials and intelligence, news and financials, patents, and shipment-level import and export checks were used selectively to cross-check timing, pricing direction, and the plausibility of unit movements. The desk sources listed here are illustrative and not exhaustive, and many other public and paid references were used for data collection, validation, and clarification.
Primary Interviews and Surveys
Primary work focused on validating what is actually being ordered and installed in-country, since rack demand can shift quickly with new halls, density upgrades, and supply constraints. We spoke with a mix of rack suppliers, local integrators, colocation operators, and large enterprise buyers, and then aligned feedback on pricing ranges, lead times, and preferred rack specifications across the main data center hubs.
Responses were also used to confirm how demand differs by new builds versus retrofits, and to pressure-test assumptions on rack height mix (including higher-U configurations), cabinet type preferences (enclosed cabinets versus open frames), and the pace at which higher-density deployments are being adopted.
Distribution of primary research fieldwork respondents
| Company type | Respondent position |
|---|---|
| Top tier: 36% | CXOs: 15% |
| Mid tier: 44% | Functional/Unit leaders: 42% |
| Smaller Players: 20% | Managers: 43% |
Market-Sizing & Forecasting
Sizing started from a top-down demand pool that reconstructs installed and planned rack additions from the South Africa data center build pipeline, space and power expansion cues, and typical racks per white-space and density ranges discussed in interviews. Once the demand pool was set, average selling price bands were applied by rack category so value could be estimated in a repeatable way.
To keep totals realistic, we used selective bottom-up approximations as a cross-check, including supplier and channel checks on shipment direction, sampled quote ranges for common cabinet configurations, and sanity checks against the pace of new room fit-outs. Key inputs that moved the model included the number of planned racks in new halls, retrofit intensity in existing sites, mix shifts toward higher U heights, the split of enclosed cabinets versus open frames, and steel and aluminum cost direction that impacts rack pricing.
For forecasting, scenario analysis was used so the base case could reflect expected commissioning schedules, grid and permitting delays, and average lead time normalization that interviewees flagged. Where visibility was limited for smaller project sites, gaps were handled through conservative assumptions tied to known capacity announcements and then reviewed again during validation.
Data Validation & Update Cycle
Validation was done through multiple checks so one input could not overly drive the result. We compared the modeled totals with independent signals such as data center capacity expansion news, procurement timing shared in interviews, and observed pricing direction across common rack configurations, and then variances were reviewed before sign-off.
If an anomaly appeared, such as a sudden jump in implied rack density or an ASP that moved away from quote ranges, the assumptions were revisited and stakeholders were re-contacted to confirm what changed. Reports are refreshed annually, with interim updates when material events occur, and before delivery an analyst performs a fresh pass so clients receive the latest updated view.
Mordor Intelligence's South Africa Data Center Rack Market Size Measured Against Other Published Estimates
Published market sizes for South Africa data center racks can vary because the term is not consistently defined across studies, and because some publications mix unit counts and value or rely on pricing assumptions sourced outside South Africa. Differences also come from how projects under construction are mapped to a specific year, and whether retrofit demand is treated as a steady replacement cycle or modeled as a step change.
By tracking rack additions from announced and commissioned data center capacity and refreshing local ASP bands through channel checks, Mordor Intelligence keeps the estimate tied to racks that are actually procured for South Africa sites, instead of blending in adjacent data center infrastructure spend. Some external estimates also stretch the scope by bundling services or non-rack equipment, and a few use aggressive assumptions on density upgrades that do not match what buyers reported for typical halls.
Benchmark comparison
| Source | Market Size | Gaps in Research Methodology |
|---|---|---|
| Mordor Intelligence | USD 77.37 M (2025) | |
| Industry Bulletin A | USD 95.00 M (2025) | Uses a broader bundle that appears to include rack integration services and accessories as product value, which lifts ASP and inflates the same-year total. |
| Regional Consultancy B | USD 62.00 M (2024) | Anchors sizing to older project pipelines and applies slower commissioning assumptions, which delays new-hall rack additions into later years and lowers the near-term number. |
Taken together, the spread is mostly explained by what gets counted as rack value, and by timing assumptions around when new capacity becomes live. A model that separates rack hardware from nearby infrastructure items, and that aligns commissioning schedules with local reality, produces a cleaner number that can be rechecked using the same steps each year.


Key Questions Answered in the Report
What is the projected size of the South Africa data center rack market by 2031?
The South Africa data center rack market size is expected to reach USD 180.05 million by 2031, representing a 15.15% CAGR over the forecast period (2026-2031).
Which rack configuration leads current adoption?
Full racks dominate with 63.72% market share in 2025 due to hyperscale and colocation standardization requirements.
How does power instability affect rack design?
Frequent load-shedding has pushed operators to specify racks with integrated UPS shelves and renewable-ready busbars to maintain uptime during grid outages.
Which provinces generate the most demand for racks?
Gauteng and the Western Cape lead because of concentrated hyperscale campuses, submarine-cable landings, and deep enterprise footprints that require large volumes of standardized racks.
Page last updated on:
- Africa Data Center Rack Market
- Australia Data Center Rack Market
- Belgium Data Center Rack Market
- Canada Data Center Rack Market
- Chile Data Center Rack Market
- China Data Center Rack Market
- Denmark Data Center Rack Market
- France Data Center Rack Market
- Germany Data Center Rack Market
- Hong Kong Data Center Rack Market
- India Data Center Rack Market
- Artificial Intelligence (AI) Data Center Market Global AI facilities demand, split by facility type, component and tier.
- Data Center Construction Market Construction worldwide, split by tier, facility size and facility type.
- Data Center Server Market Servers across the global market, covering tier, facility size and facility type.





