
Solar Energy and Battery Storage Market Size and Share
Market Overview
| Study Period | 2022 - 2032 |
|---|---|
| Market Size (2027) | USD 22.11 Billion |
| Market Size (2032) | USD 48.34 Billion |
| Growth Rate (2027 - 2032) | 16.93 % |
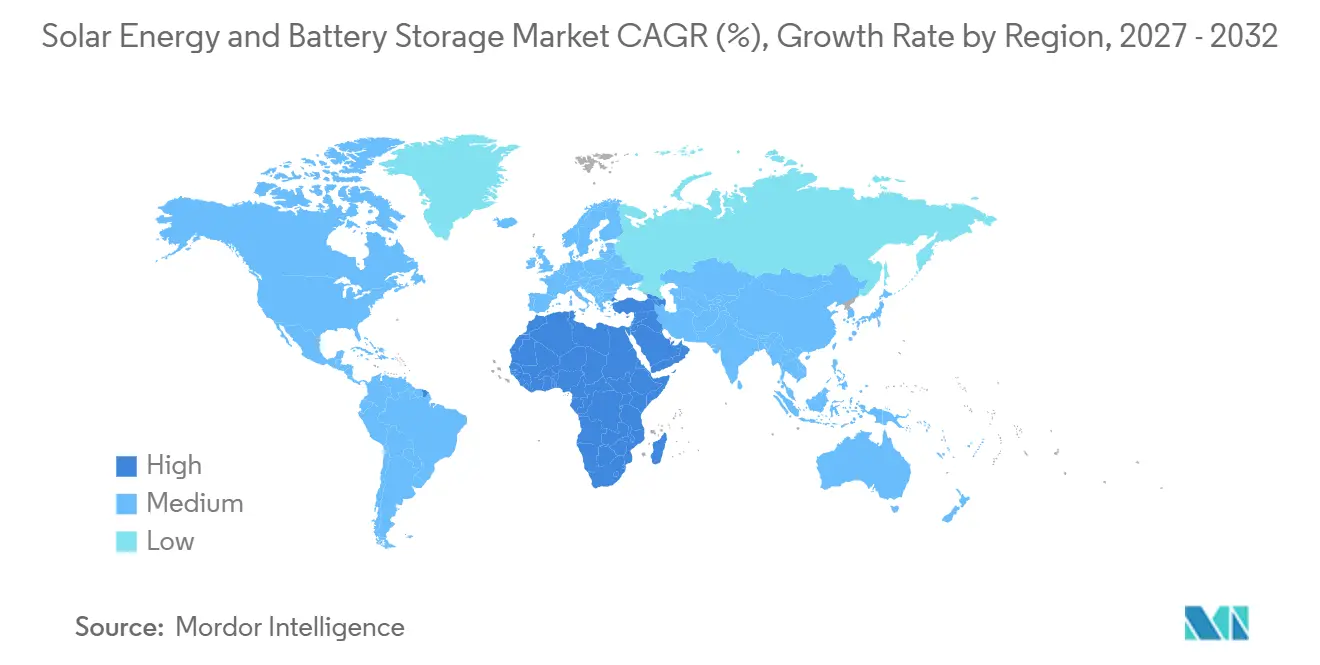
| Fastest Growing Market | Middle East and Africa |
| Largest Market | Asia-Pacific |
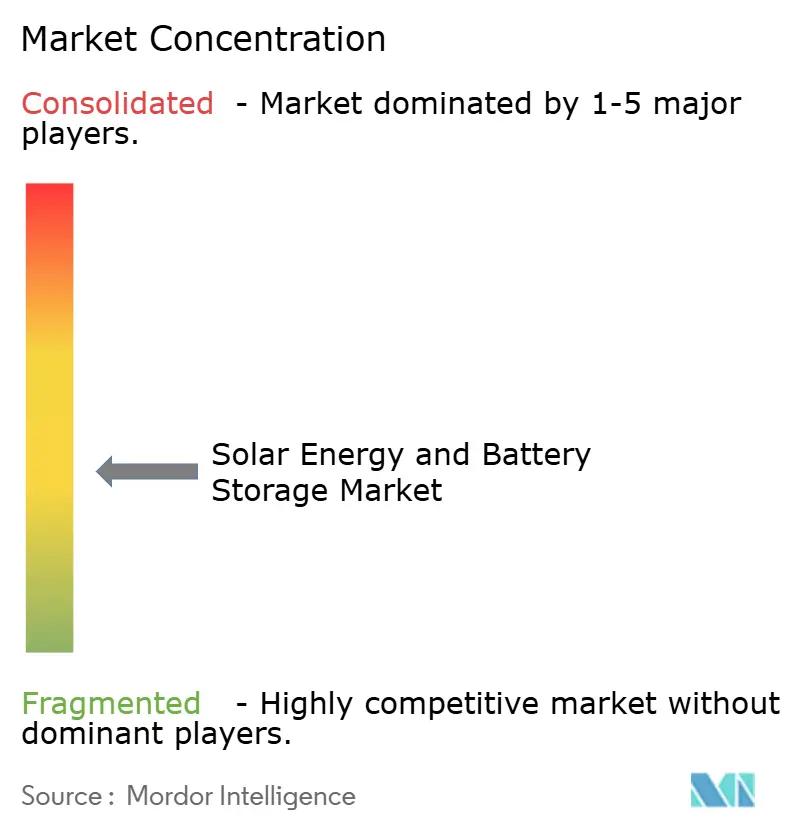
| Market Concentration | Medium |
Major Players *Disclaimer: Major Players sorted in no particular order Image © Mordor Intelligence. Reuse requires attribution under CC BY 4.0. | |
Solar Energy and Battery Storage Market Analysis by Mordor Intelligence
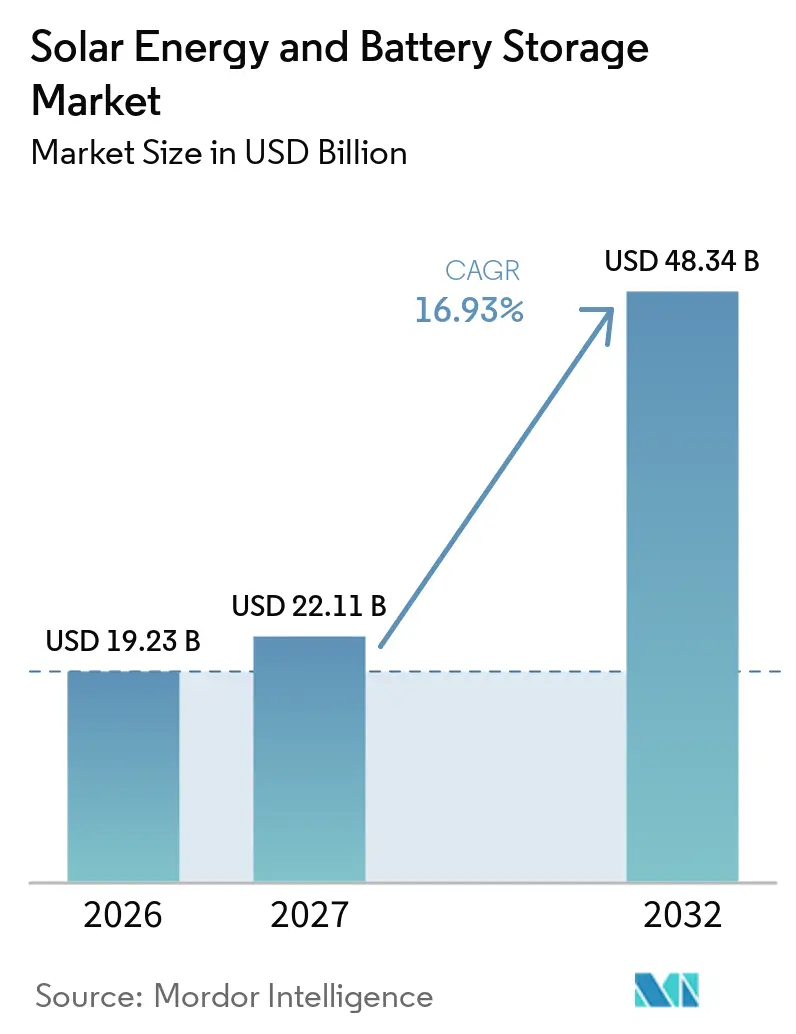
The Solar Energy And Battery Storage Market size is projected to be USD 19.23 billion in 2026, USD 22.11 billion in 2027, and reach USD 48.34 billion by 2032, growing at a CAGR of 16.93% from 2027 to 2032. The solar energy and battery storage market is moving from separate generation and storage purchases toward integrated assets that can deliver power after solar output declines, and this shift changes how developers select sites, negotiate offtake contracts, and plan grid connections. Utility procurements, grid congestion, and corporate demand for reliable clean power are making storage a core part of solar project design, because projects must increasingly serve evening demand rather than simply maximizing daytime generation. Lower battery costs support longer-duration configurations and improve the case for large systems, although interconnection delays, trade restrictions, domestic-content requirements, warranty diligence, and equipment lead times still slow deployment in important markets. The solar energy and battery storage market also faces growing pressure in high-solar grids, where midday oversupply can weaken merchant revenues and increase the value of co-located storage, while the same price pattern eventually creates revenue pressure for storage owners. Competition is becoming more focused on project delivery, compliant supply chains, operational guarantees, software controls, and system performance rather than cell manufacturing scale alone, which favors suppliers that can meet both lenders’ requirements and local policy conditions.
Key Report Takeaways
- By battery type, lithium-ion batteries hold 93.4% of the solar energy and battery storage market share in 2026, while flow batteries are forecast to expand at a 26.6% CAGR through 2032.
- By technology, solar PV accounts for 92.1% of the solar energy and battery storage market size in 2026, while no separate growth figure was provided for the fastest-growing technology.
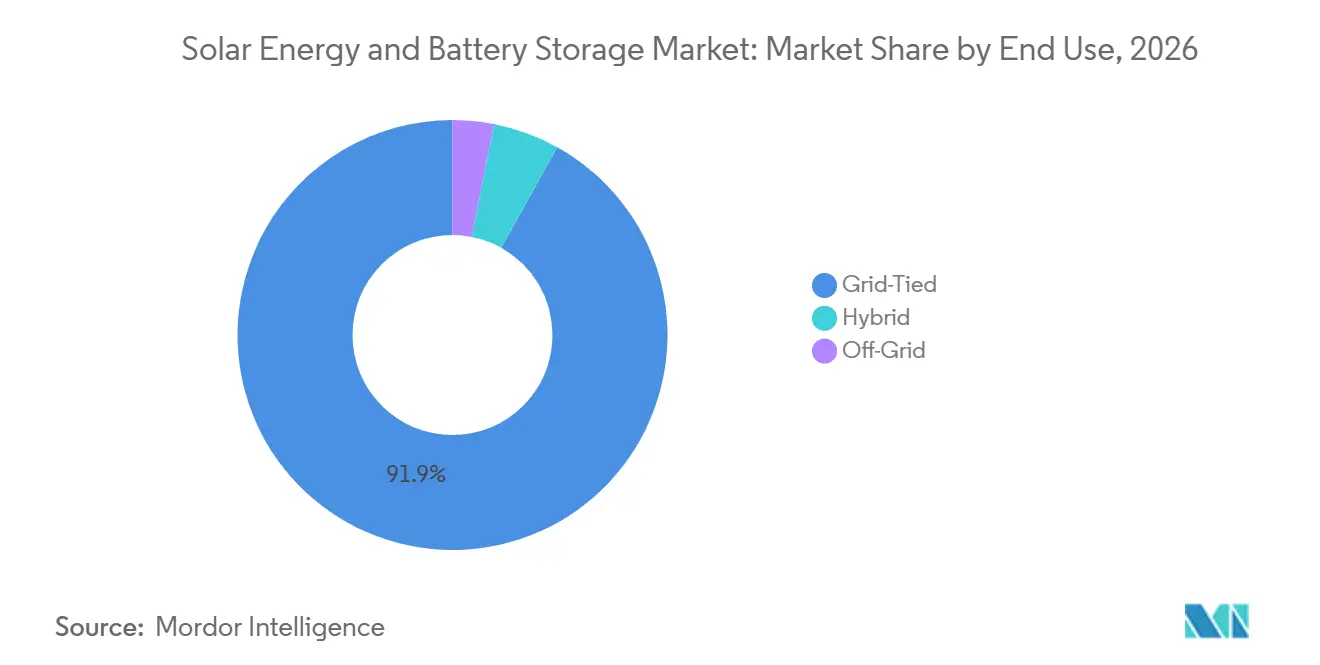
- By end use, grid-tied systems held a 91.9% share in 2026, while hybrid configurations recorded the highest projected CAGR at 19.2% through 2032.
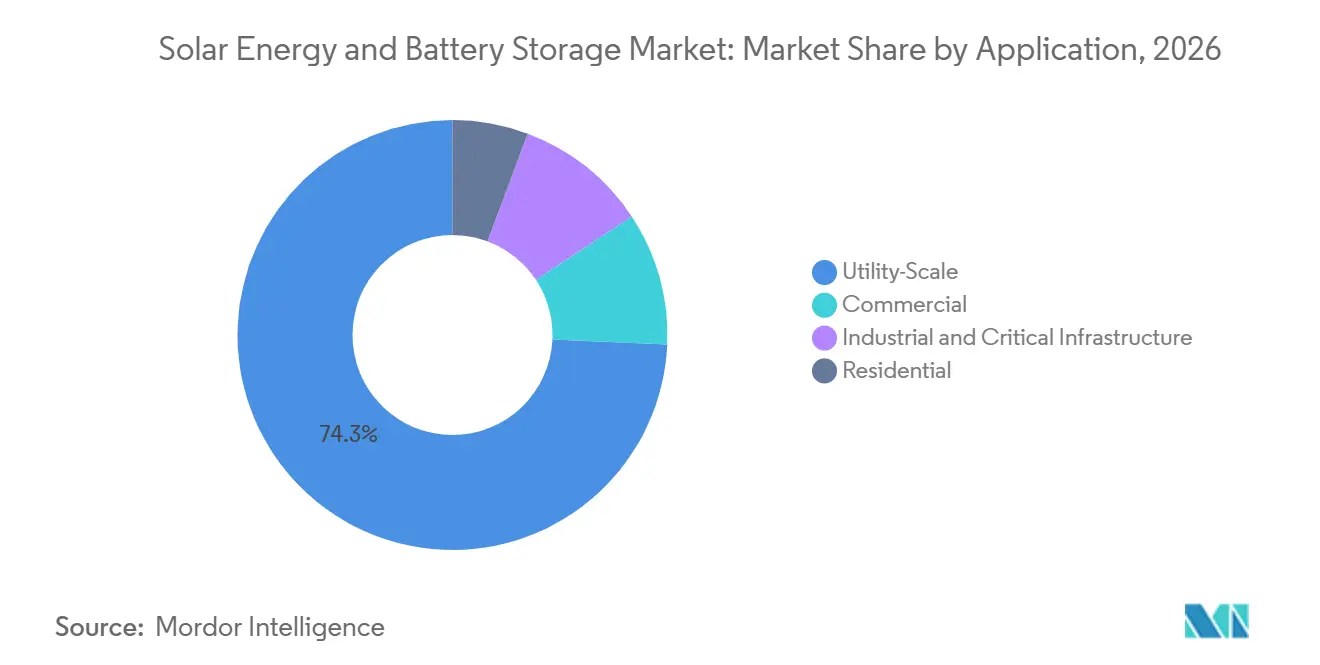
- By application, utility-scale systems accounted for a 74.3% share in 2026 and are advancing at an 18.6% CAGR through 2032.
- By geography, Asia-Pacific held a 58.7% share in 2026, while the Middle East and Africa are forecast to grow at a 17.8% CAGR through 2032.
Note: Market numbers in this report are based on Mordor Intelligence's proprietary estimation framework, which combines nine months of actuals with Q4 projections for base year 2026.
Global Solar Energy and Battery Storage Market Trends and Insights
Drivers Impact Analysis*
| Driver | (~) % Impact on CAGR Forecast | Geographic Relevance | Impact Timeline |
|---|---|---|---|
| Utility-Scale Solar and Storage Procurement | +3.5% | Global, concentrated in the United States, China, India, and Australia | Short term (≤ 2 years) |
| Falling Lithium-Ion System Costs | +3.2% | Global, particularly China, India, and emerging APAC markets | Short term (≤ 2 years) |
| Grid Congestion and Curtailment Avoidance | +1.8% | China, Germany, California, and Japan | Medium term (2-4 years) |
| Corporate Demand for Firm Clean Power | +1.5% | North America, Europe, and APAC hyperscaler markets | Medium term (2-4 years) |
| Resilience Spending for Critical Loads | +1.3% | Global, with emphasis on the United States, South and Southeast Asia | Medium term (2-4 years) |
| Dispatchable Solar Through Thermal and Battery Storage | +1.5% | China, the Middle East, the Southwest United States, and Australia | Long term (≥ 4 years) |
| Source: Mordor Intelligence | |||
Utility-Scale Solar and Storage Procurement
Public procurement is giving developers clearer revenue expectations and is supporting the solar energy and battery storage market. The Illinois Power Agency approved 600 MW of storage projects in September 2026 under a program that seeks 3 GW of cumulative storage capacity by 2030.[1] New South Wales opened a tender seeking 2.5 GW of generation and 12 GWh of storage, showing the increasing scale of long-duration requirements. Southern California Edison’s 2026 request for offers focused on resources that can meet evening ramp needs and replace gas peaking output. This approach moves solar-plus-storage from an optional design feature to a resource planning tool. NTPC Green Energy also sought a 100 MW solar photovoltaic (PV) and 50 MW/200 MWh Battery Energy Storage System (BESS) project in Uttar Pradesh in March 2026.[2]
Falling Lithium-Ion System Costs
Lower installed costs are expanding the range of solar projects that can include storage without losing financial viability. The input records global turnkey Battery Energy Storage System (BESS) costs of USD 117/kWh in 2025 and a China benchmark of USD 63/kWh, which strengthens China’s cost advantage. The International Renewable Energy Agency (IRENA) reports that battery energy storage can bridge mismatches between renewable supply and demand, particularly as variable generation expands.[3] Lower costs also make longer duration systems more practical for grid operators that need evening capacity rather than brief balancing services. In China, new connections of systems lasting 4 hours or more exceeded 2-hour systems for the first time in 2025, according to the supplied material. The solar energy and battery storage market therefore gains from lower component costs, but developers still need to manage financing, warranties, and local supply requirements.
Grid Congestion, Corporate Demand, and Resilience
Grid constraints are turning storage into a tool for protecting solar revenues and improving system reliability. China’s National Energy Administration reported 1,195 utilization hours for new-type storage in 2025, nearly 300 hours higher than in 2024. Japan had grid-scale battery connection applications of approximately 113 GW by March 2025, driven by storage subsidies and renewable firming needs. Corporate buyers increasingly need shaped clean power rather than renewable certificates alone, which supports hybrid procurement structures. The U.S. Department of Energy identifies battery-backed solar microgrids as essential building blocks for continuity at data centers and other critical loads.[4] These needs create opportunities for the solar energy and battery storage market across both utility assets and mission-critical facilities.
Dispatchable Solar Through Thermal and Battery Storage
Dispatchable renewable power is becoming more important in regions that need clean capacity during evening peak periods. Battery systems can move solar generation across several hours, while Concentrated Solar Power (CSP) uses thermal storage to provide longer delivery windows. China’s 2025-2027 storage action plan supports the expansion of new-type storage and grid-connected assets. The Golmud project combines a 350 MW CSP facility with 15-hour molten salt storage and a 1 GW photovoltaic (PV) park, demonstrating the scale that thermal storage can reach. CSP remains much smaller than PV, but it addresses a distinct need for scheduled clean output. This capability adds a longer-term pathway for the solar energy and battery storage market in regions with strong solar resources and firm-capacity demand.
Restraints Impact Analysis*
| Restraint | (~) % Impact on CAGR Forecast | Geographic Relevance | Impact Timeline |
|---|---|---|---|
| Interconnection Queue and Transmission Delays | -1.8% | United States, Europe, and India | Short term (≤ 2 years) |
| Trade Barriers and Local-Content Rules | -1.5% | United States, South Korea, and Japan | Short term (≤ 2 years) |
| Battery Degradation and Warranty Bankability | -1.1% | Global, with heightened sensitivity in emerging-market project finance | Medium term (2-4 years) |
| Revenue Cannibalization in Saturated Solar Hours | -1.0% | Germany, the United Kingdom, California, and Australia | Medium term (2-4 years) |
| Source: Mordor Intelligence | |||
Interconnection Queue and Transmission Delays
Interconnection remains a direct constraint on the solar energy and battery storage market because a completed project cannot operate until it reaches the grid. Lawrence Berkeley National Laboratory found that approximately 8,200 projects were seeking U.S. interconnection at the end of 2025, representing 1,312 GW of generation and 749 GW of storage. The median period from request to commercial operation exceeded 5 years for projects completed in 2025, compared with 22 months in 2008. Developers can also face equipment delays, permitting resistance, and financing pressure after securing an interconnection agreement. FERC Order 2023 has introduced cluster-study reforms, but its effects will take time to reach projects in existing queues. These delays favor developers with stronger balance sheets and a larger portfolio of sites.
Trade Barriers, Warranties, and Revenue Pressure
Trade rules and local-content requirements can raise the installed cost of systems that depend on Chinese cells or equipment. The supplied research states that combined U.S. tariffs on Chinese lithium-ion batteries and components reached an effective 60% from 2026. Fluence shipped its first U.S.-manufactured BESS in September 2025 using cells from AESC’s Tennessee facility, showing how suppliers are adapting to compliance needs. Battery degradation also remains important because lenders require credible warranties over system life and output. Solar-heavy systems can face lower prices during high-generation hours, which reduces returns for standalone projects in markets such as Germany. The solar energy and battery storage market benefits when co-located storage can shift energy away from those periods, but storage assets may face similar revenue pressure as their own deployment rises.
*Our forecasts treat driver/restraint impacts as directional, not additive. The impact forecasts reflect baseline growth, mix effects, and variable interactions.
Segment Analysis
By Battery Type: Lithium-Ion Retains Scale While Flow Batteries Expand
Lithium-ion batteries held 93.4% of the battery-type segment in 2026. This position reflects manufacturing scale, established supply chains, and utility familiarity with technology. The segment anchors the solar energy and battery storage market size because large projects generally use lithium-ion systems for their current cost and performance profile. LFP accounted for approximately 90% of global BESS deployments in the input, supported by cycle life, cost, and lower thermal runaway risk. Lead-acid products remain relevant in off-grid and backup applications where initial capital cost carries more weight. Nickel-cadmium continues to serve limited high-temperature and aviation-adjacent uses.
Flow batteries are forecast to grow at 26.6% CAGR through 2032. The 200 MW/1,000 MWh Jimusar vanadium redox flow battery project entered operation in January 2026 alongside a 1 GW solar plant, providing a large commercial reference case. Sumitomo Electric’s redox flow battery was selected for Japan’s Nagasu Energy Storage Facility under a Ministry of Economy, Trade and Industry (METI) subsidy program in March 2025. NTPC Renewable Energy also issued a tender for a 16.7 MW/100 MWh vanadium flow battery at Khavda Solar Park in March 2026. These projects show that flow batteries are moving into applications requiring deeper and repeated cycling. Their expansion is tied to long-duration needs, even though lithium-ion remains the dominant choice for near-term volume.
By Technology: Solar PV Leads While CSP Serves Firm-Power Needs
Solar PV captured 92.1% of the technology segment in 2026. Its scale comes from modular deployment, broad availability, and continued gains in module performance. The solar energy and battery storage market share of PV is reinforced by JinkoSolar’s Tiger Neo 5.0 series, which reached 25.91% mass-produced efficiency with output above 700 W per module in June 2026. Sungrow also introduced an AI-integrated smart module in 2026, adding software capabilities to hardware competition. These developments support lower delivered power costs and better energy management. PV therefore remains the main generation technology paired with battery systems.
CSP and solar thermal hold the remaining technology share but provide a distinct operating profile. Thermal storage allows CSP systems to deliver power beyond daylight hours and respond to peak demand. China had 1.14 GW of CSP capacity by mid-2025 and a pipeline exceeding 8 GW, according to a 2025 American Society of Mechanical Engineers (ASME) review. The Golmud project’s 11,747 MWh molten salt system demonstrates the large storage capacities available from this approach. CSP is not positioned to replace PV in volume, but it can complement battery systems where long duration dispatchability matters. That role gives it strategic relevance in selected solar-rich grids.
By End Use: Grid-Tied Systems Lead While Hybrids Gain Momentum
Grid-tied systems held 91.9% of the end-use segment in 2026. Utility-connected projects dominate current addictions because they can access procurement programs and long-term contracts. China’s new-type storage action plan targets more than 180 GW by 2027, supporting grid-connected capacity expansion. Independent grid-tied storage represented 51.2% of cumulative capacity in China during 2025, according to the source material. The solar energy and battery storage market is therefore closely tied to transmission planning and wholesale market design. Grid-tied systems also provide a common route for utility-scale solar assets to deliver ancillary services.
Hybrid configurations are forecast to expand at a 19.2% CAGR through 2032. Developers use them to reduce curtailment exposure, shape output, and serve corporate buyers seeking more reliable clean electricity. A 2025 IEEE Access study described a hybrid PV-Battery Energy Storage System (BESS) installation at a Brazilian 500 kV substation that supported seamless islanded operation. Off-grid systems remain smaller but support microgrids in Southeast Asia, sub-Saharan Africa, remote mines, and similar locations. Such projects can replace diesel generation where fuel logistics and supply reliability create high operating costs. The hybrid category benefits as users value both lower fuel dependence and better power continuity.
By Application: Utility-Scale Systems Retain the Largest Role
Utility-scale systems accounted for 74.3% of the application segment in 2026 and recorded an 18.6% CAGR through 2032. This segment commands the largest solar energy and battery storage market size because larger projects benefit from lower financing costs and long contract terms. Masdar’s round-the-clock project in Abu Dhabi secured 18.775 GWh of BESS supply from BYD and Sungrow during 2026, illustrating the scale of current procurements. China’s storage tenders exceeded 210 GWh in the first 8 months of 2025, according to the draft. These projects are increasingly designed to replace firm conventional output rather than only provide incremental renewable capacity. The segment remains the central route for near-term revenue expansion.
Residential and commercial systems are growing at more moderate rates. Germany installed approximately 600,000 new residential storage systems in 2025, and roughly 80% of new residential photovoltaic (PV) installations included storage, according to BSW-Solar. Industrial and critical infrastructure projects are gaining importance as data centers and public services prioritize resilience. Energy Vault and PG&E completed the Calistoga Resiliency Center in 2025, a hybrid battery and hydrogen microgrid. These uses have different economics from utility projects, but they increase the addressable range of solar and storage deployments. Reliability requirements also create demand for more durable and serviceable systems.
Geography Analysis
Asia-Pacific accounted for 58.7% of the global solar energy and battery storage market share in 2026. China’s production base and project pipeline provide the region’s main scale advantage, since local manufacturing, large tenders, and policy support link component supply with domestic deployments. China reached 130 GW/351 GWh of new-type storage capacity by the end of 2025, and annual additions reached 65.77 GW/190 GWh. This capacity growth shows that storage is being used for both renewable integration and grid operations, rather than only as a supplementary solar asset. India’s viability gap funding program can support additional solar and storage capacity through 2027, based on the supplied material. Lower expected BESS costs also support India’s project economics and strengthen the case for utility procurement. Japan’s 7th Energy Basic Plan targets a 40-50% renewable share by 2040, with solar expected to contribute 23-29%. Japan’s large pipeline of grid-scale storage connection applications indicates that developers expect storage to become necessary as renewable penetration rises. Australia adds procurement maturity through its large long-duration storage tenders, creating an additional reference market for multi-hour systems.
Europe and North America have mature renewable fleets but still offer substantial storage demand. Germany generated more than 19% of domestic electricity from solar in 2025, and large-scale storage registrations rose more than 161% year over year in the first half of 2026. This reflects the need to manage solar oversupply and improve revenue capture at hours when wholesale prices are weaker. Germany’s storage industry also recovered revenue in 2025, illustrating how demand extends beyond home systems toward larger assets. In the United States, utility-scale BESS capacity grew from 2.4 GW in 2020 to 27 GW by 2024 according to the input. Interconnection delays, domestic-content rules, and Foreign Entity of Concern (FEOC) thresholds now strongly affect project economics, often altering equipment choice before projects reach final investment decisions. These conditions support local manufacturing efforts but may add short-term cost and scheduling risk. Canada and Mexico offer smaller but growing opportunities where reliability needs and cross-border clean energy commitments support storage-backed solar.
The Middle East and Africa is the fastest-growing geography, with a projected 17.8% CAGR through 2032. Egypt received USD 479.1 million in financing for Scatec’s 1.1 GW solar and 200 MWh BESS project at Nagaa Hammadi. International Finance Corporation (IFC) also approved up to USD 363 million for the Abydos Solar II project, which combines 1,000 MW of solar with 600 MWh of battery storage. These projects demonstrate the importance of development-finance participation in early large-scale deployments, particularly where long-tenor capital is needed. Clean energy investment in Africa nearly doubled from USD 17 billion in 2019 to almost USD 40 billion in 2024. Saudi Arabia’s projects are creating a major demand center for grid-scale storage and are increasing the commercial relevance of suppliers able to execute at multi-gigawatt scale. South America is expanding at a steadier pace, with Brazil, Chile, and Argentina using solar-plus-storage to support grid reliability in hydropower-constrained systems.
Competitive Landscape
The solar energy and battery storage market moderately concentrated solar module manufacturing with a more diverse group of BESS integrators. Sungrow, Tesla, CATL, and BYD are important suppliers across battery integration and related equipment. The supplied research reports that BYD held 13% of BESS system share in 2025, compared with Tesla at 10%. It also reports that the combined share of vertically integrated lithium-ion Original Equipment Manufacturers (OEMs) declined from more than 40% in 2023 to under 30% in the first half of 2025. This shift favors companies that can deliver complete projects, provide warranties, secure financing support, and satisfy local-content rules. It also leaves room for specialized providers in long-duration storage and hybrid system design. The result is a market in which a strong cell supply position does not automatically translate into leadership in delivered projects.
Leading companies are differentiating through technology and manufacturing location. JinkoSolar introduced its Tiger Neo 5.0 modules in June 2026, combining output above 700 W with 25.91% mass-produced efficiency. This type of module improvement can reduce land, balance-of-system, and labor requirements for a given project output. SolarEdge reported 46% year-over-year revenue growth in the first quarter of 2026 and expanded its Nexis integrated residential solar-and-storage platform in the United States after its German launch. Fluence shipped its first U.S.-manufactured BESS in September 2025 using Automotive Energy Supply Corporation (AESC) cells from Tennessee. This move addressed compliance risk and provided a domestic option for U.S. utility projects. BYD and Sungrow also secured large supply awards for Masdar’s Abu Dhabi project, demonstrating their execution capacity in major tenders.
Smaller specialized manufacturers are seeking positions where standard products offer less flexibility. HyperStrong and Envision are targeting long-duration and hybrid configurations that require project-specific design and stronger integration capabilities. Canadian Solar is advancing a 6 GWh Lithium Iron Phosphate (LFP) battery cell plant in Kentucky, supporting a more localized supply chain in the United States. Local production can help suppliers respond to trade rules and tax-credit requirements, though it does not eliminate the need for cost control and qualified component sourcing. The solar energy and battery storage industry is therefore competing on equipment performance, financing confidence, software controls, compliance readiness, and the ability to support assets after commissioning. Buyers are likely to compare delivery reliability and lifecycle service more closely as projects grow in size and contractual penalties rise.
Solar Energy and Battery Storage Industry Leaders
-
Tesla, Inc.
-
Sungrow Power Supply Co., Ltd.
-
BYD Company Limited
-
Huawei Technologies Co., Ltd.
-
CRRC Zhuzhou Institute Co., Ltd.
- *Disclaimer: Major Players sorted in no particular order
Recent Industry Developments
- September 2026: JinkoSolar announced a proposed company name change to Jinko Holdings Limited and provided a strategic investment update, signalling a planned repositioning beyond pure-play solar module manufacturing toward an integrated solar-plus-storage portfolio; the company expects annual integrated production capacity to reach approximately 100 GW by end-2026.
- June 2026: China General Nuclear's 350 MW Golmud CSP Demonstration Project broke ground in Qinghai Province, featuring a 15-hour molten salt thermal storage system with 11,747 MWh capacity the world's largest single-unit thermal storage for a CSP plant co-located with a 1 GW PV park, targeting 1 billion kWh of annual generation and reducing CO₂ emissions by 860,000 tons per year.
- May 2026: SolarEdge reported 46% year-on-year revenue growth for Q1 2026 and confirmed the US market rollout of its Nexis integrated residential solar-and-storage platform, following the March 2026 launch in Germany, where the system had already been deployed in more than 2,000 installations.
- February 2026: NTPC Renewable Energy (NTPC REL) issued a tender for a 16.7 MW/100 MWh vanadium redox flow battery at Khavda Solar Park in Gujarat, India's largest renewable energy park, representing a significant step toward commercial-scale non-lithium storage procurement in the Indian utility market.
Global Solar Energy and Battery Storage Market Report Scope
Solar energy and battery storage define an integrated system that captures solar radiation to generate electricity and pairs it with an electrochemical or mechanical energy storage device to store excess power for later deployment.
The global solar energy and battery storage market is segmented by battery type, technology, end use, application, and geography. By battery type, the market is segmented into lithium-ion, lead-acid, flow batteries, nickel-cadmium, and other battery types. By technology, the market is segmented into solar photovoltaic (PV), concentrated solar power (CSP), and solar thermal. By end use, the market is segmented into grid-tied, off-grid, and hybrid systems. By application, the market is segmented into residential, commercial, utility-scale, and industrial and critical infrastructure applications. The report also covers the market size and forecasts for the global solar energy and battery storage market across 26 countries in key regions. For each segment, the market sizing and forecasts have been provided on the basis of value (USD).
| Lithium-Ion |
| Lead-Acid |
| Flow Battery |
| Nickel-Cadmium |
| Others |
| Solar Photovoltaic |
| Concentrated Solar Power |
| Solar Thermal |
| Grid-Tied |
| Off-Grid |
| Hybrid |
| Residential |
| Commercial |
| Utility-Scale |
| Industrial and Critical Infrastructure |
| North America | United States |
| Canada | |
| Mexico | |
| Europe | Germany |
| France | |
| Italy | |
| Spain | |
| United Kingdom | |
| Poland | |
| Russia | |
| Rest of Europe | |
| Asia-Pacific | China |
| India | |
| Japan | |
| South Korea | |
| Australia | |
| Indonesia | |
| Vietnam | |
| Thailand | |
| Rest of Asia-Pacific | |
| South America | Brazil |
| Argentina | |
| Chile | |
| Rest of South America | |
| Middle East and Africa | Saudi Arabia |
| United Arab Emirates | |
| Egypt | |
| South Africa | |
| Morocco | |
| Rest of Middle East and Africa |
| By Battery Type | Lithium-Ion | |
| Lead-Acid | ||
| Flow Battery | ||
| Nickel-Cadmium | ||
| Others | ||
| By Technology | Solar Photovoltaic | |
| Concentrated Solar Power | ||
| Solar Thermal | ||
| By End Use | Grid-Tied | |
| Off-Grid | ||
| Hybrid | ||
| By Application | Residential | |
| Commercial | ||
| Utility-Scale | ||
| Industrial and Critical Infrastructure | ||
| By Geography | North America | United States |
| Canada | ||
| Mexico | ||
| Europe | Germany | |
| France | ||
| Italy | ||
| Spain | ||
| United Kingdom | ||
| Poland | ||
| Russia | ||
| Rest of Europe | ||
| Asia-Pacific | China | |
| India | ||
| Japan | ||
| South Korea | ||
| Australia | ||
| Indonesia | ||
| Vietnam | ||
| Thailand | ||
| Rest of Asia-Pacific | ||
| South America | Brazil | |
| Argentina | ||
| Chile | ||
| Rest of South America | ||
| Middle East and Africa | Saudi Arabia | |
| United Arab Emirates | ||
| Egypt | ||
| South Africa | ||
| Morocco | ||
| Rest of Middle East and Africa | ||
Key Questions Answered in the Report
What is the value of the global solar energy and battery storage market in 2026?
The sector is valued at USD 19.23 billion in 2026 and is projected to reach USD 48.34 billion by 2032 at a 16.93% CAGR.
Which battery technology leads solar-plus-storage deployments?
Lithium-ion batteries lead the battery-type segment with 93.4% share in 2026, while flow batteries have the highest forecast CAGR at 26.6%.
Why are utility-scale solar-plus-storage projects growing?
Utility-scale systems held 74.3% share in 2026 and are supported by large procurements, lower financing costs, and long-term contracts.
Which region is the largest for solar and battery storage?
Asia-Pacific held 58.7% of global share in 2026, led by China's manufacturing scale and large deployment pipeline.
Which region is growing fastest for solar-plus-storage?
The Middle East and Africa are forecast to expand at a 17.8% CAGR through 2032, supported by major projects in Egypt and Saudi Arabia.
What are the main barriers to solar-plus-storage deployment?
Grid interconnection delays, trade restrictions, warranty requirements, and price cannibalization during high-solar hours remain major barriers.