
Social OTT Market Size and Share
Market Overview
| Study Period | 2020 - 2031 |
|---|---|
| Market Size (2026) | USD 19.98 Billion |
| Market Size (2031) | USD 34.69 Billion |
| Growth Rate (2026 - 2031) | 11.67 % |
| Fastest Growing Market | Asia-Pacific |
| Largest Market | North America |
| Market Concentration | Medium |
Major Players *Disclaimer: Major Players sorted in no particular order Image © Mordor Intelligence. Reuse requires attribution under CC BY 4.0. | |
Social OTT Market Analysis by Mordor Intelligence
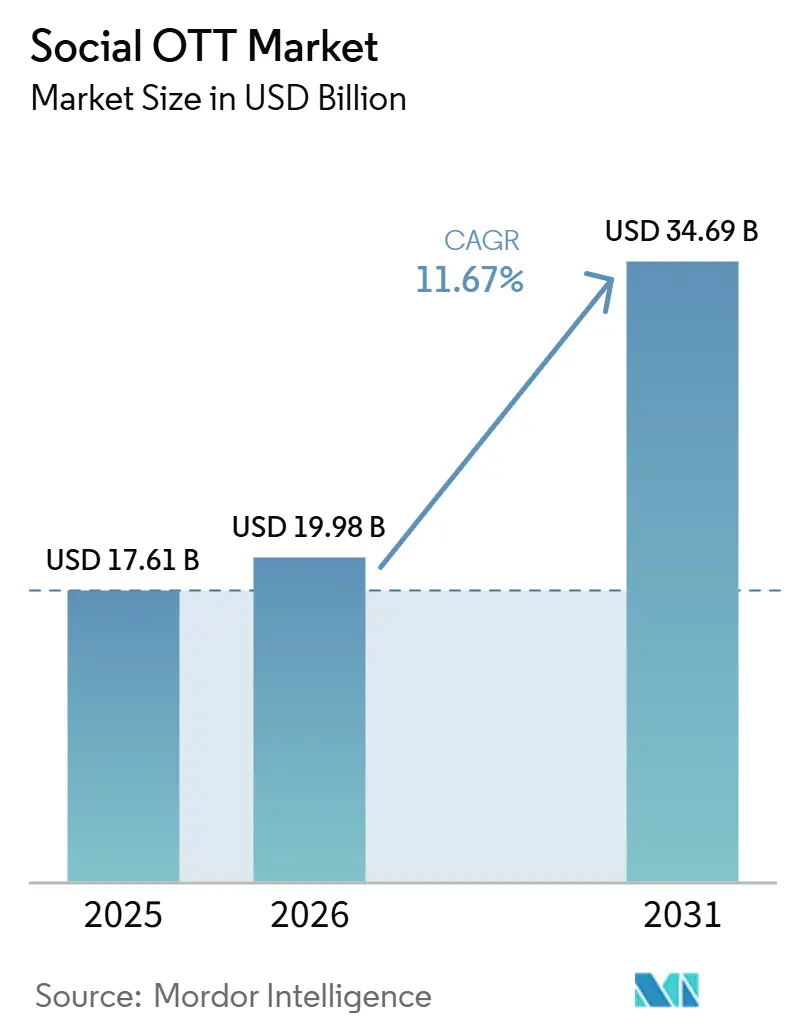
The social OTT market size was valued at USD 17.61 billion in 2025 and estimated to grow from USD 19.98 billion in 2026 to reach USD 34.69 billion by 2031, at a CAGR of 11.67% during the forecast period 2026-2031. The social OTT market is expanding because content discovery is moving toward short video feeds, while creators, viewers, and advertisers increasingly operate inside the same platform environment. The social OTT market also benefits from the growing importance of live participation, where chat, co-viewing, and instant interaction keep users engaged for longer periods and improve monetization quality. Another major shift in the social OTT market is the move toward platform-native advertising, creator payments, and commerce tools, which gives platforms more ways to earn revenue beyond subscriptions alone. Growth in the social OTT market is strong, but the pace still depends on how well platforms manage regulation, subscription fatigue, ad load tolerance, and the rising cost of AI infrastructure.
Key Report Takeaways
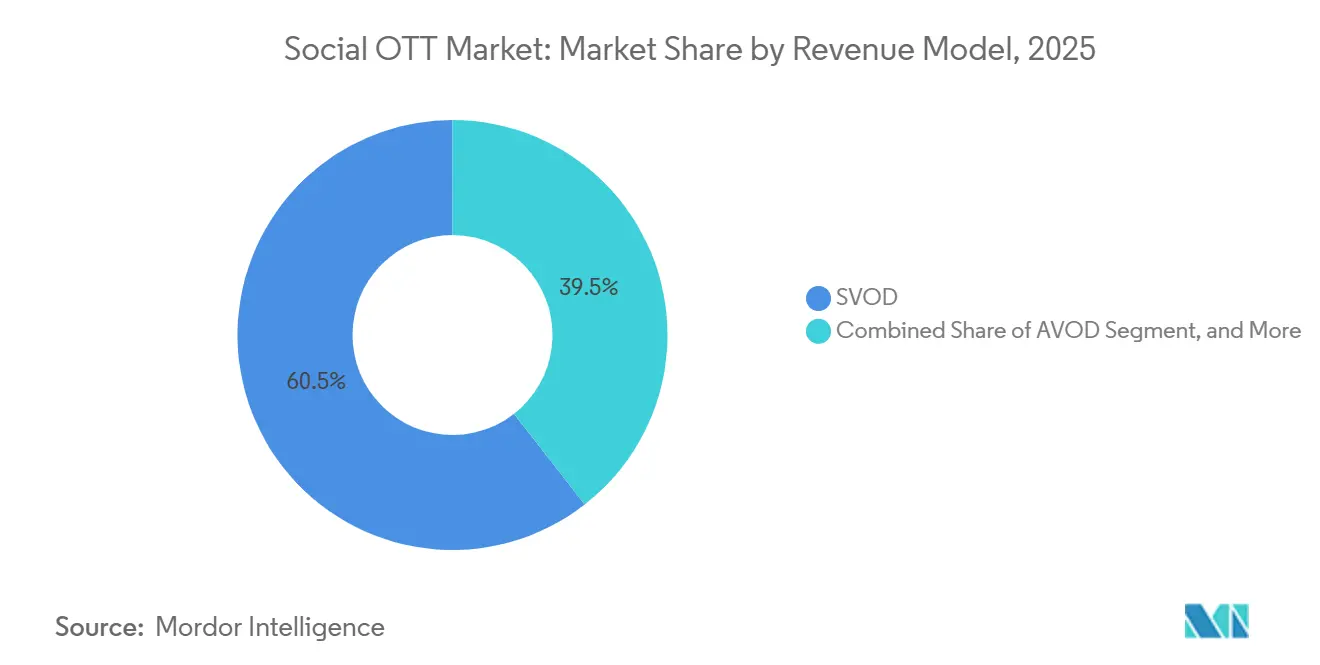
- By revenue model, subscription-based SVOD held 60.54% of the social OTT market share in 2025, while advertising-supported AVOD is projected to expand at an 11.82% CAGR through 2031.
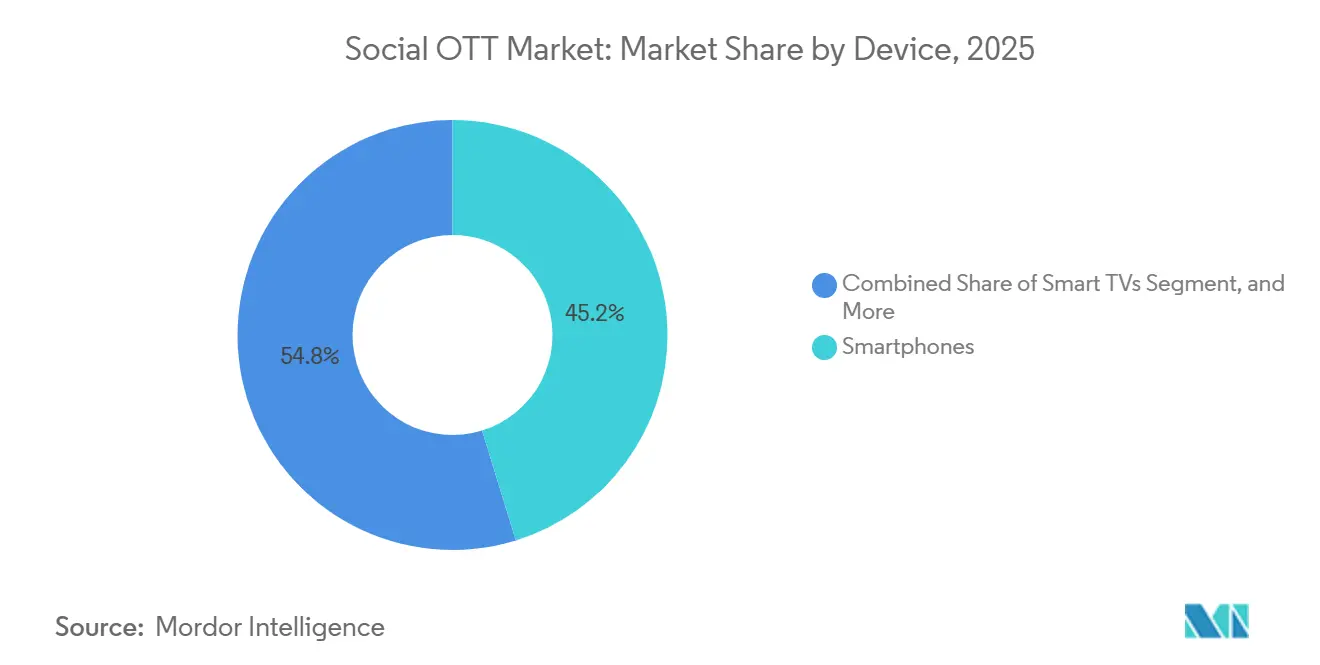
- By device, smartphones accounted for 45.23% of the revenue of the social OTT market in 2025, while smart TVs are expected to record the highest CAGR of 12.13% during 2026-2031.
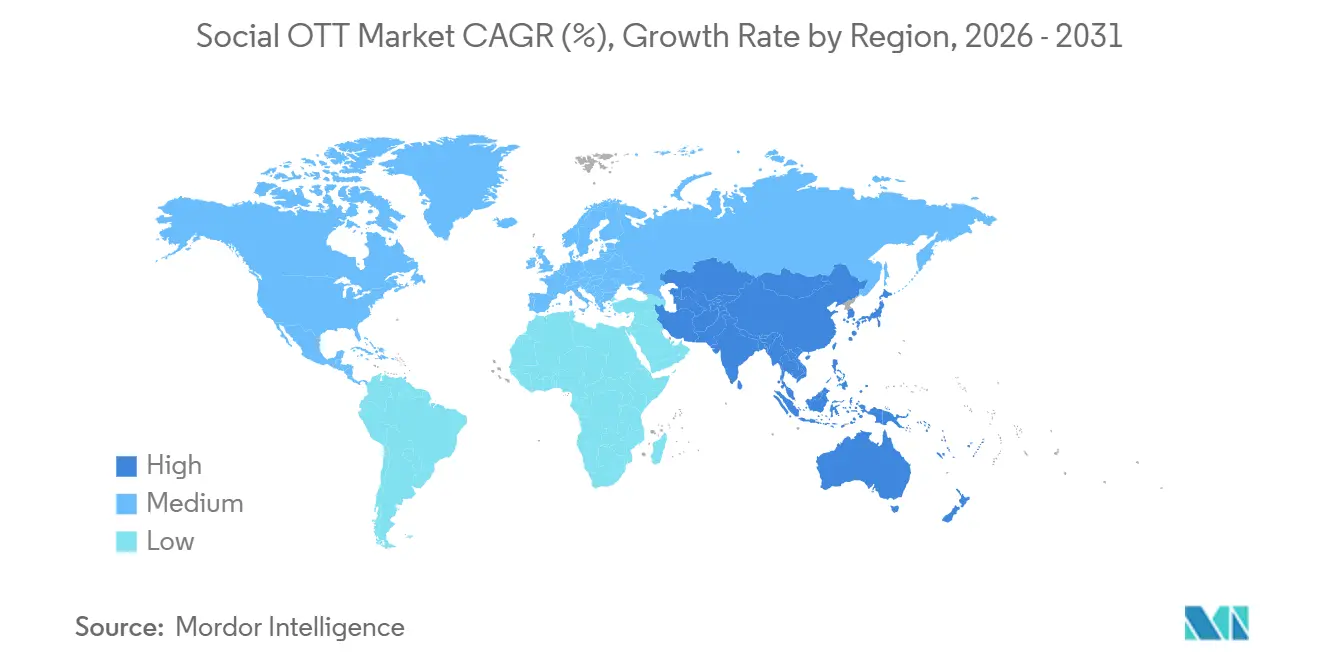
- By geography, North America held 40.66% of the social OTT market size in 2025, while Asia-Pacific is forecast to advance at a 12.14% CAGR through 2031.
Note: Market size and forecast figures in this report are generated using Mordor Intelligence’s proprietary estimation framework, updated with the latest available data and insights as of January 2026.
Market Trends and Insights
Drivers Impact Analysis of Social OTT Market*
| Driver | (~) % Impact on CAGR Forecast | Geographic Relevance | Impact Timeline |
|---|---|---|---|
| Short-Form Video Discovery and Social Sharing Dominance | +2.8% | Global, highest concentration in North America and Asia-Pacific | Short term (≤ 2 years) |
| Live Event Co-Viewing and Real-Time Chat Engagement | +2.1% | Global, especially South Asia, East Asia, and North America | Medium term (2-4 years) |
| Creator-Led Monetization and Platform-Native Commerce | +1.7% | North America and Asia-Pacific core, spillover to South America and Europe, Middle East, and Africa | Medium term (2-4 years) |
| AI-Based Personalization and Auto-Clipping for Social Distribution | +1.5% | Global, AI infrastructure concentrated in North America and China | Long term (≥ 4 years) |
| Privacy-Safe First-Party Audience Graphs for Logged-In Viewing | +1% | North America and Europe, early adoption in Asia-Pacific | Medium term (2-4 years) |
| Bundled CTV, Telco, and Super-App Distribution | +0.8% | Europe, South Asia, East Asia, emerging in Middle East | Long term (≥ 4 years) |
| Source: Mordor Intelligence | |||
Short-Form Video Discovery and Social Sharing Dominance
Short-form feeds now sit at the center of the social OTT market because they shape how viewers discover longer content and return to platforms throughout the day. YouTube Shorts averaged 200 billion daily views in 2026, up from 70 billion in March 2024, which shows how quickly short video has become a primary viewing surface rather than a supporting format.[1]Alphabet Inc., “YouTube CEO 2026 Annual Letter,” Alphabet Investor Relations, abc.xyz Meta also showed the scale of this shift when Instagram Reels crossed a USD 50 billion annual revenue run rate by Q3 2025, which confirmed that advertiser demand was following attention into social video environments. META Netflix responded in July 2026 by signing short-form licensing agreements with BuzzFeed Studios, Condé Nast, Hearst Magazines, and Penske Media, with launches scheduled across 6 markets in August 2026. In the social OTT market, platforms that can move users from short clips into longer viewing sessions hold a stronger conversion position than services that still treat discovery and streaming as separate experiences.
Live Event Co-Viewing and Real-Time Chat Engagement
Live programming is gaining strategic weight in the social OTT market because its value depends on real-time participation and weakens once the moment passes. JioHotstar recorded 72.5 million concurrent viewers during the T20 World Cup, and IPL 2026 reached more than 700 million viewers on the platform, which shows the scale of social viewing when major events are widely accessible. This scale matters because live sports, entertainment, and event streams keep audiences inside one platform at the same time, which improves chat activity, reactions, and time spent. The social OTT market is also moving toward features such as synchronized discussion, gifting, and watch-party tools because they create user habits that library-based viewing alone cannot match. Platforms that do not invest in this kind of live infrastructure risk losing premium engagement windows to services that can turn a stream into a shared event.
Creator-Led Monetization and Platform-Native Commerce
The social OTT market is becoming more creator-led as platforms integrate content, advertising, and transactions within the same viewing flow. JioStar is expected to identify commerce as a key revenue stream after advertising and subscriptions, citing examples such as a Swiggy ordering overlay during sports broadcasts and a Samsung Galaxy S26 exclusive linked to a drama premiere. Meta is expected to increase creator payouts significantly from the previous year and launch the Creator Fast Track program to attract established creators through guaranteed monthly payments. These initiatives indicate that the social OTT market is shifting part of its content production burden to creators while keeping audience development and monetization within the platform. This model allows creator output to support user retention, brand spending, and commerce activity simultaneously.
AI-Based Personalization and Auto-Clipping for Social Distribution
AI is becoming a core operating layer in the social OTT market, as it increasingly influences discovery, ad delivery, production workflows, and content packaging. Netflix stated that it aimed to significantly grow ad revenue through improved AI-driven ad formats. The company also launched a conversational search feature and a vertical video feed to strengthen recommendation-led discovery. JioStar also launched JAMS in 2026 to support premium content production across multiple Indian languages, which changes the cost structure for regional content creation and distribution. The IAB stated in its State of Data 2026 report that AI-enabled marketing mix modeling could unlock major media value that current measurement systems do not fully capture.[2]Interactive Advertising Bureau, “Standardized Measurement Guide for CTV,” IAB, iab.com In the social OTT market, this means platforms with stronger AI stacks should improve both monetization depth and multilingual content reach over the forecast period.
Restraints Impact Analysis of Social OTT Market*
| Restraint | (~) % Impact on CAGR Forecast | Geographic Relevance | Impact Timeline |
|---|---|---|---|
| Fragmented Rights Management Across Platforms and Regions | -1.1% | Global, most acute in North America and Europe | Medium term (2-4 years) |
| Weak Cross-Platform Measurement and Attribution Standards | -0.9% | Global, particularly North America, Europe, and Asia-Pacific | Medium term (2-4 years) |
| Rising Compliance Burden on Child Safety, Data Use, and Synthetic Media | -0.7% | North America and Europe, expanding to Asia-Pacific | Short term (≤ 2 years) |
| Monetization Pressure from Subscription Fatigue and Ad Load Saturation | -0.6% | North America and Europe, emerging in Asia-Pacific | Short term (≤ 2 years) |
| Source: Mordor Intelligence | |||
Fragmented Rights Management Across Platforms and Regions
Fragmented rights management remains a drag on the social OTT market because content now moves across streaming apps, social feeds, short-video loops, and connected TV environments with different usage terms. A title may create audience value across several viewing surfaces, but every additional surface can add approval steps, territorial limits, and new monitoring needs. This weakens execution speed in the social OTT market, especially when platforms try to balance visibility, exclusivity, and monetization at the same time. The issue becomes more difficult when distribution rules change after launch, because updates to rights status do not always flow immediately across every delivery and marketing channel. As a result, the social OTT market faces higher governance costs and slower scaling when cross-platform content plans are not tightly coordinated.
Weak Cross-Platform Measurement and Attribution Standards
Weak measurement standards limit the social OTT market because advertisers still struggle to compare reach, frequency, and outcomes across platforms in a consistent way. The IAB said in December 2025 that fragmented standards and uneven signal quality continued to undermine accurate connected TV measurement even as spending kept rising. IAB Australia also reported in 2026 that buyers faced inconsistent definitions of reach, frequency, and viewability across platforms, which reduced comparability and made optimization harder.[3]Interactive Advertising Bureau Australia, “Video State of the Nation Report 2026,” IAB Australia, iabaustralia.com.au The social OTT market, therefore, risks undervaluing inventory that supports discovery and conversion if attribution systems cannot connect social engagement with later subscription or commerce outcomes. IAB efforts such as Project Eidos, the Redefining Media Types Standard, and the Events and Conversion API v1 are important because they can improve data consistency and release budgets that remain held back by measurement friction.
*Our forecasts treat driver/restraint impacts as directional, not additive. The impact forecasts reflect baseline growth, mix effects, and variable interactions.
Social OTT Market Segment Analysis
By Revenue Model:
SVOD Holds the Lead While AVOD Expands FasterSubscription-based SVOD held 60.54% of revenue in 2025, which kept it as the largest revenue model in the social OTT market. This position reflects steady demand for premium, ad-free viewing among users who value convenience, lower interruption, and access to established libraries. Even so, the social OTT market is moving toward a broader monetization mix because consumers are showing stronger acceptance of lower-cost viewing options that include advertising. AVOD is forecast to expand at an 11.82% CAGR from 2026 to 2031, which makes it the fastest-growing revenue model in this market. In this segment, the social OTT industry is becoming less dependent on a single payment model and more dependent on how well each platform balances price, attention, and advertiser value.
The social OTT market size for AVOD is gaining strategic importance because ad-backed viewing widens access and supports scale in price-sensitive user groups. Hybrid structures are also becoming more central in the social OTT market because they let platforms keep subscription income while adding another layer of ad monetization. TVOD still serves event-driven viewing where users are willing to pay for specific moments rather than continuous access. Freemium models remain useful in the social OTT industry because they lower entry barriers and help platforms convert free users into paid or ad-yielding users over time. The IAB Tech Lab's Events and Conversion API v1 also matters here because stronger server-to-server attribution standards can improve how platforms report AVOD performance to advertisers in compliant markets.



By Device:
Smartphones Lead Reach While Smart TVs Improve MonetizationSmartphones accounted for 45.23% of revenue in 2025, which made them the leading access point for the social OTT market by device. Their strength comes from mobile-first internet behavior, especially in regions where users discover, share, and watch short-form content through handheld screens. This pattern keeps the social OTT market closely tied to high-frequency daily usage because phones remain the easiest screen for repeat visits and social circulation. Smart TVs are projected to grow at a 12.13% CAGR through 2031, which makes them the fastest-growing device type in the social OTT market. The gap between these two devices is not a simple replacement story, because each one supports a different viewing context and monetization outcome.
Smart TVs are gaining importance because they support household viewing, larger-format advertising, and longer watch sessions that are attractive to premium brands. Smartphones, by contrast, remain central to acquisition and engagement because they capture impulse viewing, creator following, and instant sharing behavior across the day. Bilibili reported 115.2 million daily active users in Q1 2026 and average daily time spent of 119 minutes per user, which reflects the depth of mobile-led social video engagement in China. Tablets and laptops or PCs continue to serve secondary roles, with tablets fitting children's and learning use cases and laptops supporting more stationary viewing. In the social OTT market, platforms that connect identity and engagement across phone and living room screens should be better positioned than those that monetize each device in isolation.
Geography Analysis
North America and Europe Social OTT Market
North America held 40.66% of global revenue in 2025, which made it the largest regional block in the social OTT market. The region benefits from mature advertising demand, strong connected TV use, and a large base of logged-in viewers that supports first-party identity strategies. This gives the social OTT market in North America a monetization advantage because advertisers can work with more stable audience signals as third-party tracking weakens. Another important factor is the operating system layer, where major home-screen platforms increasingly influence what viewers see first and how services are bundled, promoted, and monetized. Europe followed with a substantial share, and the region remains important because platform scale is supported by large media markets even as compliance requirements raise operating complexity.
APAC Social OTT Market
Asia-Pacific is expected to grow at a 12.14% CAGR through 2031, which makes it the fastest-growing regional part of the social OTT market. India is a major driver because JioHotstar averaged 451 million monthly active users in FY26 and became the first Indian paid OTT platform to cross 1 billion downloads. JioHotstar is also expected to partner with OpenAI in February 2026 to add conversational search across multiple Indian languages, highlighting how the region is using AI tools to address discovery and scale challenges. China adds further strength, as its network video user base is expected to expand significantly by December 2025, while short-video penetration is projected to remain high.
MEA and South America Social OTT Market
South America, the Middle East, and Africa form the next expansion layer for the social OTT market, even though monetization structures differ across them. In South America, mobile-first AVOD behavior remains important because it matches local affordability needs and supports broad audience reach. The Middle East is building more scale in subscription streaming, while telco bundles are becoming a useful differentiation tool as connectivity services become less distinctive. Africa is still early in development, but the social OTT market there is structurally important because mobile-first viewing and alternative payment tools can open access where card infrastructure is less developed. Across these regions, the social OTT market should grow where platforms align pricing, language, payment design, and distribution with local consumption habits rather than copying a single global model.

Competitive Landscape
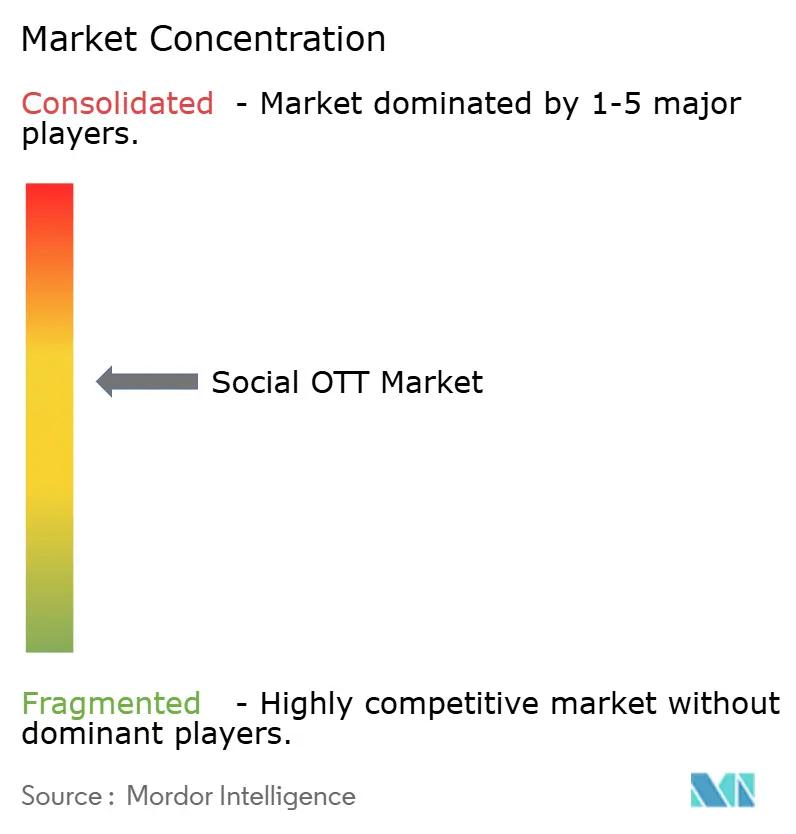
The social OTT market has a dual structure, with a concentrated global tier led by Alphabet, Meta Platforms, TikTok, and Netflix, and a more fragmented regional tier that includes JioStar, Tencent, Bilibili, Zee Entertainment, and Snap. This means the social OTT market is fragmented when viewed by geography, but platform power is much tighter when measured by time spent, discovery control, advertising inventory, and creator monetization systems. The strongest companies are no longer defined only by content libraries, because competitive advantage now also comes from recommendation depth, logged-in identity, and the ability to support creators and advertisers inside one platform. This is why the social OTT market is seeing competition shift from catalog scale toward ecosystem scale. It also explains why companies are investing in operating systems, AI, commerce overlays, and new creator tools rather than relying on one subscription product alone.
Netflix showed this shift in April 2026 when it launched a vertical video feed and introduced AI-led recommendation upgrades, with a broader mobile redesign planned later in 2026. Netflix then deepened its short-form position in July 2026 by signing publisher content agreements with BuzzFeed Studios, Condé Nast, Hearst Magazines, and Penske Media for rollout across 6 markets. Fox also announced a USD 22 billion acquisition of Roku in June 2026, which would combine broadcast rights, FAST assets, and operating system distribution into one larger television platform if it closes in H1 2027. JioHotstar's February 2026 AI search partnership with OpenAI also showed that regional leaders in the social OTT market are using product innovation to strengthen multilingual discovery rather than depending only on content spending. Meta added another layer to this competition in March 2026 when it launched Creator Fast Track, using guaranteed payments to pull established creators and their audiences deeper into its ecosystem.
These moves indicate that the social OTT market is becoming harder for smaller entrants that lack capital, data scale, or compliance infrastructure. The European regulatory environment is part of that barrier because the Digital Services Act requires stronger protections around minors and systemic platform risk. In the United States, the reintroduced Kids Online Safety Act in 2025 points in the same direction, with more scrutiny around platform duty of care and youth protections. Even so, the social OTT market still leaves room for regional and format-specific challengers where local language content, creator commerce, or mobile-native engagement remains underbuilt. Competitive intensity is therefore high, but leadership increasingly belongs to companies that can integrate streaming, social discovery, AI, advertising, and creator monetization into one operating model.
Social OTT Industry Leaders
Alphabet Inc.
Amazon.com, Inc.
Apple Inc.
Comcast Corporation
The Walt Disney Company
- *Disclaimer: Major Players sorted in no particular order
Social OTT Market Companies Covered in this Report
- Alphabet Inc.
- Amazon.com, Inc.
- Apple Inc.
- Comcast Corporation
- The Walt Disney Company
- Meta Platforms, Inc.
- Netflix, Inc.
- Paramount Global
- Rakuten Group, Inc.
- Roku, Inc.
- Snap Inc.
- Tencent Holdings Limited
- TikTok Pte. Ltd.
- Twitch Interactive, Inc.
- Vimeo, Inc.
- Warner Bros. Discovery, Inc.
- X Corp.
- Zee Entertainment Enterprises Limited
- JioStar Private Limited
- Dailymotion S.A.

Recent Industry Developments in Social OTT Market
- July 2026: Netflix announces short-form video licensing agreements with BuzzFeed Studios, Condé Nast, Hearst Magazines, and Penske Media, with content from Bon Appétit, Variety, Vogue, and Cosmopolitan set to launch on August 3, 2026 in 6 markets. The move positions Netflix as a direct alternative to YouTube for publisher-produced short-form content, addressing viewer drop-off between series seasons.
- July 2026: JioStar reports FY26 revenue of INR 34,917 crore (USD 4.13 billion), with net profit of INR 3,434 crore (USD 3.56 billion), and JioHotstar averaging 451 million monthly active users during FY26, the largest streaming platform in India by active users.
- June 2026: Fox Corp. announces it will acquire Roku in a cash-and-stock transaction valuing Roku at USD 22 billion, with the deal expected to close in H1 2027. The combined entity will become the third-largest US television business by viewership, merging Fox's sports and news broadcast rights and Tubi's FAST platform with Roku's operating system, which reaches more than 100 million streaming households.
- June 2026: Snap spins off its internal generative AI video team into a new company, Dotmo, focused on AI models for interactive gaming experiences, citing the high cost of conducting AI research within Snap's operating structure. This is Snap's second major spinoff in 2026 following the separation of its Specs smart glasses division.


Global Social OTT Market Report Scope
Social OTT Market refers to over‑the‑top services that combine streaming media with social networking features, enabling users to watch, share, and interact around video content in real time over the internet. It includes social‑video platforms, community‑driven streaming apps, and traditional OTT services that embed social tools such as comments, reactions, watch parties, and user‑generated content feeds, blurring the line between social media and entertainment streaming.
The Social OTT Market Report is Segmented by Revenue Model (SVOD, AVOD, TVOD, Hybrid, and Freemium), Device (Smartphones, Smart TVs, Tablets, and Laptops and PCs), and Geography (North America, South America, Europe, Asia-Pacific, Middle East, and Africa). The Market Forecasts are Provided in Terms of Value (USD).
| SVOD |
| AVOD |
| TVOD |
| Hybrid |
| Freemium |
| Smartphones |
| Smart TVs |
| Tablets |
| Laptops And PCs |
| North America | United States |
| Canada | |
| Mexico | |
| South America | Brazil |
| Argentina | |
| Chile | |
| Rest of South America | |
| Europe | Germany |
| United Kingdom | |
| France | |
| Italy | |
| Spain | |
| Rest of Europe | |
| Asia-Pacific | China |
| Japan | |
| India | |
| South Korea | |
| Australia | |
| Rest of Asia-Pacific | |
| Middle East | Saudi Arabia |
| United Arab Emirates | |
| Qatar | |
| Rest of Middle East | |
| Africa | South Africa |
| Egypt | |
| Nigeria | |
| Rest of Africa |
| By Revenue Model | SVOD | |
| AVOD | ||
| TVOD | ||
| Hybrid | ||
| Freemium | ||
| By Device | Smartphones | |
| Smart TVs | ||
| Tablets | ||
| Laptops And PCs | ||
| By Geography | North America | United States |
| Canada | ||
| Mexico | ||
| South America | Brazil | |
| Argentina | ||
| Chile | ||
| Rest of South America | ||
| Europe | Germany | |
| United Kingdom | ||
| France | ||
| Italy | ||
| Spain | ||
| Rest of Europe | ||
| Asia-Pacific | China | |
| Japan | ||
| India | ||
| South Korea | ||
| Australia | ||
| Rest of Asia-Pacific | ||
| Middle East | Saudi Arabia | |
| United Arab Emirates | ||
| Qatar | ||
| Rest of Middle East | ||
| Africa | South Africa | |
| Egypt | ||
| Nigeria | ||
| Rest of Africa | ||


Key Questions Answered in the Report
What is the current and forecast value of the social OTT market?
The social OTT market size stood at USD 17.61 billion in 2025 and reaches USD 19.98 billion in 2026. It is forecast to reach USD 34.69 billion by 2031 at an 11.67% CAGR.
Which revenue model leads social OTT revenue today?
SVOD remained the largest revenue model with a 60.54% share in 2025, showing that premium subscription viewing still anchors platform earnings even as ad-backed models expand faster.
Why is AVOD growing faster than SVOD in social streaming?
AVOD is projected to grow at an 11.82% CAGR through 2031 because it broadens access, fits price-sensitive audiences, and gives platforms another path to monetize time spent.
Which device is shaping viewing behavior the most?
Smartphones led with a 45.23% share in 2025 because they remain the primary screen for discovery, short-form viewing, and social sharing. Smart TVs are growing faster at a 12.13% CAGR because they improve monetization and household viewing.
Which region offers the strongest growth opportunity through 2031?
Asia-Pacific is the fastest-growing region with a 12.14% CAGR, supported by large-scale user bases in India and China and by multilingual discovery tools that improve content access.
What is changing competition among major platforms?
Competition is shifting toward integrated ecosystems that combine streaming, social feeds, AI recommendations, creator programs, commerce tools, and stronger first-party audience data.
Page last updated on:





