
Market Overview
| Study Period | 2020 - 2031 |
|---|---|
| Market Size (2026) | USD 2.8 Billion |
| Market Size (2031) | USD 3.81 Billion |
| Growth Rate (2026 - 2031) | 6.36 % |
| Fastest Growing Market | Asia Pacific |
| Largest Market | Asia Pacific |
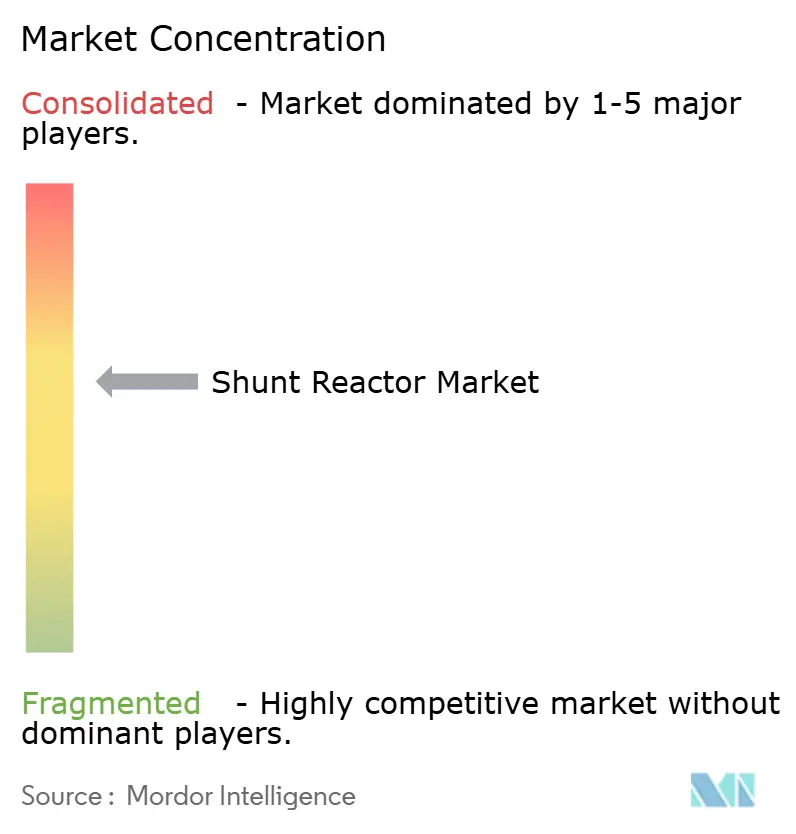
| Market Concentration | Medium |
Major Players *Disclaimer: Major Players sorted in no particular order Image © Mordor Intelligence. Reuse requires attribution under CC BY 4.0. | |
Shunt Reactor Market Analysis by Mordor Intelligence
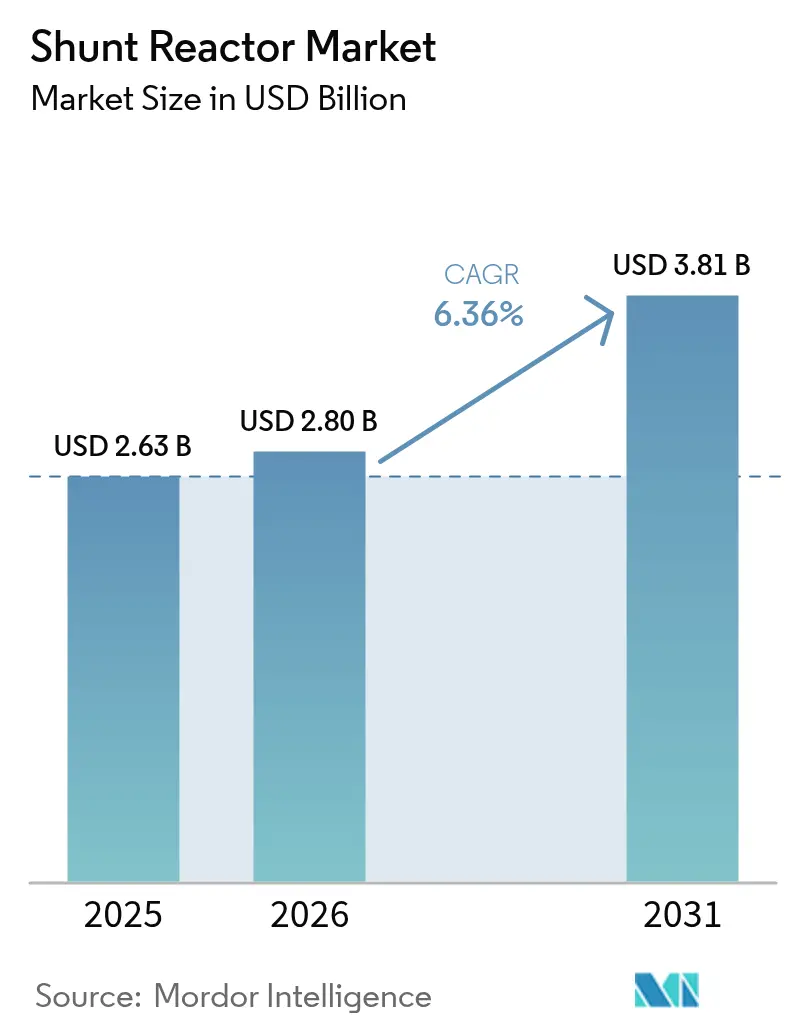
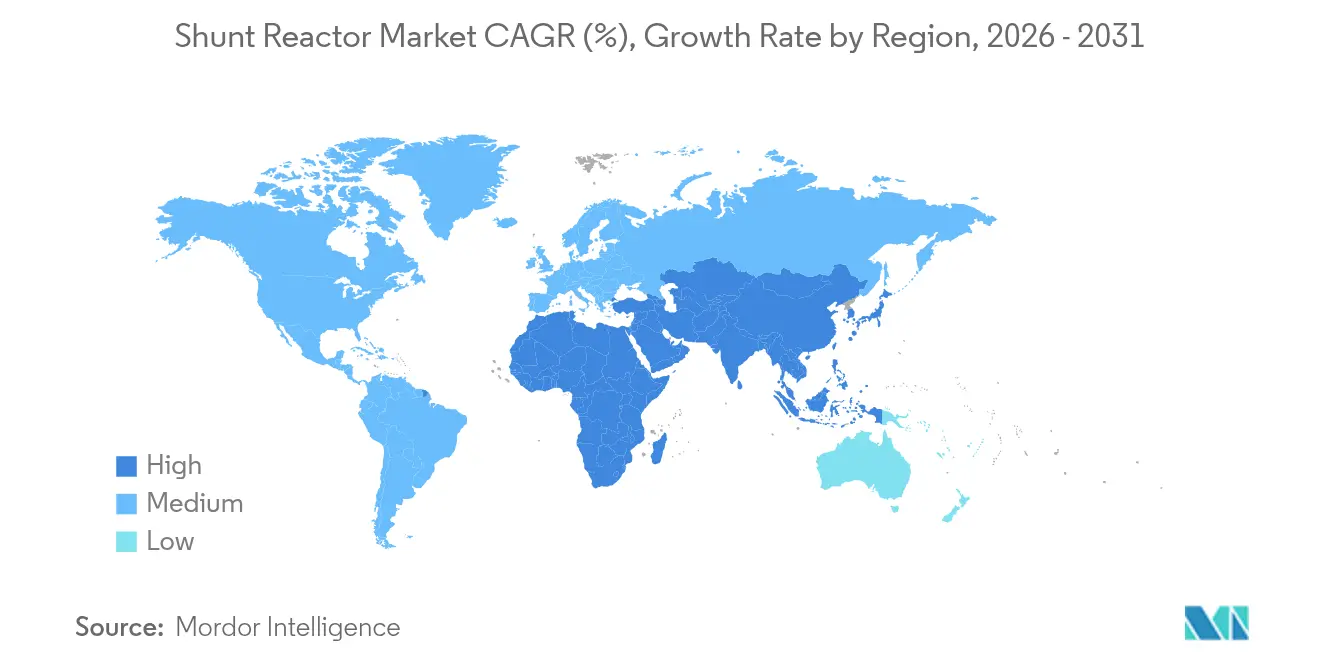
The shunt reactor market size is expected to grow from USD 2.63 billion in 2025 to USD 2.8 billion in 2026 and is forecast to reach USD 3.81 billion by 2031 at 6.36% CAGR over 2026-2031. Accelerating renewable integration, the proliferation of high-voltage direct-current (HVDC) links, and tightening voltage-stability rules are the principal demand catalysts that anchor this trajectory. HVDC interconnections across Europe and China require sizeable inductive compensation at converter stations, while North America’s inverter-dominated renewable fleets add a similar need for dynamic reactive-power control. Asia-Pacific remains the prime arena for grid-modernization projects, underpinned by China’s ultra-high-voltage build-out and India’s grid-code enforcement. Fixed reactor designs continue to dominate purchases, yet variable units and air-core dry designs are growing faster as utilities seek flexible and environmentally neutral solutions. Competitive intensity stays moderate because the complex engineering and qualification cycles favor experienced suppliers with global manufacturing footprints.
Key Report Takeaways
- By product type, oil-immersed units commanded 67.10% revenue share of the shunt reactor market in 2025, whereas air-core dry technology is projected to expand at a 6.62% CAGR to 2031
- By form factor, fixed designs held 57.75% of the shunt reactor market share in 2025; the variable segment posts the highest projected CAGR at 7.12% through 2031.
- By phase, three-phase systems led with 62.05% share in 2025, while single-phase equipment is advancing at a 6.41% CAGR during 2026-2031.
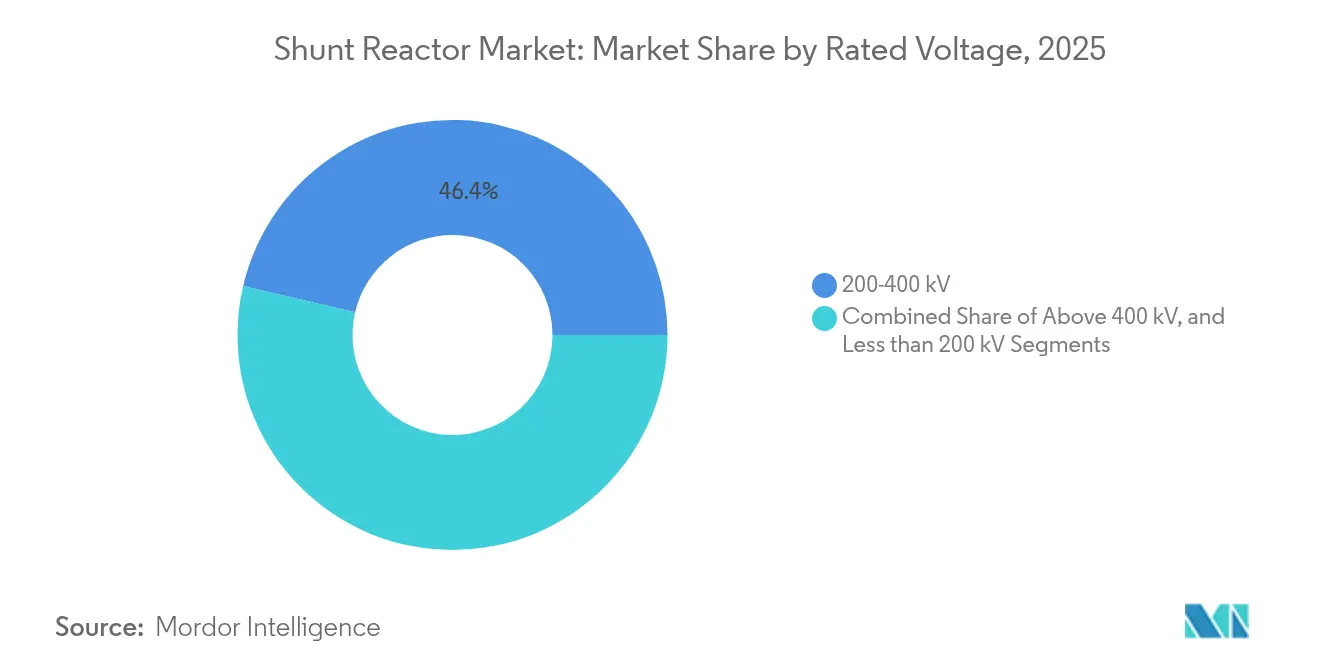
- By rated voltage, the above 400 kV class is the fastest-growing band at 7.58% CAGR, even though the 200-400 kV tier remains the largest contributor at 46.35% revenue in 2025.
- By end user, transmission utilities retained 53.55% share of the shunt reactor market size in 2025, yet renewable developers represent the quickest-rising buyer group at an 7.89% CAGR.
- By region, Asia-Pacific captured 41.35% of global revenue in 2025; it is also the fastest-growing geography at 6.46% CAGR through 2031.
Note: Market size and forecast figures in this report are generated using Mordor Intelligence’s proprietary estimation framework, updated with the latest available data and insights as of 2026.
Market Trends and Insights
Drivers Impact Analysis of Shunt Reactor Market*
| Driver | (~) % Impact on CAGR Forecast | Geographic Relevance | Impact Timeline |
|---|---|---|---|
| Expanding HVDC interconnection projects in Europe and China | +1.8% | Europe & China, spill-over to North America | Medium term (2-4 years) |
| Rapid addition of renewable generation capacity causing reactive power imbalance in North America | +1.5% | North America, secondary impact in APAC | Short term (≤ 2 years) |
| Grid-code mandates for voltage stability in India and MENA utilities | +1.2% | India & MENA, regulatory influence in other emerging markets | Medium term (2-4 years) |
| Refurbishment of aging sub-transmission networks in the United States and Canada | +0.9% | United States & Canada | Long term (≥ 4 years) |
| Industrial electrification push in SE-Asian steel and chemical clusters | +0.7% | Southeast Asia, particularly Indonesia, Vietnam, Thailand | Medium term (2-4 years) |
| Surge in offshore-wind export cables requiring More than 400 kV compensation reactors | +0.4% | Europe, Asia-Pacific coastal regions, emerging in North America | Long term (≥ 4 years) |
| Source: Mordor Intelligence | |||
Expanding HVDC Interconnections Drive Market Acceleration
Large-scale HVDC corridors reshape the shunt reactor market by multiplying compensation points along converter stations and overhead routes. China’s 800 kV Jinsha River–Hubei line illustrates this pattern by deploying multiple reactor banks to regulate steady-state and transient voltage on a 1,901 km stretch.[1]People’s Daily, “China Builds World’s Highest UHVDC Transmission Project,” en.people.cn Parallel investment across Europe under a EUR 584 billion grid program creates similar demand for inductive compensation at each cross-border converter node. The need intensifies as interconnected systems pursue energy security, because bidirectional flows amplify reactive-power swings during power-transfer fluctuations.
Renewable Generation Imbalance Accelerates Compensation Needs
Wind and solar fleets inject capacitive charging currents that lift line voltage during light-load periods, forcing operators to install inductive hardware for containment. In Texas and the Great Plains, wind additions already trigger dynamic compensation calls in day-ahead dispatch.[2]North American Electric Reliability Corporation, “Reliability Guideline: Reactive Power Planning,” nerc.com Offshore wind cables deepen the imbalance because long subsea links possess high capacitive reactance, hence each string typically receives a dedicated shunt reactor cabinet onshore. The intermittent profile of renewables compels utilities to adopt variable designs that can modulate MVAr output in real time, thereby underscoring technology upgrades across the shunt reactor market.
Grid-Code Mandates Enforce Voltage-Stability Standards
India’s transmission operator manages 178,975 circuit km of EHV lines subject to statutory voltage-band limits enforced through penalties.[3]Government of India, Ministry of Power, “Government of India, Ministry of Power,” powermin.gov.in Similar frameworks across MENA raise reactive-power compliance from a discretionary option to a legal requirement, prompting utilities to procure fixed and variable units as a risk-mitigation asset. The linkage between financial penalties and voltage excursions solidifies a compliance-driven revenue pipeline for shunt-reactor vendors.
Industrial Electrification Drives Infrastructure Demand
Southeast Asia’s steel and chemical clusters transition toward electric processes that introduce highly variable, non-linear loads. Indonesia’s steel capacity, projected to exceed 45 million t by 2035, necessitates network reinforcement with inductive support equipment. Chemical complexes face similar requirements to protect sensitive drives from voltage flicker. Concentrated industrial zones therefore represent localized hubs where multiple customers pool demand for shunt reactors, stimulating unit sales and aftermarket service contracts.
Restraints Impact Analysis of Shunt Reactor Market*
| Restraints | (~) % Impact on CAGR Forecast | Geographic Relevance | Impact Timeline |
|---|---|---|---|
| Supply-chain tightness for high-grade electrical steel laminations | -0.8% | Global, particularly affecting Asia-Pacific production | Short term (≤ 2 years) |
| Environmental-clearance delays for mega-corridors in Brazil | -0.3% | South America, regulatory precedent concerns globally | Medium term (2-4 years) |
| Capital-cost premium of variable shunt reactors below 220 kV | -0.2% | Global, most pronounced in cost-sensitive emerging markets | Long term (≥ 4 years) |
| Substitution risk from STATCOM deployments in urban substations | -0.1% | Urban areas globally, particularly in developed markets | Long term (≥ 4 years) |
| Source: Mordor Intelligence | |||
Supply-Chain Constraints Limit Production Capacity
Non-grain-oriented electrical steel must satisfy narrow magnetic-loss windows, yet worldwide melting capacity remains concentrated in a few mills. Post-pandemic logistics snarls and power-equipment super-cycle demand strain availability, extending shunt-reactor delivery lead times and elevating material cost premiums. Projects that rely on large-scale units above 400 kV bear the heaviest exposure because every tank requires significant tonnage of premium laminations.
STATCOM Technology Poses Substitution Threat
Static synchronous compensators deliver step-less reactive-power control with a compact footprint that fits space-constrained urban substations. Hitachi Energy reports increasing inquiries for STATCOM retrofits where land scarcity and dynamic grid-support needs outweigh the higher capital outlay. Although shunt reactor market incumbents still dominate high-capacity rural sites, the encroachment of power electronic alternatives chips away at growth potential in metropolitan grids.
*Our forecasts treat driver/restraint impacts as directional, not additive. The impact forecasts reflect baseline growth, mix effects, and variable interactions.
Shunt Reactor Market Segment Analysis
By Product Type:
Oil-Immersed Dominance Faces Environmental PressureOil-immersed designs captured 67.10% of the shunt reactor market in 2025 and remain indispensable for voltages above 400 kV because mineral oil enhances insulation strength and dissipates heat efficiently. This segment safeguards its revenue base as long-span HVDC and UHVAC lines proliferate, reinforcing demand at the high-end of the voltage spectrum. Yet utilities with stringent environmental objectives pivot toward dry-type solutions that eliminate oil leakage risk and cut fire hazards.
Air-core dry technology posts a 6.62% CAGR, outpacing the broader shunt reactor market as lifecycle cost calculations favor maintenance-free operation. Environmental permitting processes in Europe and select North American states now score oil-free assets higher, stimulating pilot deployments in coastal wind-integration substations. Longer service intervals and compact footprints strengthen the business case in urban installations that face staffing and space constraints.




By Form Factor:
Variable Reactors Gain Dynamic Control PremiumFixed units retained 57.75% revenue in 2025, signifying their reliability for steady-state inductive compensation on long cables and overhead lines. Such tanks often link to a single operating point, yielding low complexity and favorable capex per MVAr, hence utilities still specify them for base-load compensation schemes within the shunt reactor market size.
Variable shunt reactors, advancing at 7.12% CAGR, integrate tap-changers that modulate inductive output across a continuous range. Grid operators adopt them to smooth voltage during renewable ramps, thereby curtailing breaker operations and capacitor bank switching events. Successful deployments on Slovenian and Croatian 400 kV corridors validate technical maturity, encouraging wider use in offshore wind export circuits where dynamic absorption prevents over-voltages during cable
By Phase:
Three-Phase Systems Dominate Utility ApplicationsThree-phase tanks generated 62.05% of the revenue in 2025 and remain the default build for extra-high-voltage grids, as balanced operation effectively dampens zero-sequence currents and reduces losses across long lines. The high current-handling capability of integrated three-phase cores enables a single enclosure to supply large MVAr ratings without the need for synchronizing multiple single-phase units.
Single-phase designs are growing at a 6.41% CAGR as customized series-compensation projects require phase-by-phase control to correct unbalanced load flows. Industrial plants specify single-phase reactors in steel melt-shop feeders to fine-tune voltage on individual arc-furnace legs, but this niche adoption diversifies the product range without substantially eroding the dominance of integrated three-phase equipment in the shunt reactor market.
By Rated Voltage:
Ultra-High Voltage Drives Premium GrowthThe 200-400 kV band still accounts for 46.35% of global revenue because most transmission grids operate inside this envelope; consequently, it represents the backbone of the shunt reactor market share. Procurement volumes remain steady as utilities refurbish legacy corridors and cable owners counter capacitive charging on submarine links.
Above 400 kV units accelerate at a 7.58% CAGR as China’s UHVDC backbone and Europe’s 525 kV HVDC export schemes progress. Each converter station installs multiple compensation groups sized between 100 MVAr and 300 MVAr, inflating value per site several-fold. Premium pricing rewards manufacturers that master complex insulation co-ordination and mechanical resonance damping at these voltage extremes.
By End User:
Renewable Developers Accelerate Market ExpansionTransmission utilities preserved 53.55% of 2025 turnover, leveraging established procurement frameworks and standardized specifications. Their recurring fleet renovations anchor baseline demand, particularly in the Asia-Pacific and North America regions.
Renewable developers’ purchases are growing at an 7.89% CAGR as offshore wind and gigawatt-scale solar projects must meet point-of-connection voltage rules. Variable shunt reactors paired with STATCOMs are increasingly appearing in grid impact studies due to their cost-performance balance, adding incremental demand from project-based buyers.
Geography Analysis
APAC Shunt Reactor Market
Asia-Pacific generated 41.35% of shunt reactor market revenue in 2025 and is forecast to advance at a 6.46% CAGR to 2031. China completed 42 UHV lines by late-2024, each embedding multiple 300 MVAr shunt banks to secure voltage along 1,000 km corridors. India’s grid-modernization push aligns with a 500 GW non-fossil target by 2030, spurring purchases across 178,975 circuit km of EHV lines. Indonesia and Vietnam enrich regional growth as steel and petrochemical clusters electrify production, driving localized compensation requirements.
North America Shunt Reactor Market
North America maintains mature but steady growth, propelled by aged equipment replacement and inverter-rich renewable additions. The United States confronts a transformer shortage that extends to allied reactors, with only 20% domestic supply coverage forcing utilities to place advance orders . Canada emphasizes remote renewable integration from hydro and wind hubs, necessitating long-distance 230-500 kV lines that incorporate inductive support to safeguard voltage stability against load rejection events.
Europe Shunt Reactor Market
Europe’s market pivots on aggressive decarbonization and cross-border meshing of national grids. The European Commission earmarks EUR 584 billion for networks by 2030, with large slices devoted to 525 kV HVDC links that rely on site-specific compensation reactors. Offshore wind farms in the North and Baltic Seas feed via 66-kV array cables into long 220–320 kV export routes, each requiring inductive absorption onshore to offset capacitive charging. Environmental compliance influences buying patterns toward dry-type and variable designs, accelerating technology migration within the continent.

Value Chain Analysis
The shunt reactor value chain begins with upstream inputs and engineered components, including electrical steel laminations, copper conductors, insulation systems (paper, pressboard, and polymers), bushings, tap changers (for variable units), tanks, radiators and cooling hardware for oil-immersed designs, and monitoring sensors. These inputs are then used in core-and-coil fabrication, assembly, drying or impregnation, oil filling (or dry-type casting and air-core winding), and factory acceptance testing, followed by logistics to EPCs and utilities for substation integration, site testing, commissioning, and lifecycle services (spares, oil handling or replacement, condition monitoring, and refurbishment).
Bottlenecks tend to cluster around high-grade electrical steel, copper, and specialized insulation supply, which can stretch lead times for large EHV and UHV units and increase working-capital needs for manufacturers and utilities. Downstream demand is routed mainly through transmission-utility tenders and EPC frameworks tied to HVDC and UHVAC corridors and renewable integration works, including GE Vernova Grid Solutions securing an order from Power Grid Corporation of India for 765 kV shunt reactors (February 2024). OEM strategies increasingly emphasize regional manufacturing and supply security for long-lead equipment, alongside material choices that align with environmental procurement requirements, including shifts toward natural ester fluids and oil-free designs where technically feasible.
Competitive Landscape
The shunt reactor market shows moderate concentration. Hitachi Energy, Siemens Energy, and GE Grid Solutions collectively control a significant share owing to deep engineering expertise, vertically integrated factories, and multidecade utility references. Hitachi Energy’s USD 6 billion global capacity expansion to 2027 exemplifies the scale of capital needed to maintain leadership. Siemens Energy leverages a broad FACTS portfolio that bundles shunt reactors with STATCOMs and synchronous condensers, appealing to customers that prefer turnkey reactive-power packages. GE Grid Solutions differentiates through proven UHVDC track records and localized service centers across Asia.
Asian challengers such as Hyosung Heavy Industries and CG Power target cost-sensitive tenders with regional supply chains. Hyosung’s commitment to double US transformer output by 2027 also boosts its North American reactor footprint. Consolidation continues as Siemens agreed to purchase Trayer Engineering in 2024, aiming to reinforce medium-voltage offerings that complement transmission-class reactors. Supply-chain constraints in electrical steel spur vendors to lock long-term contracts with mills, turning raw-material security into a key competitive parameter.
Strategic moves increasingly orient around renewable integration niches. Hitachi Energy invests in modular variable-reactor platforms optimized for offshore substations, while GE Vernova collaborates with Seatrium to combine HVDC, breakers, and reactors in bundled offshore grid packages. The slow emergence of power-electronic substitutes such as STATCOMs in urban grids prompts leading suppliers to hedge by cross-licensing or in-house development, preserving revenue even if certain sub-segments migrate away from traditional magnetics.
Shunt Reactor Industry Leaders
Siemens AG
CG Power and Industrial Solutions Limited
Mitsubishi Electric Corporation
Fuji Electric Co.
Hitachi Energy Ltd.
- *Disclaimer: Major Players sorted in no particular order
Shunt Reactor Market Companies Covered in this Report
- Hitachi Energy Ltd.
- Siemens Energy AG
- Mitsubishi Electric Corporation
- GE Grid Solutions
- Hyosung Heavy Industries
- Fuji Electric Co., Ltd.
- CG Power and Industrial Solutions Ltd.
- Trench Group (Siemens)
- TBEA Co., Ltd.
- NR Electric Co., Ltd.
- Toshiba Energy Systems and Solutions Corp.
- SGB-SMIT Group
- Zaporozhtransformator PJSC
- Shandong Taikai Power Engineering Co., Ltd.
- Hyundai Electric and Energy Systems Co., Ltd.
- Bharat Heavy Electricals Ltd.
- Beijing Power Equipment Group
- Coil Innovation GmbH

Market Opportunities and Future Outlook
Utilities and developers are increasingly treating shunt reactors as compliance and operability assets, not only as passive compensation hardware. This creates whitespace for controllable solutions such as variable designs, monitoring, and engineered packages around HVDC converter stations and long HVAC corridors. In high-voltage applications, opportunities also cluster around insulation systems designed to address fire risk and permitting constraints, supported by real project execution such as Hitachi Energy delivering and commissioning a 460 kV natural ester-filled shunt reactor for ISA ENERGIA BRASIL at the Bauru Substation in Sao Paulo (first unit operational in May 2026). The outcome helps expand the addressable space for ester-filled EHV reactors in grids where permitting and ESG screens affect technology selection.
Urban and space-constrained substations are another opportunity area, since fire-safety constraints and the footprint of conventional oil-immersed designs can narrow procurement options. That dynamic supports interest in air-core and other advanced designs. Technology pilots also provide direction for longer-term product roadmaps, including the commissioning of an air-core toroidal superconducting shunt reactor by State Grid Shanghai Municipal Electric Power Company (February 2026), which points to R&D focused on compact and lower-noise reactive compensation. In parallel, transmission buildouts that explicitly specify 765 kV shunt reactors in planning documents, such as the Euclid 765 kV substation proposal submitted to ERCOT by LCRA Transmission Services Corporation and CenterPoint Energy Houston Electric (March 2026), reinforce demand for high-rating equipment, multi-unit configurations, and associated engineering and field services.
Recent Industry Developments in Shunt Reactor Market
- May 2026: Hitachi Energy delivered and commissioned the first 460 kV natural ester-filled shunt reactor project for ISA ENERGIA BRASIL at the Bauru Substation in Sao Paulo, with the first unit entering operation in May 2026. The delivery points to EHV adoption of ester-based insulation as utilities tighten environmental and fire-safety requirements while maintaining transmission-class performance targets.
- August 2025: Hitachi Energy committed to deliver 15 custom-made shunt reactors to NKT for a new high-voltage cable test center in Karlskrona, Sweden, with staged deliveries through 2027. The order connects shunt reactor supply to the expanding HV cable ecosystem and test infrastructure, reinforcing demand from grid-expansion and cable-qualification programs.
- August 2024: Hitachi Energy secured a framework agreement with Svenska kraftnat to supply power transformers and 400 kV shunt reactors for Swedish grid upgrades, with deliveries planned for 2027-2032. Multi-year frameworks of this type provide longer production visibility and tend to favor suppliers with established qualification and capacity planning for high-voltage equipment.


Shunt Reactor Market Report Scope and Research Methodology
Market Definition and Coverage
For this methodology, the shunt reactor market is defined as the revenue generated from shunt reactors used to absorb reactive power and support voltage control in transmission and distribution networks, including fixed and variable designs sold across key voltage classes and end users.
Scope exclusions: This sizing excludes broader grid equipment and services that are not shunt reactors, such as capacitor banks, STATCOMs, harmonic filters, and installation or maintenance-only contracts when equipment value is not attributable.
Segments Covered in This Report
- By Product Type
- Oil-Immersed Shunt Reactor
- Air-core Dry Shunt Reactor
- By Form Factor
- Fixed Shunt Reactor
- Variable Shunt Reactor
- By Phase
- Single-Phase Reactor
- Three-Phase Reactor
- By Rated Voltage
- Less than 200 kV
- 200-400 kV
- Above 400 kV
- By End-user
- Transmission Utilities
- Distribution Utilities
- Industrial (Steel, Petrochemical, Cement, Data Centers)
- Renewable Project Developers
- By Geography
- North America
- United States
- Canada
- Mexico
- Europe
- Germany
- United Kingdom
- France
- Nordics
- Rest of Europe
- South America
- Brazil
- Rest of South America
- Asia-Pacific
- China
- Japan
- India
- South-East Asia
- Rest of Asia-Pacific
- Middle East and Africa
- Middle East
- Gulf Cooperation Council Countries
- Turkey
- Rest of Middle East
- Africa
- South Africa
- Rest of Africa
- Middle East
- North America
Data Sources, Market Sizing, and Validation
Desk Research
Desk research starts with public power and grid indicators that show where reactive power compensation is being added, and then those indicators are converted into a structured demand picture. We commonly refer to sources such as the International Energy Agency for transmission and renewables context, the World Bank for electrification progress and investment signals, and national grid and energy regulator publications for network expansion plans and interconnection additions. Trade and customs statistics are also checked where product coding is usable, since they help validate cross-border shipment direction and regional demand balance.
To bring the secondary picture closer to actual market behavior, we also review company annual reports, investor decks, and credible industry news for order announcements, commissioning timelines, and pricing commentary. Where available, paid subscriptions are used for company financials and intelligence, contract and tender tracking, and patent databases, which improves traceability of active programs and shifts in technology offerings. The desk sources cited here are illustrative only, and many other public documents were also used for data collection, validation, and clarification.
Primary Interviews and Surveys
Primary work is used to confirm what we saw in desk research and to fill gaps that are hard to observe from public data, such as the voltage mix, typical unit configurations, and tender-to-order conversion rates. We spoke with stakeholders across manufacturers, utilities, EPC participants, and technical consultants across major regions, and then rechecked outputs with follow-up questions when responses did not align. Inputs from these discussions were used to lock assumptions on pricing progression, delivery lead times, and replacement versus new build demand.
Distribution of primary research fieldwork respondents
| Company type | Respondent position | Region |
|---|---|---|
| Top tier: 28% | CXOs: 14% | APAC: 44% |
| Mid tier: 57% | Functional/Unit leaders: 39% | EMEA: 34% |
| Smaller Players: 15% | Managers: 47% | Americas: 22% |
Market-Sizing & Forecasting
Sizing is built using a top-down approach where transmission build-out signals are reconstructed into a shunt reactor demand pool, and then split by voltage class, installation preference (fixed versus variable), and utility versus industrial use. The model leans on market fingerprints such as kilometers of new and upgraded transmission lines, additions in high-voltage substations, growth in long cable links and interconnectors, renewable capacity integration needs, and typical reactor counts per substation depending on network design. Since published project lists can lag actual delivery, we layer in primary insights on award cycles, delivery lead times, and the portion of demand coming from replacements after aging assets.
To keep totals practical, we do selective bottom-up checks using sampled price bands and typical unit ratings, then follow up with supplier and channel checks where public order values are visible. If a program does not disclose volumes, gaps are handled by applying range-based assumptions on unit counts per project and then narrowing them using expert feedback. Forecasts are produced using scenario analysis that ties grid investment, renewable additions, and interconnection activity to shunt reactor demand, and the final curve is stress-tested against expected commissioning cadence and pricing movement in key regions.
Data Validation & Update Cycle
Validation happens in layers so the final number is not driven by one data stream. Model outputs are compared against independent signals such as utility capex plans, tender activity, and visible commissioning pipelines, and material variances are investigated before sign-off. When responses from interviews conflict, we re-contact the relevant respondent group and adjust assumptions only after a clear rationale is documented.
Every estimate is reviewed by another analyst for logic, unit consistency, and currency timing, which helps catch anomalies early. The report is refreshed annually, and interim checks are triggered when major grid policy changes, supply disruptions, or unusually large order wins are observed. Before delivery, a final update pass is completed so clients receive the most current view available at that time.
Mordor Intelligence's Shunt Reactor Market Estimate Compared With Other Published Estimates
Published numbers for shunt reactors can vary because researchers do not always use the same year, the same price basis, or the same definition of what counts as shunt reactor revenue. Differences also come from how replacement demand is treated, how voltage classes are mapped, and whether project timing is recognized at award, shipment, or commissioning.
The main gap comes from whether adjacent reactive power equipment and service-heavy bundles are blended into the total, where Mordor Intelligence counts only shunt reactor equipment revenue and aligns pricing to the 2026 base-year mix by voltage class and end user before the forecast is extended.
Benchmark comparison
| Source | Market Size | Gaps in Research Methodology |
|---|---|---|
| Mordor Intelligence | USD 2.80 B (2026) | |
| Global Consultancy A | USD 2.99 B (2025) | Uses a different base year and tends to generalize pricing across regions, which can lift the total when 2024-2025 price levels are applied to all voltage classes without a clear mix adjustment. |
| Industry Research Group B | USD 2.90 B (2025) | Often reports a broader reactive power control view that can blur shunt reactors with nearby equipment categories, and the timing of demand may be tied to planned projects rather than realized order and delivery cadence. |
Across the three values, the spread is mainly explained by base-year choice, what is counted inside the product scope, and how price and timing are applied to projects. By keeping assumptions tied to observable grid build signals and then validating them with expert checks, the estimate remains easy to trace back to a few clear drivers and repeatable steps.


Key Questions Answered in the Report
What is the current valuation of the shunt reactor market?
The shunt reactor market stands at USD 2.8 billion in 2026 with an expected rise to USD 3.81 billion by 2031.
Which region leads the shunt reactor market and why?
Asia-Pacific leads with 41.35% revenue because of China’s UHVDC rollout and India’s stringent grid-code enforcement.
Why are variable shunt reactors gaining traction?
Variable designs grow at 7.12% CAGR as they modulate reactive power continuously, which helps integrate fluctuating renewable generation.
How does offshore wind influence shunt reactor demand?
Offshore wind export cables possess high capacitive reactance that necessitates inductive compensation, boosting demand especially for units above 400 kV.
Page last updated on:


 Your data is secure and never sold or shared.


