Self Leveling Concrete Market Size and Share
Market Overview
| Study Period | 2021 - 2031 |
|---|---|
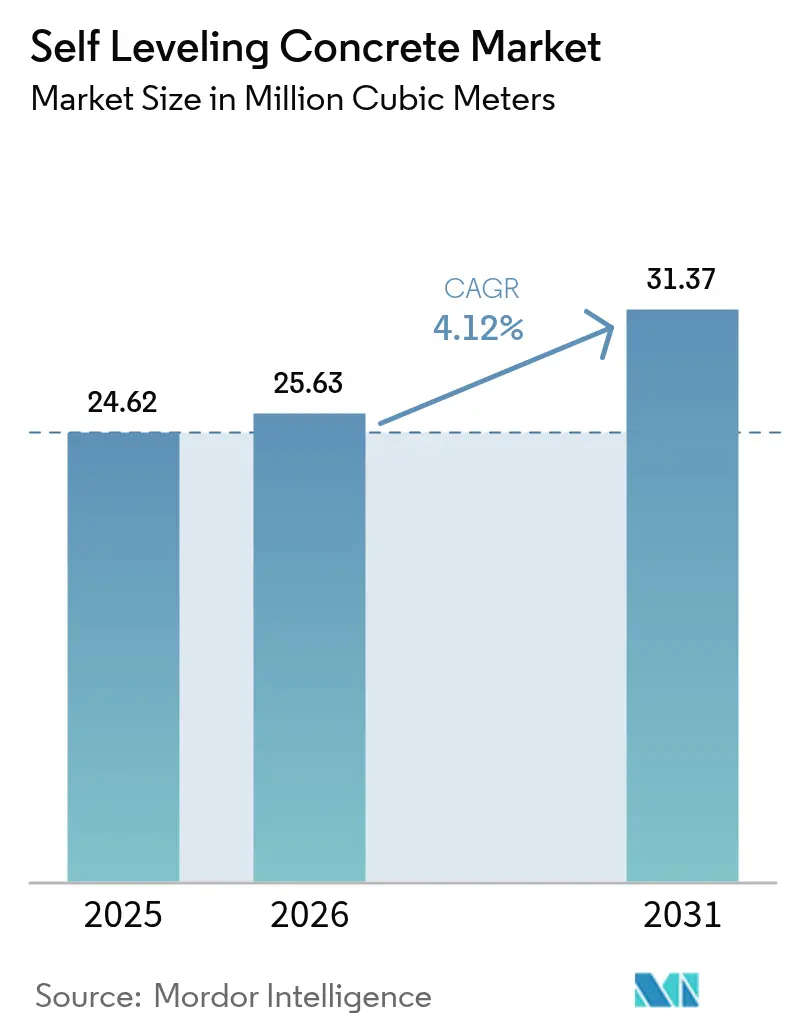
| Market Volume (2026) | 25.63 Million Cubic meters |
| Market Volume (2031) | 31.37 Million Cubic meters |
| Growth Rate (2026 - 2031) | 4.12% CAGR |
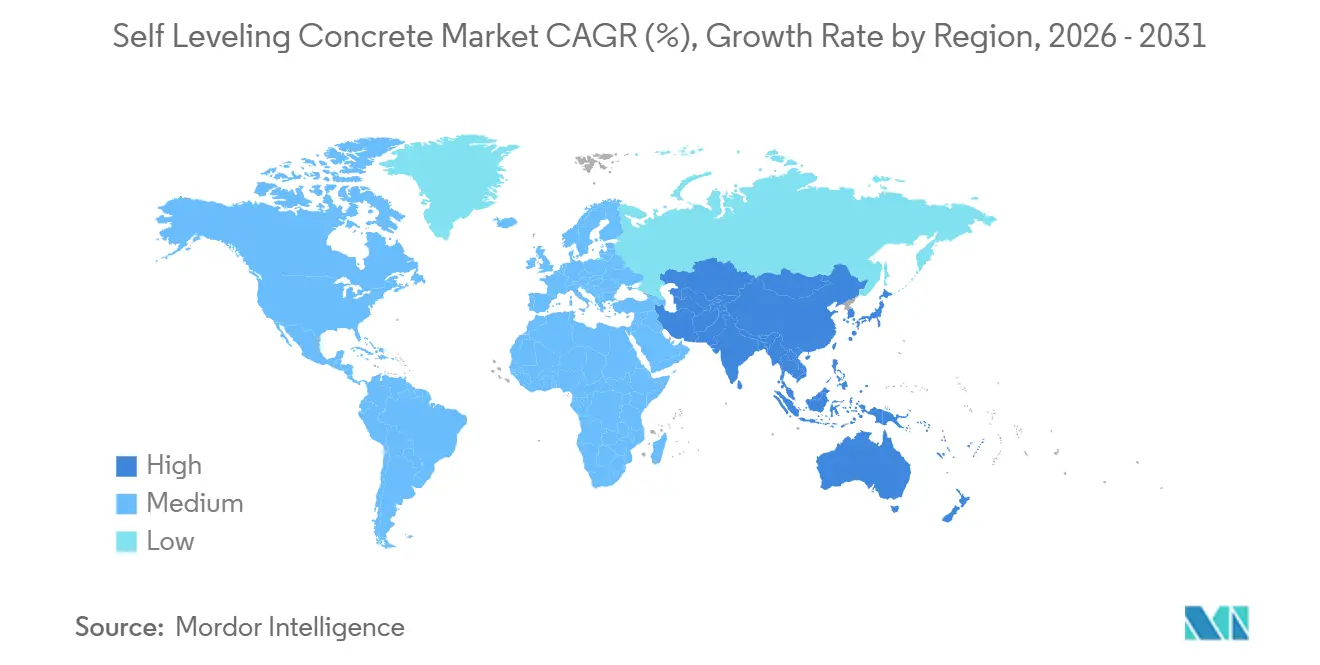
| Fastest Growing Market | Asia Pacific |
| Largest Market | Asia Pacific |
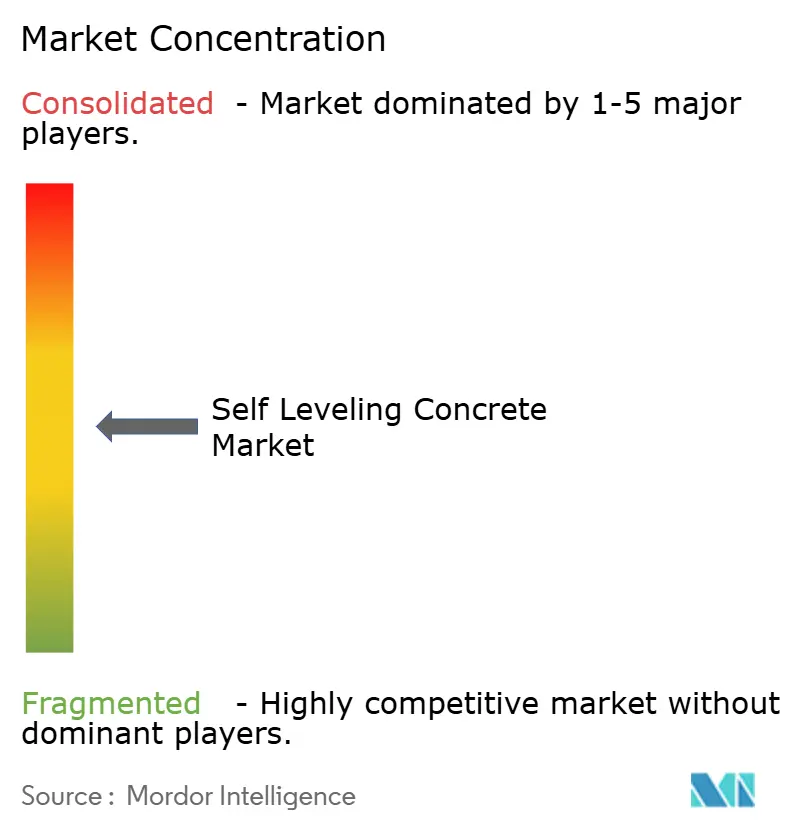
| Market Concentration | Medium |
Major Players *Disclaimer: Major Players sorted in no particular order Image © Mordor Intelligence. Reuse requires attribution under CC BY 4.0. | |
Self Leveling Concrete Market Analysis by Mordor Intelligence
The Self Leveling Concrete Market size is expected to grow from 24.62 Million Cubic meters in 2025 to 25.63 Million Cubic meters in 2026 and is forecast to reach 31.37 Million Cubic meters by 2031 at 4.12% CAGR over 2026-2031. Surging e-commerce logistics construction, stricter sub-floor flatness tolerances for luxury-vinyl-tile (LVT), and the rapid uptake of low-carbon calcium-sulfoaluminate (CSA) blends are reshaping procurement patterns across the Self Leveling Concrete market. Contractors increasingly specify mixes that reach 3,000 psi in ≤72 hours so warehouses can begin rack installation within three months of slab placement. Regional governments are reinforcing the shift through incentives for volatile-organic-compound-free (VOC-free) building materials, while airport-terminal expansions funded by the U.S. Federal Aviation Administration mandate American Concrete Institute (ACI) 302.1R flatness criteria. At the same time, digital-twin-enabled laser-screed robotics are shrinking material waste, cutting labor, and ensuring floor-flatness compliance in real time. Together, these forces improve installation economics yet heighten demand for certified applicator training.
Key Report Takeaways
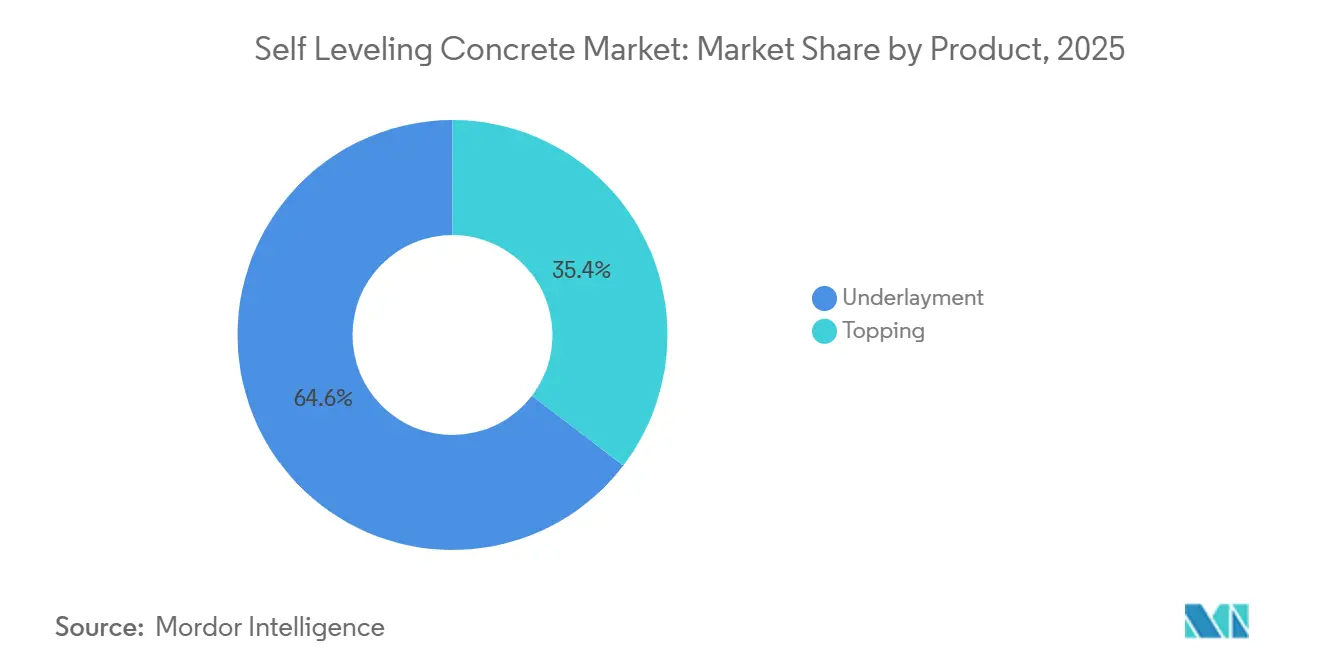
- By product, underlayments held 64.62% of 2025 volume, while toppings are forecast to expand at a 4.38% CAGR through 2031.
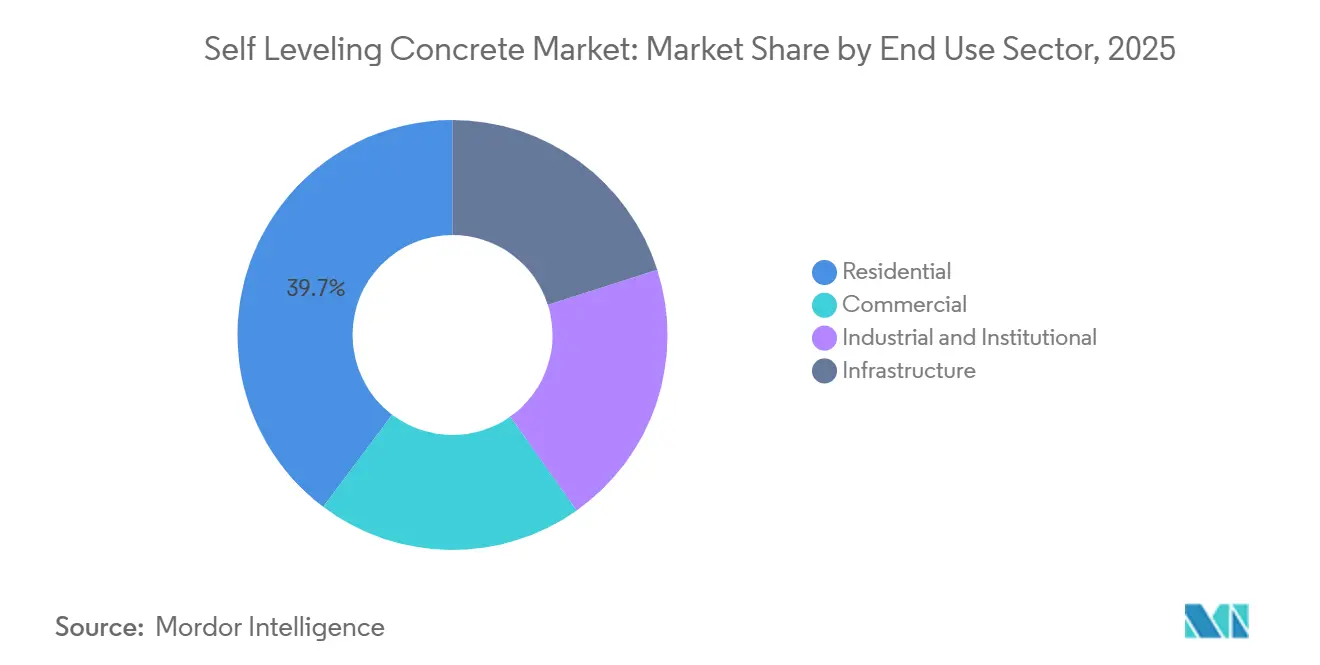
- By end-use sector, residential led with 39.72% of 2025 volume; infrastructure applications record the highest projected CAGR at 4.22% to 2031.
- By geography, Asia-Pacific commanded 38.45% of 2025 consumption and will grow at 4.29% through 2031.
Note: Market size and forecast figures in this report are generated using Mordor Intelligence’s proprietary estimation framework, updated with the latest available data and insights as of 2026.
Global Self Leveling Concrete Market Trends and Insights
Driver Impact Analysis*
| Drivers | (~) % Impact on CAGR Forecast | Geographic Relevance | Impact Timeline |
|---|---|---|---|
| Fast-track flooring schedules in e-commerce fulfillment centers | +0.7% | North America and APAC core, spill-over to Europe | Short term (≤ 2 years) |
| Government incentives for VOC-free indoor building products | +0.5% | Global, with early adoption in EU and North America | Medium term (2-4 years) |
| Luxury-vinyl-tile boom driving demand for ultra-smooth subfloors | +0.9% | Global, concentrated in residential and commercial sectors | Medium term (2-4 years) |
| Carbon-credit monetization via low-alkali CSA formulations | +0.4% | EU, North America, select APAC markets | Long term (≥ 4 years) |
| Digital-twin enabled laser-screed robotics optimizing SLU pours | +0.6% | North America, EU, APAC urban centers | Medium term (2-4 years) |
| Source: Mordor Intelligence | |||
Fast-Track Flooring Schedules in E-Commerce Fulfillment Centers
Amazon announced 15 new North American fulfillment centers in 2025, each requiring floor slabs ready for racking within 90 days of placement, half the traditional schedule. Self-leveling underlayments that achieve 3,000 psi in 72 hours meet this deadline and unlock earlier revenue recognition for operators. Ready-mix suppliers now stock rapid-hardening CSA blends year-round, while laser-screed contractors rely on digital-twin models to validate FF/FL data before set. Global logistics real-estate additions totaled 450 million ft² in 2025, with 60% specifying self-leveling toppings to satisfy automated-guided-vehicle navigation tolerances. Because e-commerce penetration in U.S. retail sales is projected to climb from 19% in 2024 to 24% by 2028, fulfillment-center construction is set to remain the fastest-growing commercial sub-segment.
Government Incentives for VOC-Free Indoor Building Products
The U.S. Environmental Protection Agency’s Safer Choice label, updated in 2024, now certifies self-leveling compounds emitting <50 g/L of VOCs, elevating their preference in federally funded projects[1]U.S. Environmental Protection Agency, “Safer Choice Standard,” epa.gov. The European Union extended its Ecodesign for Sustainable Products Regulation to flooring in 2025, mandating third-party VOC and embodied-carbon verification. Manufacturers are substituting solvent-based rheology modifiers with bio-based cellulose ethers; BASF’s reformulated MasterEmaco line met the Safer Choice benchmark in 2025. ISO 16000-9 indoor-air-quality compliance is now essential for LEED v5 and BREEAM credentials, accelerating adoption within the self leveling concrete market.
Luxury-Vinyl-Tile Boom Driving Demand for Ultra-Smooth Subfloors
LVT producers require FF 50 or higher substrate flatness to prevent surface telegraphing, a standard that traditional sand-cement screeds seldom match[2].ASTM International, “Standard Practice F710,” astm.org Self-leveling underlayments routinely deliver FF 70–100, cancelling secondary grinding and patching. As click-lock LVT planks slim from 5 mm to 3.5 mm, their ability to mask substrate irregularities weakens, intensifying demand for underlayments. U.S. home-improvement retailers reported that 38% of 2025 residential flooring projects included a self-leveling line-item, up from 22% in 2023. Contractors accept the marginal cost because callback avoidance protects already thin renovation margins.
Carbon-Credit Monetization via Low-Alkali CSA Formulations
CSA cements emit 30%–40% less CO₂ than ordinary Portland cement and qualify for carbon-offset credits under Verra’s VM0046 methodology. Holcim piloted a CSA-based underlayment in 2025 that earned 0.15 t-CO₂e credits per cubic meter, monetizable at EUR 80 per ton in the EU Emissions Trading System. These credits neutralize the 15%–20% price premium CSA mixes command, making them cost-competitive for net-zero projects. China’s national carbon market, launched in 2024, is expected to stimulate CSA uptake across Belt and Road infrastructure, where embodied carbon disclosures are mandatory.
Restraint Impact Analysis*
| Restraints | (~) % Impact on CAGR Forecast | Geographic Relevance | Impact Timeline |
|---|---|---|---|
| Installation skill-gap causing performance failures | -0.6% | Global, acute in APAC and MEA emerging markets | Short term (≤ 2 years) |
| Silica-fume supply squeeze from steel EAF transition | -0.4% | North America, EU, select APAC markets | Medium term (2-4 years) |
| Insurance exclusions on slab-moisture failures elevating premiums | -0.3% | North America, EU | Short term (≤ 2 years) |
| Source: Mordor Intelligence | |||
Installation Skill Gap Causing Performance Failures
Industry surveys in 2025 show 28% of pours failed to meet flatness or moisture thresholds, with 68% of failures tied to improper mixing, poor substrate prep, or premature traffic. Only 42% of contractors owned ASTM F2170 humidity test kits despite ACI 302.1R recommendations. The problem is acute in Asia-Pacific, where 1.2 million new construction workers joined in 2024, but fewer than 15,000 completed specialty-flooring certification. Callback rates average 12%, eroding margins by up to 400 basis points. Manufacturers such as MAPEI and LATICRETE run on-site training, yet uptake outside North America and Western Europe is limited.
Silica-Fume Supply Squeeze from Steel EAF Transition
Global silica-fume output fell 9% between 2024 and 2025 as steelmakers pivoted to hydrogen-based direct-reduction, which curtails silicon-alloy by-products. Spot prices jumped from USD 420/ton in early 2024 to USD 580/ton by mid-2025, pressuring formulators’ margins. BASF cut silica-fume content by 18% in its MasterEmaco SLU range through metakaolin substitution and still achieved 4,500 psi at 28 days. Since steel decarbonization favors hydrogen EAFs through 2027, supply tightness is expected to persist.
*Our forecasts treat driver/restraint impacts as directional, not additive. The impact forecasts reflect baseline growth, mix effects, and variable interactions.
Segment Analysis
By Product: Underlayments Dominate, Toppings Gain on Wear Resistance
Underlayments captured 64.62% of 2025 volume, reflecting their central role in leveling substrates beneath resilient flooring, ceramic tile, and carpet. Toppings are forecast to grow 4.38% through 2031, surpassing the underlayment trajectory as renovators prioritize overlays that cure in 24 hours and tolerate heavy traffic. ARDEX’s K 15 underlayment cures to 3,000 psi in 3 hours, a key differentiator for U.S. multifamily builds. MAPEI’s Ultraplan Eco 985 topping reaches 6,500 psi at 28 days and secures LEED v5 low-emitting-material credits.
The self leveling concrete market size for toppings is driven by warehouses and healthcare corridors where forklift and rolling-cart abrasion are constant. Underlayments remain indispensable for radiant-heating slabs and sound-attenuation systems in new housing. The shift toward hybrid work has softened office renovation, yet data centers and hospitals compensate; hospital flooring upgrades rose 14% year-over-year in 2025.


By End-Use Sector: Residential Leads, Infrastructure Accelerates
Residential projects consumed 39.72% of 2025 volume thanks to the LVT boom and USD 485 billion U.S. renovation spend. The infrastructure segment is growing at a 4.22% CAGR to 2031, outpacing all other segments, propelled by airport terminals, metro stations, and intermodal hubs with laser-screed LL tolerance. The self leveling concrete market share for infrastructure is projected to climb steadily as India’s National Infrastructure Pipeline channels USD 1.4 trillion into rail and urban transit.
Commercial buildings accounted for a significant market share in 2025, while industrial and institutional projects are witnessing a significant rise in demand. Nearshoring drove 85 million ft² of new Mexican warehouses in 2024–2025, all demanding FF 70 floors. Hyperscale data-center builds added 1,200 MW of global capacity in 2025, often relying on self-leveling underlayments beneath raised floors.
Geography Analysis
Asia-Pacific’s 38.45% 2025 share and 4.29% forecast growth underscore the region’s twin status as the largest construction market and fastest-growing economy. China’s Belt and Road Initiative financed USD 140 billion of infrastructure in 2024–2025, with railway stations and port aprons demanding durable self-leveling toppings. India’s USD 1.4 trillion National Infrastructure Pipeline drives metro builds where platform surfaces must meet ADA-grade accessibility, reinforcing self leveling concrete market adoption. ASEAN added 320 million ft² of industrial warehouse capacity in 2025 for e-commerce fulfillment, specifying FF 70 tolerances. While skill shortages pose near-term execution risk, manufacturers are partnering with vocational institutes to accelerate applicator certification.
North America’s market growth is anchored by fulfillment-center and residential-renovation demand. Amazon’s 15 new U.S. facilities each required 40,000–60,000 m³ of toppings to meet 90-day readiness goals. The FAA’s USD 3.18 billion Airport Infrastructure Grants in fiscal 2025 earmark significant funding for terminal-floor upgrades that comply with ACI 302.1R. Canada’s CAD 180 billion Investing in Canada Plan boosts transit-station renovations, while Mexico’s near-shoring boom accelerates warehouse builds.
European market growth is steered by stringent green-building codes. The EU’s 2025 Ecodesign extension to flooring enforces VOC and embodied-carbon disclosure, steering specifications toward CSA-based mixes. Germany committed EUR 12 billion to energy-efficient retrofits in 2025, many involving radiant-heating slabs over self-leveling underlayments. France’s low-carbon strategy channels incentives to CSA compounds that generate Verra credits. The United Kingdom logged a 5.2% rise in residential renovations in 2025 despite labor shortages.

Competitive Landscape
The self leveling concrete market is moderately consolidated. Vertical integration provides cost and service advantages; BASF manufactures in-house polymer modifiers, while Sika’s 2024 purchase of MBCC broadened its admixture suite. MAPEI leads in rapid-set technology, evidenced by Ultraplan Eco 985 curing to 3,000 psi in 4 hours. Holcim’s ECOPlanet SLU capitalizes on carbon-credit monetization, signaling sustainability as a competitive wedge.
Regional specialists extract share through niche innovation. ARDEX’s K 15, foot-traffic-ready in 3 hours, is popular in U.S. multifamily projects. LATICRETE positions on occupied-space renovations with low-odor, rapid-dry toppings. Technology partners such as Somero and LIGCHINE provide laser-screed robotics that integrate seamlessly with digital-twin platforms, reducing rework and material waste. Compliance with EPA Safer Choice and ISO 16000-9 VOC standards is now a procurement prerequisite, favoring producers that deploy bio-based rheology modifiers. White-space remains in ultra-fast curing toppings for high-traffic retail, moisture-mitigating primers that negate extended drying cycles, and integrated quality-assurance software that flags FF/FL deviations in real time.
Self Leveling Concrete Industry Leaders
ARDEX Group
HOLCIM
MAPEI S.p.A.
Saint-Gobain
Sika AG
- *Disclaimer: Major Players sorted in no particular order

Recent Industry Developments
- January 2026: Sika AG expanded its Sikafloor range with a CSA-based underlayment designed to earn Verra VM0046 carbon credits, targeting EU and North American net-zero projects.
- December 2025: BASF completed a USD 45 million expansion in Trostberg, Germany, adding 120,000 tons/year of bio-based self-leveling capacity.


Global Self Leveling Concrete Market Report Scope
Self-leveling concrete is a polymer-modified cement designed to create a smooth, durable, and level surface, commonly used as a preparatory layer for floor coverings.
The self-leveling concrete market is segmented by product, end-use sector, and geography. By product, the market is segmented into topping and underlayment. By end-use sector, the market is segmented into commercial, industrial and institutional, infrastructure, and residential. The report also covers the market size and forecasts for the self leveling concrete market in 17 countries across major regions. For each segment, the market sizing and forecasts have been done based on volume (cubic meters).
| Topping |
| Underlayment |
| Commercial |
| Industrial and Institutional |
| Infrastructure |
| Residential |
| Asia-Pacific | China |
| India | |
| South Korea | |
| Japan | |
| ASEAN Countries | |
| Rest of Asia-Pacific | |
| North America | United States |
| Canada | |
| Mexico | |
| Europe | France |
| Germany | |
| Italy | |
| Russia | |
| Spain | |
| United Kingdom | |
| Rest of Europe | |
| South America | Brazil |
| Argentina | |
| Rest of South America | |
| Middle-East and Africa | Saudi Arabia |
| South Africa | |
| Rest of Middle-East and Africa |
| By Product | Topping | |
| Underlayment | ||
| By End Use Sector | Commercial | |
| Industrial and Institutional | ||
| Infrastructure | ||
| Residential | ||
| By Geography | Asia-Pacific | China |
| India | ||
| South Korea | ||
| Japan | ||
| ASEAN Countries | ||
| Rest of Asia-Pacific | ||
| North America | United States | |
| Canada | ||
| Mexico | ||
| Europe | France | |
| Germany | ||
| Italy | ||
| Russia | ||
| Spain | ||
| United Kingdom | ||
| Rest of Europe | ||
| South America | Brazil | |
| Argentina | ||
| Rest of South America | ||
| Middle-East and Africa | Saudi Arabia | |
| South Africa | ||
| Rest of Middle-East and Africa | ||


Market Definition
- END-USE SECTOR - Self-leveling concrete consumed in the construction sectors such as commercial, residential, industrial, institutional, and infrastructure are considered under the scope of the study.
- PRODUCT/APPLICATION - Under the scope of the study, the consumption of self-leveling concrete including underlayment and toppings is considered.
| Keyword | Definition |
|---|---|
| Accelerator | Accelerators are admixtures used to fasten the setting time of concrete by increasing the initial rate and speeding up the chemical reaction between cement and the mixing water. These are used to harden and increase the strength of concrete quickly. |
| Acrylic | This synthetic resin is a derivative of acrylic acid. It forms a smooth surface and is mainly used for various indoor applications. The material can also be used for outdoor applications with a special formulation. |
| Adhesives | Adhesives are bonding agents used to join materials by gluing. Adhesives can be used in construction for many applications, such as carpet laying, ceramic tiles, countertop lamination, etc. |
| Air Entraining Admixture | Air-entraining admixtures are used to improve the performance and durability of concrete. Once added, they create uniformly distributed small air bubbles to impart enhanced properties to the fresh and hardened concrete. |
| Alkyd | Alkyds are used in solvent-based paints such as construction and automotive paints, traffic paints, flooring resins, protective coatings for concrete, etc. Alkyd resins are formed by the reaction of an oil (fatty acid), a polyunsaturated alcohol (Polyol), and a polyunsaturated acid or anhydride. |
| Anchors and Grouts | Anchors and grouts are construction chemicals that stabilize and improve the strength and durability of foundations and structures like buildings, bridges, dams, etc. |
| Cementitious Fixing | Cementitious fixing is a process in which a cement-based grout is pumped under pressure to fill forms, voids, and cracks. It can be used in several settings, including bridges, marine applications, dams, and rock anchors. |
| Commercial Construction | Commercial construction comprises new construction of warehouses, malls, shops, offices, hotels, restaurants, cinemas, theatres, etc. |
| Concrete Admixtures | Concrete admixtures comprise water reducers, air entrainers, retarders, accelerators, superplasticizers, etc., added to concrete before or during mixing to modify its properties. |
| Concrete Protective Coatings | To provide specific protection, such as anti-carbonation or chemical resistance, a film-forming protective coat can be applied on the surface. Depending on the applications, different resins like epoxy, polyurethane, and acrylic can be used for concrete protective coatings. |
| Curing Compounds | Curing compounds are used to cure the surface of concrete structures, including columns, beams, slabs, and others. These curing compounds keep the moisture inside the concrete to give maximum strength and durability. |
| Epoxy | Epoxy is known for its strong adhesive qualities, making it a versatile product in many industries. It resists heat and chemical applications, making it an ideal product for anyone needing a stronghold under pressure. It is widely used in adhesives, electrical and electronics, paints, etc. |
| Fiber Wrapping Systems | Fiber Wrapping Systems are a part of construction repair and rehabilitation chemicals. It involves the strengthening of existing structures by wrapping structural members like beams and columns with glass or carbon fiber sheets. |
| Flooring Resins | Flooring resins are synthetic materials applied to floors to enhance their appearance, increase their resistance to wear and tear or provide protection from chemicals, moisture, and stains. Depending on the desired properties and the specific application, flooring resins are available in distinct types, such as epoxy, polyurethane, and acrylic. |
| High-Range Water Reducer (Super Plasticizer) | High-range water reducers are a type of concrete admixture that provides enhanced and improved properties when added to concrete. These are also called superplasticizers and are used to decrease the water-to-cement ratio in concrete. |
| Hot Melt Adhesives | Hot-melt adhesives are thermoplastic bonding materials applied as melts that achieve a solid state and resultant strength on cooling. They are commonly used for packaging, coatings, sanitary products, and tapes. |
| Industrial and Institutional Construction | Industrial and institutional construction includes new construction of hospitals, schools, manufacturing units, energy and power plants, etc. |
| Infrastructure Construction | Infrastructure construction includes new construction of railways, roads, seaways, airports, bridges, highways, etc. |
| Injection Grouting | The process of injecting grout into open joints, cracks, voids, or honeycombs in concrete or masonry structural members is known as injection grouting. It offers several benefits, such as strengthening a structure and preventing water infiltration. |
| Liquid-Applied Waterproofing Membranes | Liquid-Applied membrane is a monolithic, fully bonded, liquid-based coating suitable for many waterproofing applications. The coating cures to form a rubber-like elastomeric waterproof membrane and may be applied over many substrates, including asphalt, bitumen, and concrete. |
| Micro-concrete Mortars | Micro-concrete mortar is made up of cement, water-based resin, additives, mineral pigments, and polymers and can be applied on both horizontal and vertical surfaces. It can be used to refurbish residential complexes, commercial spaces, etc. |
| Modified Mortars | Modified Mortars include Portland cement and sand along with latex/polymer additives. The additives increase adhesion, strength, and shock resistance while also reducing water absorption. |
| Mold Release Agents | Mold release agents are sprayed or coated on the surface of molds to prevent a substrate from bonding to a molding surface. Several types of mold release agents, including silicone, lubricant, wax, fluorocarbons, and others, are used based on the type of substrates, including metals, steel, wood, rubber, plastic, and others. |
| Polyaspartic | Polyaspartic is a subset of polyurea. Polyaspartic floor coatings are typically two-part systems that consist of a resin and a catalyst to ease the curing process. It offers high durability and can withstand harsh environments. |
| Polyurethane | Polyurethane is a plastic material that exists in various forms. It can be tailored to be either rigid or flexible and is the material of choice for a broad range of end-user applications, such as adhesives, coatings, building insulation, etc. |
| Reactive Adhesives | A reactive adhesive is made of monomers that react in the adhesive curing process and do not evaporate from the film during use. Instead, these volatile components become chemically incorporated into the adhesive. |
| Rebar Protectors | In concrete structures, rebar is one of the important components, and its deterioration due to corrosion is a major issue that affects the safety, durability, and life span of buildings and structures. For this reason, rebar protectors are used to protect against degrading effects, especially in infrastructure and industrial construction. |
| Repair and Rehabilitation Chemicals | Repair and Rehabilitation Chemicals include repair mortars, injection grouting materials, fiber wrapping systems, micro-concrete mortars, etc., used to repair and restore existing buildings and structures. |
| Residential Construction | Residential construction involves constructing new houses or spaces like condominiums, villas, and landed homes. |
| Resin Fixing | The process of using resins like epoxy and polyurethane for grouting applications is called resin fixing. Resin fixing offers several advantages, such as high compressive and tensile strength, negligible shrinkage, and greater chemical resistance compared to cementitious fixing. |
| Retarder | Retarders are admixtures used to slow down the setting time of concrete. These are usually added with a dosage rate of around 0.2% -0.6% by weight of cement. These admixtures slow down hydration or lower the rate at which water penetrates the cement particles by making concrete workable for a long time. |
| Sealants | A sealant is a viscous material that has little or no flow qualities, which causes it to remain on surfaces where they are applied. Sealants can also be thinner, enabling penetration to a certain substance through capillary action. |
| Sheet Waterproofing Membranes | Sheet membrane systems are reliable and durable thermoplastic waterproofing solutions that are used for waterproofing applications even in the most demanding below-ground structures, including those exposed to highly aggressive ground conditions and stress. |
| Shrinkage Reducing Admixture | Shrinkage-reducing admixtures are used to reduce concrete shrinkage, whether from drying or self-desiccation. |
| Silicone | Silicone is a polymer that contains silicon combined with carbon, hydrogen, oxygen, and, in some cases, other elements. It is an inert synthetic compound that comes in various forms, such as oil, rubber, and resin. Due to its heat-resistant properties, it finds applications in sealants, adhesives, lubricants, etc. |
| Solvent-borne Adhesives | Solvent-borne adhesives are mixtures of solvents and thermoplastic or slightly cross-linked polymers such as polychloroprene, polyurethane, acrylic, silicone, and natural and synthetic rubbers. |
| Surface Treatment Chemicals | Surface treatment chemicals are chemicals used to treat concrete surfaces, including roofs, vertical surfaces, and others. They act as curing compounds, demolding agents, rust removers, and others. They are cost-effective and can be used on roadways, pavements, parking lots, and others. |
| Viscosity Modifier | Viscosity Modifiers are concrete admixtures used to change various properties of admixtures, including viscosity, workability, cohesiveness, and others. These are usually added with a dosage of around 0.01% to 0.1% by weight of cement. |
| Water Reducer | Water reducers, also called plasticizers, are a type of admixture used to decrease the water-to-cement ratio in the concrete, thereby increasing the durability and strength of concrete. Various water reducers include refined lignosulfonates, gluconates, hydroxycarboxylic acids, sugar acids, and others. |
| Water-borne Adhesives | Water-borne adhesives use water as a carrier or diluting medium to disperse resin. They are set by allowing the water to evaporate or be absorbed by the substrate. These adhesives are compounded with water as a dilutant rather than a volatile organic solvent. |
| Waterproofing Chemicals | Waterproofing chemicals are designed to protect a surface from the perils of leakage. A waterproofing chemical is a protective coating or primer applied to a structure's roof, retaining walls, or basement. |
| Waterproofing Membranes | Waterproofing membranes are liquid-applied or self-adhering layers of water-tight materials that prevent water from penetrating or damaging a structure when applied to roofs, walls, foundations, basements, bathrooms, and other areas exposed to moisture or water. |


Research Methodology
Mordor Intelligence follows a four-step methodology in all our reports.
- Step-1: Identify Key Variables: The quantifiable key variables (industry and extraneous) pertaining to the specific product segment and country are selected from a group of relevant variables & factors based on desk research & literature review; along with primary expert inputs. These variables are further confirmed through regression modeling (wherever required).
- Step-2: Build a Market Model: In order to build a robust forecasting methodology, the variables and factors identified in Step-1 are tested against available historical market numbers. Through an iterative process, the variables required for market forecast are set and the model is built on the basis of these variables.
- Step-3: Validate and Finalize: In this important step, all market numbers, variables and analyst calls are validated through an extensive network of primary research experts from the market studied. The respondents are selected across levels and functions to generate a holistic picture of the market studied.
- Step-4: Research Outputs: Syndicated Reports, Custom Consulting Assignments, Databases & Subscription Platforms


