
Saudi Arabia Real Estate Market Analysis by Mordor Intelligence
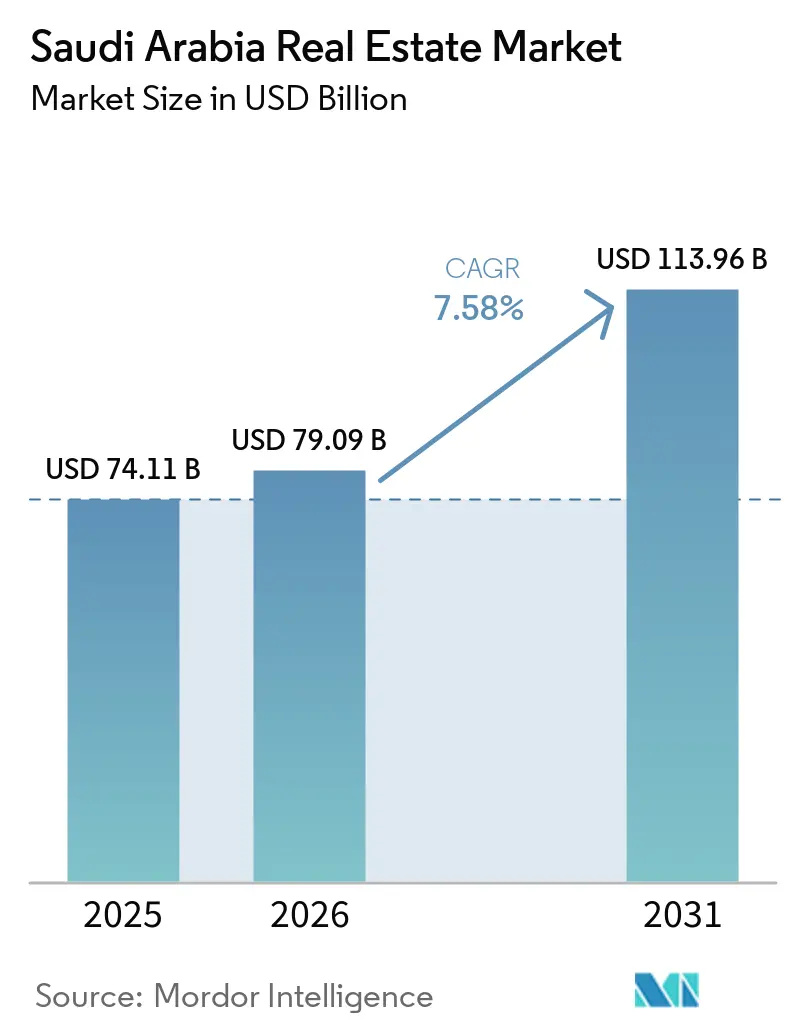
The Saudi Arabia real estate market size was valued at USD 79.09 billion in 2026 and estimated to grow from USD 85.09 billion in 2027 to reach USD 120.1 billion by 2032, at a CAGR of 7.14% during the forecast period (2027-2032).
Saudi Arabia’s housing needs and funded destination development support demand for ready-to-occupy homes and mixed-use properties, while corporate office upgrades add another source of activity. Developers can respond by linking delivery plans with occupier requirements, turning financed projects into assets that can be sold or leased. Construction costs and execution constraints can delay handovers and extend the period before property income begins. That cost pressure favors matching office specifications to corporate upgrade needs, because additional development spending must earn enough in achievable rents to justify the investment.
Key Report Takeaways
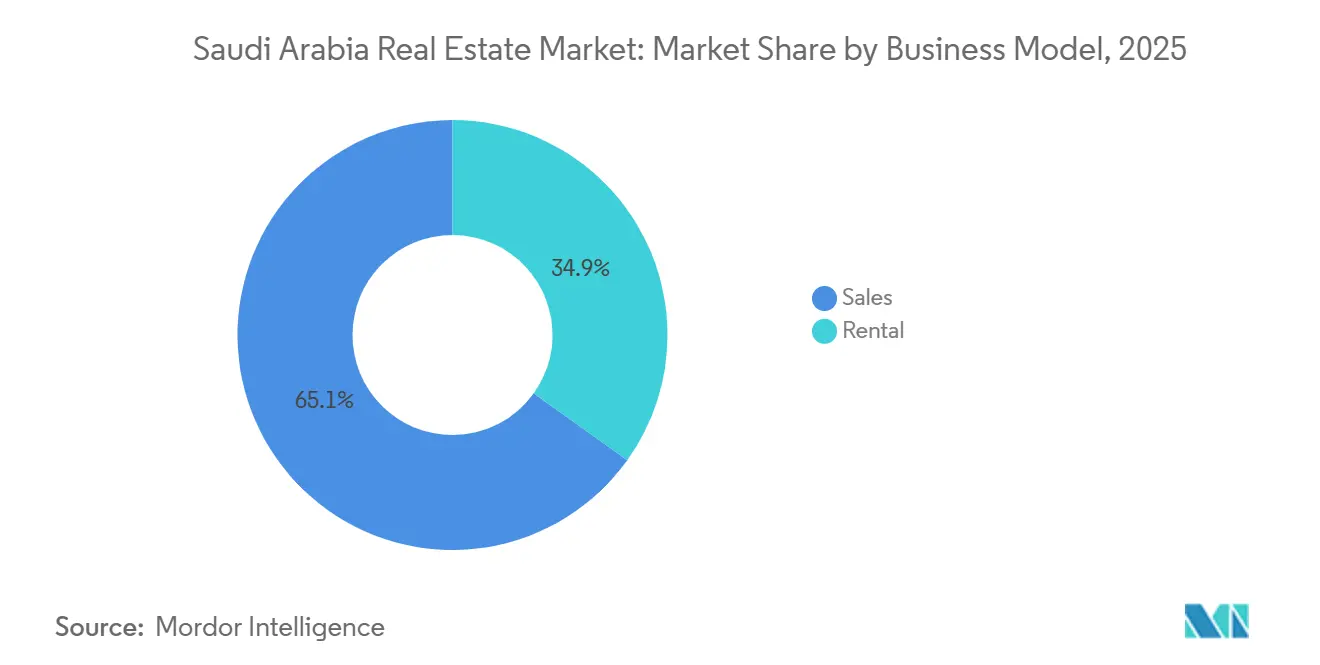
- By business model, sales held a 65% Saudi Arabia real estate market share in 2026, while rental is projected to be the fastest-growing segment, with a 7.45% CAGR during 2027-2032.
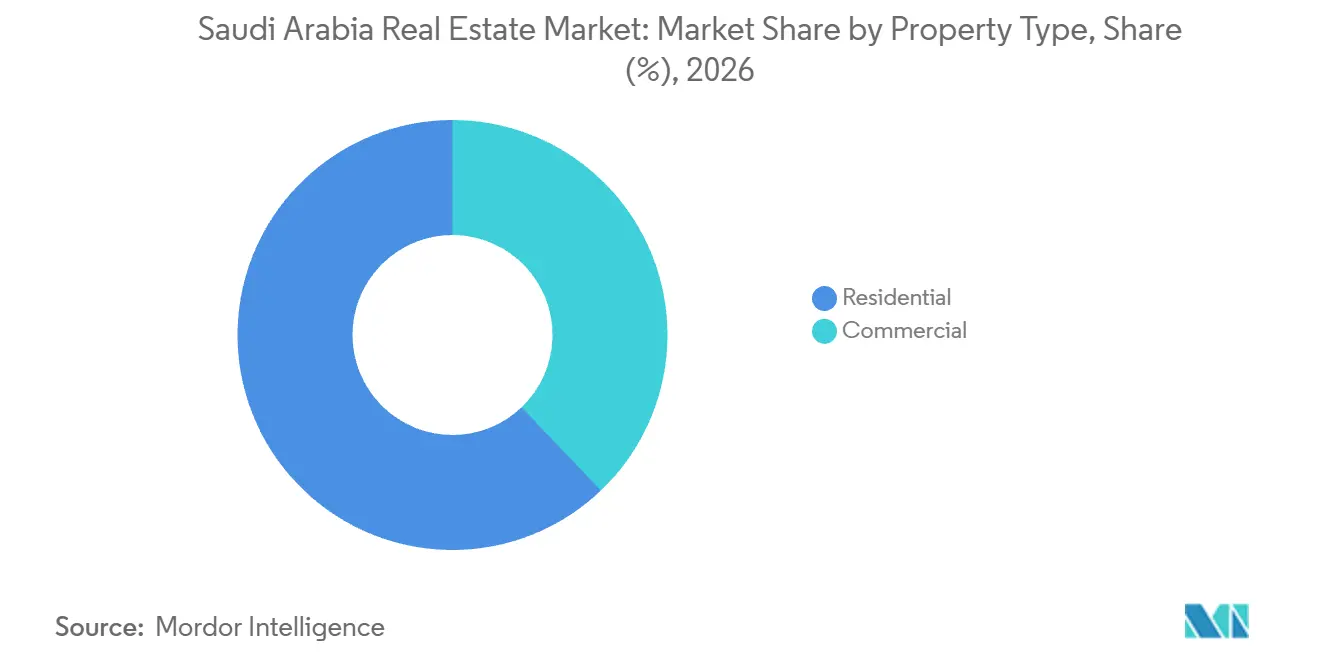
- Within property types, residential accounted for a 62.13% share of the Saudi Arabia real estate market size in 2026, and commercial is the fastest-growing segment, with a projected CAGR of 7.62% during 2027-2032.
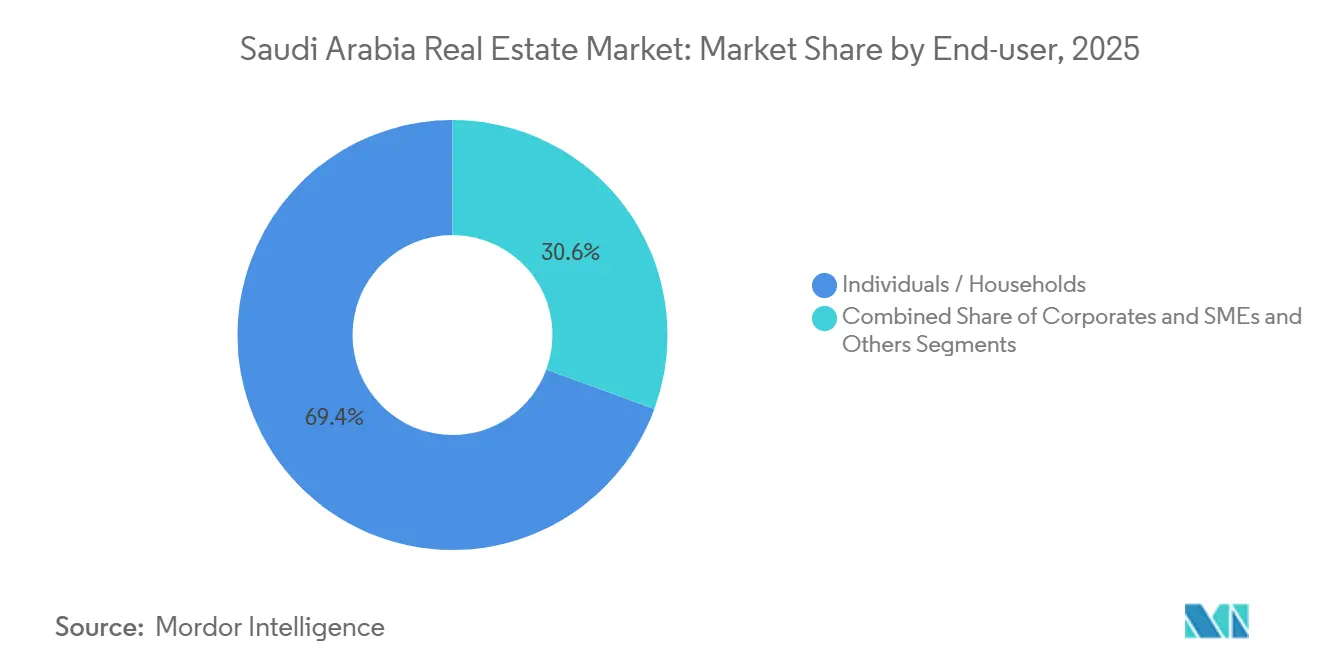
- Among end users, individuals and households led with a 69.3% share in 2026, with corporates and SMEs projected to grow fastest at a CAGR of 7.62% during 2027-2032.
- Across geographies, Riyadh led with a 41.39% share in 2026, whereas the Dammam Metropolitan Area is projected to grow fastest at a CAGR of 8.05% during 2027-2032.
Note: Market numbers in this report are based on Mordor Intelligence's proprietary estimation framework, which combines nine months of actuals with Q4 projections for base year 2026.
Market Trends and Insights
Drivers Impact Analysis of Saudi Arabia Real Estate Market*
| Driver | (~) % Impact on CAGR Forecast | Geographic Relevance | Impact Timeline |
|---|---|---|---|
| Vision 2030 giga/mega-projects (NEOM, Red Sea, Diriyah) creating multi-year pipelines across residential, hospitality, retail, and offices. | +3% | AMAALA project area | Long term (≥ 4 years) |
| Population growth and household formation—plus expat inflows—supporting housing (incl. mid-market/BTR) and community retail. | +2.5% | Nationwide | Long term (≥ 4 years) |
| Tourism surge and entertainment investments lifting demand for hotels, branded residences, and mixed-use destinations. | +2% | Nationwide | Medium term (2-4 years) |
| Industrial/logistics expansion (manufacturing, e-commerce, SEZs) boosting demand for warehouses, light industrial, and data centers. | +1.8% | Nationwide | Medium term (2-4 years) |
| Regulatory and capital-market maturation (REITs, PPPs, new planning frameworks) improving transparency and investment access. | +1.2% | Nationwide | Medium term (2-4 years) |
| Source: Mordor Intelligence | |||
Vision 2030 giga/mega-projects (NEOM, Red Sea, Diriyah) creating multi-year pipelines across residential, hospitality, retail, and offices.
Destination financing can expand the supply of hospitality property available for operation, creating an income route beyond individual asset sales. Red Sea Global secured a SAR 6.5 billion (USD 1.73 billion) credit facility to develop AMAALA in Saudi Arabia in October 2025.[1] Development capital gives the borrower a means to advance accommodation supply before seeking income from completed property. Rosewood opened AMAALA, its resort at Triple Bay on Saudi Arabia’s northwestern Red Sea coast, in August 2026. The operating route links the destination’s property pipeline to visitor stays, giving hospitality operators a commercial role alongside the developer.
Population growth and household formation—plus expat inflows—supporting housing (incl. mid-market/BTR) and community retail.
Housing demand depends on both the number of occupied dwellings and the accommodation those households require. The General Authority for Statistics (GASTAT) counted 4.5 million dwellings occupied by Saudi households in its 2025 housing statistics, up 118,000, or 2.7%, from 2024. Its 2025 housing data also reported an average of 4.8 members per Saudi household. For residential developers, these measures answer different questions about the potential customer base. The increase supports additional housing demand, while household size makes usable family space relevant to product design. A unit mix designed around Saudi family accommodation gives developers a way to compete for housing demand beyond increasing the number of dwellings.
Tourism surge and entertainment investments lifting demand for hotels, branded residences, and mixed-use destinations.
Tourism’s property opportunity depends on accommodation use as well as visitor numbers. Saudi Arabia recorded approximately 123 million domestic and inbound tourists in 2025, up about 6% from 2024. Domestic tourists recorded 564 million overnight stays across accommodation types in Saudi Arabia in 2025, up 4.7% from 2024. These figures support evaluating domestic travel as a demand base in its own right when designing hotel and mixed-use destinations. Converting domestic overnight travel into paid stays links the growing visitor base to income-producing hospitality space for destination developers.
Industrial/logistics expansion (manufacturing, e-commerce, SEZs) boosting demand for warehouses, light industrial, and data centers.
Industrial expansion creates property demand through production space as well as the movement and storage of goods. The Saudi Authority for Industrial Cities and Technology Zones (MODON) reported 9,557 industrial, logistics, and investment facilities within its industrial cities in 2025, marking 11% growth. It also reported 16% growth in industrial investments during 2025, driven by new production projects and expansions in factories and ready-built units, which reached 2,244 units. This combination broadens the potential occupier base beyond individual large factories. For developers, ready-built space offers a way to address that base without making every scheme dependent on a single bespoke plant.
Restraints Impact Analysis of Saudi Arabia Real Estate Market*
| Restraint | (~) % Impact on CAGR Forecast | Geographic Relevance | Impact Timeline |
|---|---|---|---|
| Execution capacity limits and skilled-labor shortages amid concurrent mega programs. | -1.5% | Nationwide | Medium term (2-4 years) |
| Higher construction costs and financing expenses compressing developer feasibility and contractor margins. | -1.2% | Nationwide | Short term (≤ 2 years) |
| Land, permitting, and utility tie-in complexities extending timelines—especially in coastal/heritage and environmentally sensitive zones. | -0.7% | Nationwide | Medium term (2-4 years) |
| Source: Mordor Intelligence | |||
Execution capacity limits and skilled-labor shortages amid concurrent mega programs.
Execution constraints can separate a financed project from an asset ready to earn income. Turner & Townsend reported skilled-labor shortages among Saudi construction clients in 2025 and linked them to project delays and budget overruns. Such slippage can defer rental commencement or property handover, extending the period before developers realize asset income. In November 2025, Saudi Arabia’s Ministry of Municipalities and Housing and Alfanar Building Systems agreed to train Saudi scholarship recipients for modern building-systems work, with Alfanar committing to post-training employment contracts. For a developer exposed to those shortages, delayed handover can reduce project returns through both a longer wait for income and a larger construction bill.
Higher construction costs and financing expenses compressing developer feasibility and contractor margins.
Higher material costs can weaken feasibility even when buyer interest supports a project. In its 2025 report, Turner & Townsend said steel and cement prices in Saudi Arabia had risen by 5% to 10% since 2023, putting pressure on the construction sector. For a developer holding the selling price steady, this reduces the amount available to cover other expenses and earn a return. A contractor absorbing the same increase faces a smaller allowance for execution risk under an unchanged contract price. When selling prices cannot absorb the input increase, starting another phase commits the developer to thinner returns or a longer wait to recover its costs.
*Our forecasts treat driver/restraint impacts as directional, not additive. The impact forecasts reflect baseline growth, mix effects, and variable interactions.
Saudi Arabia Real Estate Market Segment Analysis
By Business Model:
Sales Scale and Recurring Rental ActivitySales accounted for a 65% share of the Saudi Arabia real estate market size in 2026. Saudi Arabia recorded 19,911 residential property sale transactions in September 2026. The largest segment therefore has an active residential transaction base alongside its broad position in total property spending. For developers, individual property transfers release capital that can finance later phases of a scheme. A release schedule aligned with completed closings limits the capital tied up between launching homes and recovering sale proceeds.
Rental is the fastest-growing segment, with a projected CAGR of 7.45% during 2027-2032. The Real Estate General Authority (REGA) recorded 857,111 residential rental transactions in Saudi Arabia in Q1 2026, up 21.5% from Q1 2025.[2] It also recorded 284,016 commercial rental transactions in the same quarter, up 13.2% from Q1 2025. Both occupier pools expanded in transaction count, with housing generating the larger volume and the greater year-over-year increase.

By Property Type:
Delivered Housing and Office Pricing Support ValueResidential represented a 62.13% Saudi Arabia real estate market share in 2026. The National Housing Company (NHC) had delivered 60,000 housing units across its integrated urban destinations in Saudi Arabia through October 2025. This delivery program links individual homes with the coordinated execution of multiple urban destinations. For developers, the distinction between planned units and delivered housing matters because a usable asset can be handed over to buyers or occupiers.
Commercial is the fastest-growing segment, with a projected CAGR of 7.62% during 2027-2032. For the Grade A office stock measured in Riyadh, rents increased 3.4% year over year in Q2 2026. The movement provides a location-specific pricing reference for prospective office projects, alongside the segment’s broader development opportunity. For a developer, an attainable rent helps determine the income a building could support once it is leased. A higher rent on this measured stock can support a more costly office specification, provided the additional development expense does not absorb the income gain.
By End-user:
Household Access and Corporate Upgrades Shape DemandIndividuals and households formed the largest segment, holding a 69.3% share in 2026. The Ministry of Municipalities and Housing reported that 63,076 Saudi families moved into their first home in the first half of 2026. It also reported that 48,631 Saudi families benefited from housing-support services during that period. The counts describe different housing milestones, linking assistance services and actual first-home occupation to the household segment.
Corporates and SMEs are the fastest-growing segment, with a projected CAGR of 7.62% during 2027-2032. In Q2 2026, corporates in Riyadh and Jeddah expanded and upgraded office space as part of broader business growth strategies, JLL reported. This links property demand to both additional operating capacity and a reconfiguration of business premises. An expansion need can require additional floor area, whereas an upgrade calls for a different specification of business premises. Leasing proposals built around the occupier’s intended use would address both needs more directly than an offer based on floor area alone.
Geography Analysis
Riyadh Real Estate Market
Riyadh, the largest geography, held a 41.39% Saudi Arabia real estate market share in 2026. The city recorded 10,667 residential transactions in Q2 2026, 2% below Q2 2025 but 23% above Q1 2026.[3] This substantial residential trading base gives developers access to an active local transaction pool, while the annual and consecutive-quarter comparisons highlight how the assessment of activity depends on its time frame. The city’s scale can support development at volume, with the timing of a new release remaining commercially important when short-term momentum differs across the comparison periods used to assess local demand.
DMA (Dammam Metropolitan Area) Real Estate Market
The Dammam Metropolitan Area is the fastest-growing geography, with a projected CAGR of 8.05% during 2027-2032. Knight Frank recorded 3,896 residential property transactions in the Dammam Metropolitan Area in Q2 2026, up 21% year over year. Sakani, the Ministry of Municipalities and Housing’s housing program, completed handover of 728 townhouses in the Mad residential project in Dammam’s Al Fursan neighborhood on June 8, 2026. These measures describe different stages of residential activity, from property transactions to the delivery of completed townhouses.
Across Q4 2023-Q3 2026, REGA’s city indicators identified apartments as Jeddah’s most active property type in real estate sales. Apartment-focused developers can use that activity mix to shape unit formats and sales channels around a local product category. Within the Rest of Saudi Arabia, NHC announced on August 25, 2025, that sales began for its Shams residential project west of Madinah, with access to 4 main roads and proximity to the Prophet’s Mosque. The Madinah example connects new residential selling to road access and an established urban destination.
Regulatory Framework and Outlook
Selected jurisdictions are compared from the perspective of property owners selling or leasing through licensed real estate service providers. Saudi Arabia requires a REGA license for brokerage and covered real estate services. The ratings assess commercial flexibility over the next 2 years, examining Riyadh’s local rental provisions alongside national transaction and ownership requirements.
Regulatory Table of Saudi Arabia Real Estate Market
| Decision factor | Saudi Arabia | Riyadh |
|---|---|---|
| Primary authority | Real Estate General Authority | Real Estate General Authority |
| Key instruments or direction | Real Estate Brokerage Law; non-Saudi ownership zone, rights, and duration parameters | 5-year rent-increase suspension from September 25, 2025, within urban boundaries, subject to specified provisions |
| Commercial effect | Licensed brokerage and covered services; location and rights controls shape eligible ownership transactions | Limits rent increases for covered residential and commercial leases |
| Current policy attractiveness | Medium | Low |
| Future direction of policy attractiveness | No change | No change |
| Source: Mordor Intelligence | ||
National Medium attractiveness balances licensed services and ownership controls, with REGA reporting Cabinet approval of ownership zones and executive regulations on June 23, 2026. Within the framework effective January 22, 2026, those implementing rules preserve controlled buyer access, supporting No change in owners’ commercial flexibility over 2 years. Riyadh’s Low rating reflects the restriction on rent increases for existing and new residential and commercial leases within urban boundaries, with prior-contract rules for previously leased vacant properties and specified exceptions. The 5-year term that began September 25, 2025, supports No change over the 2-year horizon, while its stated duration sets September 2030 as a separate longer-term milestone.
Value Chain Stages
The value chain compares development, construction, and property management through the capabilities and earnings associated with each stage. On March 16, 2025, Retal Urban Development Company signed a contract with its 80%-owned Building Construction Company subsidiary to construct 371 residential units and infrastructure works in Riyadh. Because the contract bundles homes with project infrastructure, the developer and its subsidiary contractor must coordinate both scopes before residential handover.
Value Chain Analysis Table of Saudi Arabia Real Estate Market
| Primary activity | Key participants | Value capture | Bottleneck | Resilience response |
|---|---|---|---|---|
| Property development | Property developers such as Al Saedan Real Estate Co. | Proceeds from developed-property sales | Site and use decisions commit the office and retail mix | Test occupier requirements before fixing the development mix |
| Construction and infrastructure delivery | Construction contractors such as Building Construction Company, a Retal Urban Development Company subsidiary | Construction contract revenue | Coordination of residential and infrastructure work packages | Link building and infrastructure milestones in the delivery schedule |
| Leasing and property management | Institutional property managers and leasing providers such as Sustainable Property Company | Property-management and leasing-service fees | Keeping lease administration aligned with asset operations | Define leasing, management, and reporting responsibilities together |
| Source: Mordor Intelligence | ||||
Sustainable Property Company provides institutional property management and leasing services in Saudi Arabia. That specialization adds a service-earnings layer after physical delivery, with the handover of asset responsibilities connecting construction activity to ongoing management. Delivery contracts and management mandates with aligned responsibilities can reduce the break between construction handover and ongoing property operation. As developed portfolios become operating assets, the opportunity for suppliers extends into managing the property’s continuing use.
Competitive Landscape
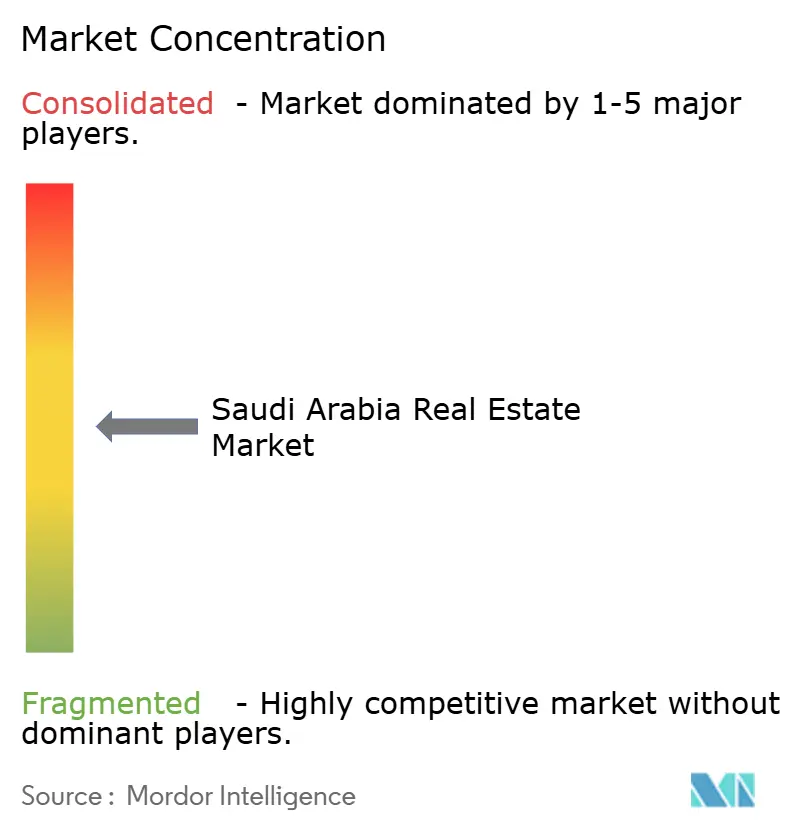
Competition is dispersed across property developers and investment-led project companies, with scale shaped by control of individual assets and development programs. Al Saedan Real Estate Co., Kingdom Holding Company, Dar Al Arkan Real Estate Development, Jabal Omar Development Co., and SEDCO Development are among the established participants. Al Saedan develops commercial and residential properties, while Jabal Omar specializes in large-scale mixed-use development in Makkah. In August 2026, Kingdom Holding Company said Jeddah Tower had reached 106 floors, with more than 300,000 cubic meters of concrete poured and about 6,400 workers at the site. Such project scale requires coordinated delivery capability, creating a barrier for smaller challengers while leaving room for developers focused on more limited sites or asset types.
In September 2025, Dar Al Arkan Real Estate Development completed ownership transfer of a 1-million-square-meter Jeddah land parcel with Kenzi Al Arabiya and other investors. Dar Al Arkan held 80% of the land, acquired by the consortium for SAR 4.46 billion (USD 1.19 billion), including taxes and commissions. Development fieldwork was conditional on regulatory approvals and licenses at the time of the transfer announcement. The consortium structure offers a way to pool capital for a large site while retaining a controlling investor. For prospective buyers, the approval condition means that the capacity to acquire land alone does not establish when a usable property will become available.
In November 2025, Jabal Omar Development Co. agreed with Rotana and Accor on hotel operations across 7 Phase 4 towers in Makkah, assigning 3 to Rotana and 4 to Sofitel. The allocation separates Jabal Omar’s development role from the hotel-management responsibilities assigned to its counterparties. For buyers of hospitality assets, contracted operator roles provide a more specific basis for assessing the accommodation offer than planned tower counts alone. Smaller challengers can offer specialized properties, but competing with a multi-tower destination also requires a credible arrangement for running the hotels. The 2026 opening of the three-tower Rotana Jabal Omar Hotel, with 655 rooms and suites, shows the operator agreements converting into operating accommodation in Makkah.
Saudi Arabia Real Estate Industry Leaders
-
Al Saedan Real Estate Co.
-
Kingdom Holding Company
-
Dar Al Arkan Real Estate Development
-
Jabal Omar Development Co.
-
SEDCO Development
- *Disclaimer: Major Players sorted in no particular order
Saudi Arabia Real Estate Market Companies Covered in this Report
- Al Saedan Real Estate Co.
- Kingdom Holding Company
- Dar Al Arkan Real Estate Development
- Jabal Omar Development Co.
- SEDCO Development
- Ewaan Global Residential
- Emaar Economic City
- Saudi Real Estate Co. (Al Akaria)
- ROSHN (PIF)
- Abdul Latif Jameel Real Estate
- Jenan Real Estate Co.
- Rafal Real Estate Dev.
- Royal Commission for Riyadh City
- CBRE Saudi Arabia
- JLL Saudi Arabia
- Colliers KSA
- Knight Frank Saudi
- Century 21 Saudi Arabia
- Savills KSA
- Coldwell Banker Saudi Arabia
Key Opportunities for Market Participants
These opportunities compare property offers for eligible resident, non-resident, and corporate non-Saudi buyers. Saudi Arabia’s non-Saudi property ownership system took effect on January 22, 2026, allowing eligible residents, non-residents, companies, and entities to apply through REGA’s Saudi Properties portal, subject to geographic and buyer-category restrictions. The commercial distinction is how a seller can match a property proposition to each eligible applicant group within that framework.
Market Opportunities Table of Saudi Arabia Real Estate Market
| Opportunity | Why now | Buyer / lead segment | Recommended play | Main barrier | Likely beneficiaries |
|---|---|---|---|---|---|
| Housing sales to eligible non-Saudi residents | 2026 framework permits resident applications | Eligible resident individuals and households | Match residential offers to the buyer’s permitted location and category | Geographic and buyer-category limits | Residential developers and property sellers |
| Investment-property offers for eligible non-residents | 2026 framework includes non-resident applicants | Eligible non-resident individuals | Present location-specific investment properties with clear ownership requirements | Eligibility depends on the property location and applicant | Owners and sellers of eligible investment properties |
| Commercial premises for eligible foreign companies | 2026 framework includes non-Saudi companies and entities | Eligible corporate property applicants | Develop commercial-property offers around verified corporate eligibility | Legal controls on eligible buyers and designated areas | Commercial property developers and owners |
| Source: Mordor Intelligence | |||||
The central opening is to turn permitted buyer access into property offers that can proceed through the ownership framework. In Makkah and Madinah, ownership is restricted to Saudi companies and Muslim individuals, whether resident inside or outside the Kingdom. These location-specific controls make addressable buyer-property combinations more commercially useful than an undifferentiated foreign-buyer sales campaign.
Recent Industry Developments in Saudi Arabia Real Estate Market
- Aug 2026: Rosewood opened the Rosewood AMAALA resort at Triple Bay on Saudi Arabia’s northwestern Red Sea coast, adding an operating hospitality property to Red Sea Global’s destination.
- Jun 2026: NHC began early occupancy of residential properties at its Al-Makheem destination in Madinah, 8 months ahead of schedule.
- Jun 2026: Sakani completed handover of all 728 townhouses in the Mad residential project in Dammam’s Al Fursan neighborhood on June 8.
Saudi Arabia Real Estate Market Report Scope and Research Methodology
Market Definition and Coverage
The Saudi Arabia real estate market measures annual spending on the sale and rental of land and buildings in Saudi Arabia. It classifies these transactions by residential or commercial use, sale or rental, end-user type, and location within the country.
Scope exclusions: Construction and renovation services, separately sold building materials and other construction inputs, separately charged brokerage, property management and other real estate service fees, mortgage lending and financing, and property transactions outside Saudi Arabia are excluded.
Segments Covered in This Report
- By Business Model
- Sales
- Rental
- By Property Type
- Residential
- Apartments & Condominiums
- Villas & Landed Houses
- Commercial
- Office
- Retail
- Logistics
- Others (industrial, hospitality, etc.)
- Residential
- By End-user
- Individuals / Households
- Corporates & SMEs
- Others
- By Geography
- Riyadh
- Jeddah
- DMA (Dammam Metropolitan Area)
- Rest of Saudi Arabia
Data Sources, Market Sizing, and Validation
Desk Research
Analysts use public indicators to establish transaction activity, prices, housing demand, and property supply, drawing on sources such as the Real Estate General Authority's transaction and rental indicators, its Ejar rental-contract releases, the General Authority for Statistics' real estate price index, and the Real Estate General Authority's real estate brokerage report. Each source describes a different market signal, so sale and rental values are checked alongside property type, location, price movement, housing occupancy, and new supply rather than treated as interchangeable measures.
Company annual reports, Saudi Exchange filings, investor presentations, government project releases, and reputable business reporting add evidence on project timing, operating portfolios, and financial conditions that can affect property transactions. Analysts compare these records with official series to identify overlap, changes in reporting periods, and activity that should remain outside the measured property transaction value. These sources are not exhaustive, and further sources inform collection, validation, and clarification.
Primary Interviews and Surveys
Structured interviews and surveys would include residential and commercial developers, landlords, brokers, property investors, and institutional occupiers based in Saudi Arabia, with CXOs, functional leaders, and managers covering development, leasing, sales, and research roles. Their responses would test how public transaction, rental, pricing, and delivery indicators relate to property-level spending, and would identify gaps in geography, property type, and business model. Analysts would compare these explanations with independent official and company evidence, then document and reconcile any unresolved gaps before using an input in the forecast.
Distribution of primary research fieldwork respondents
| Company type | Respondent position | Region |
|---|---|---|
| Top tier: 31% | CXOs: 20% | |
| Mid tier: 44% | Functional/Unit leaders: 36% | |
| Smaller Players: 25% | Managers: 44% |
Market-Sizing & Forecasting
The top-down estimate values Saudi Arabia property sales and rental payments separately. After sale and rental records are matched to the same year and Saudi geography, analysts combine the two series into the annual USD market value. Core indicators include sale transaction counts and values, documented rental activity and payments, property price movements, household formation and housing occupancy, and announced or completed residential and commercial supply. These show the size, pace, and likely mix of demand. Analysts use multivariate regression to relate those indicators to market value, with scenario analysis for the timing of large development pipelines and changes in financing or execution conditions. Segment shares are built from observed transaction values by residential or commercial use, sale or rental, end-user, and location, with REGA and GASTAT series used to distribute activity where their classifications align. Selective bottom-up checks multiply sampled transaction prices by property sales volumes and pair representative rents with occupied units, then compare those roll-ups with the national estimate. Where those checks do not align, analysts check coverage, period, and classification, then document the gap and bound it using the nearest consistent official series. Analysts would ask Saudi property professionals to check each forecast driver, including likely sale absorption, rental uptake, prices, and delivery timing, before retaining or revising the modeled paths.
Data Validation & Update Cycle
Analysts triangulate the estimate against independent REGA transaction and lease measures, GASTAT price series, housing indicators, company disclosures, and selective property-level roll-ups. They investigate anomalies by checking units, timing, geography, property classification, and one-off transactions, then resolve material variance through a second analyst review and documented source comparison before sign-off. Analysts re-contact relevant respondent types when a reported change conflicts with official indicators, a material project is delayed or rephased, or a key input cannot be reconciled. The model is refreshed annually, reviewed between cycles after material regulatory, financing, or project events, and given a fresh pre-delivery pass using the latest available Saudi Arabia data.
Mordor Intelligence's Saudi Arabia Real Estate Market Sizing Compared With Other Published Estimates
Published estimates can differ in the transactions and products they count and the inputs used to model demand. The Saudi Arabia real estate market measures annual spending on the sale and rental of land and buildings in Saudi Arabia.
Key Gap Drivers include the study's defined coverage and market-specific modeling choices. Core indicators include sale transaction counts and values, documented rental activity and payments, property price movements, household formation and housing occupancy, and announced or completed residential and commercial supply.
Benchmark comparison
| Source | Market Size | Gaps in Research Methodology |
|---|---|---|
| Mordor Intelligence | USD 85.09 B (2027) | |
| Regional Industry Publisher A | USD 94.19 B (2028) | At its 2028 base, this estimate is 10.7% above this report's 2027 value of USD 85.09 B, 1 year earlier. Its forecast point is one year later than the report's current estimate year, allowing for an additional year of market growth. |
| Global Market Research Firm B | USD 247.18 B (2030) | At its 2030 base, this estimate is 190.5% above this report's 2027 value of USD 85.09 B, 3 years earlier. Its 2030 revenue forecast extends three years beyond the report's current estimate year and includes fee-based property services outside property consideration and rent. |
Mordor Intelligence's analysts triangulate the estimate against independent REGA transaction and lease measures, GASTAT price series, housing indicators, company disclosures, and selective property-level roll-ups.
Key Questions Answered in the Report
What is the Saudi Arabia real estate market size and growth outlook?
The size is estimated at USD 85.09 billion in 2027 and projected to reach USD 120.1 billion by 2032, at a CAGR of 7.14% during 2027-2032.
Which forces support property demand in Saudi Arabia?
Housing needs, destination financing, tourism, and industrial expansion support demand. Red Sea Global secured a SAR 6.5 billion (USD 1.73 billion) credit facility for AMAALA development in October 2025.
What is the leading property type in Saudi Arabia?
Residential held a 62.13% share in 2026, while commercial is projected to grow fastest at a CAGR of 7.62% during 2027-2032.
Which companies compete in Saudi property development and investment?
Established participants include Al Saedan Real Estate Co., Kingdom Holding Company, Dar Al Arkan Real Estate Development, Jabal Omar Development Co., and SEDCO Development.
What could delay Saudi real estate project delivery?
Execution bottlenecks and material costs can delay development. Turner & Townsend reported Saudi skilled-labor shortages linked to project delays and budget overruns in 2025.
Which Saudi city leads, and where is property growth fastest?
Riyadh led with a 41.39% share in 2026. The Dammam Metropolitan Area is projected to post the fastest growth, at a CAGR of 8.05% during 2027-2032.