Market Overview
| Study Period | 2021 - 2031 |
|---|---|
| Forecast Data Period | 2026 - 2031 |
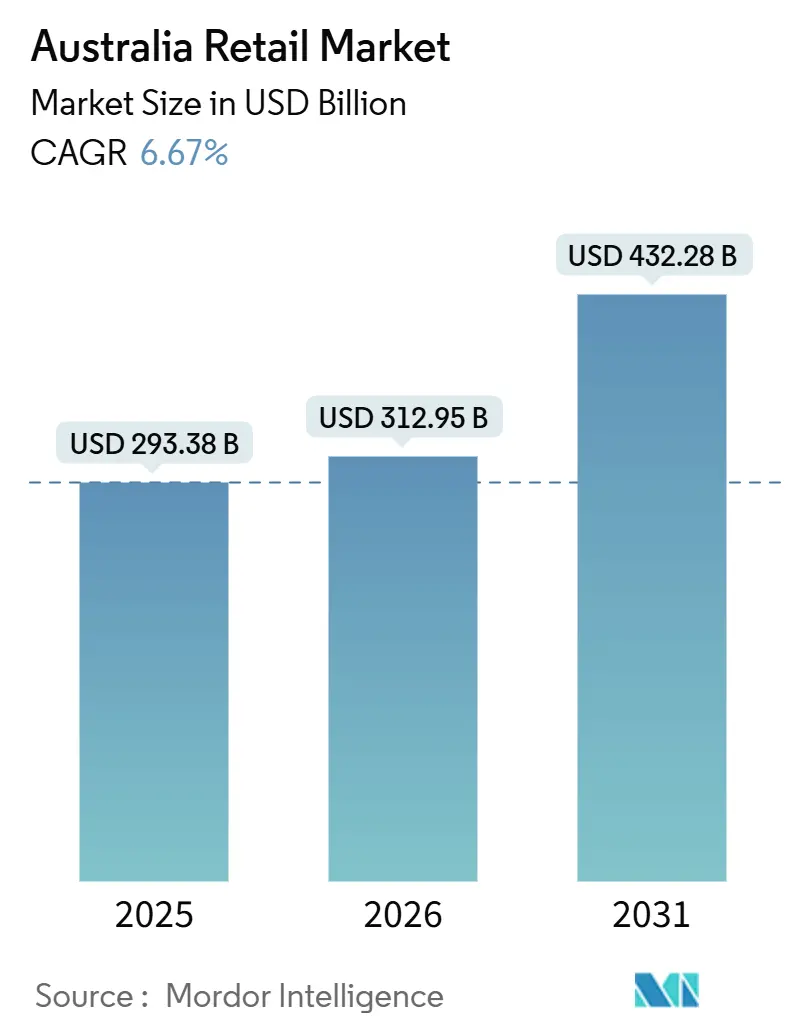
| Base Year Market Size (2025) | USD 293.38 Billion |
| Market Size (2026) | USD 312.95 Billion |
| Market Size (2031) | USD 432.28 Billion |
| Growth Rate (2026 - 2031) | 6.67% CAGR |
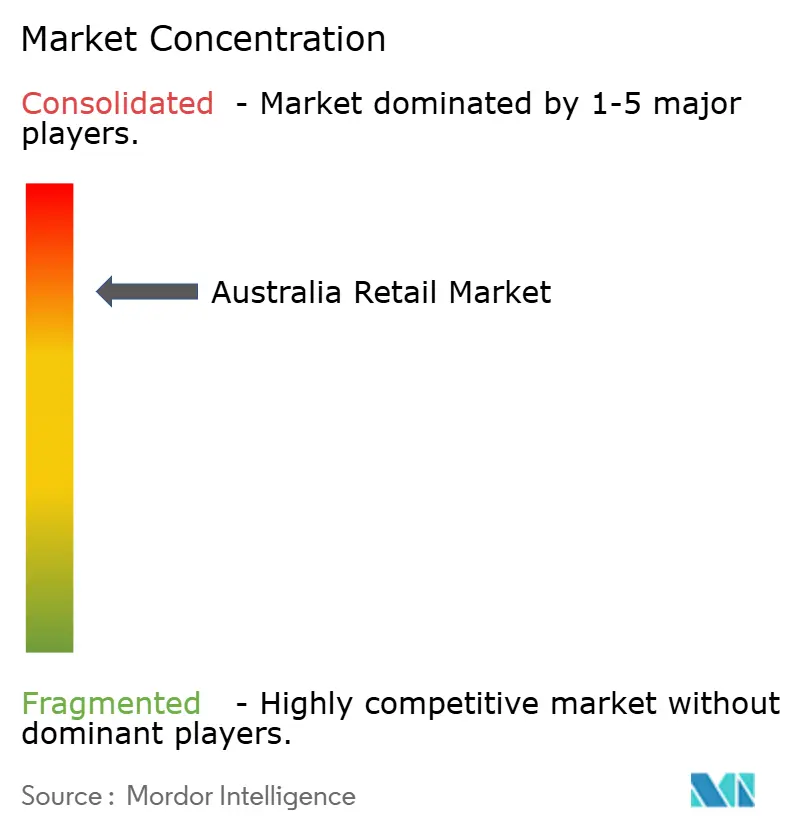
| Market Concentration | High |
Major Players *Disclaimer: Major Players sorted in no particular order Image © Mordor Intelligence. Reuse requires attribution under CC BY 4.0. | |
Australia Retail Market Analysis by Mordor Intelligence
The Australia Retail Market size was valued at USD 293.38 billion in 2025 and is estimated to grow from USD 312.95 billion in 2026 to reach USD 432.28 billion by 2031, at a CAGR of 6.67% during the forecast period (2026-2031).
Consumers sustain demand in essentials while adjusting baskets under cost-of-living pressure, which is lifting private label across value and premium tiers. Incumbents are reinforcing operational efficiency and speed as growth levers, with two-hour delivery windows, high next-day fulfilment rates, and broader Click and Collect coverage now table stakes. Large-format and logistics investments concentrate in Sydney and Perth corridors to support rapid fulfilment, while omnichannel integration links digital discovery with reliable last-mile options. Regulatory scrutiny on pricing conduct, supplier protections, and merger oversight is widening, which is shaping acquisition strategies and sharpening transparency in promotions and shelf pricing.
Key Report Takeaways
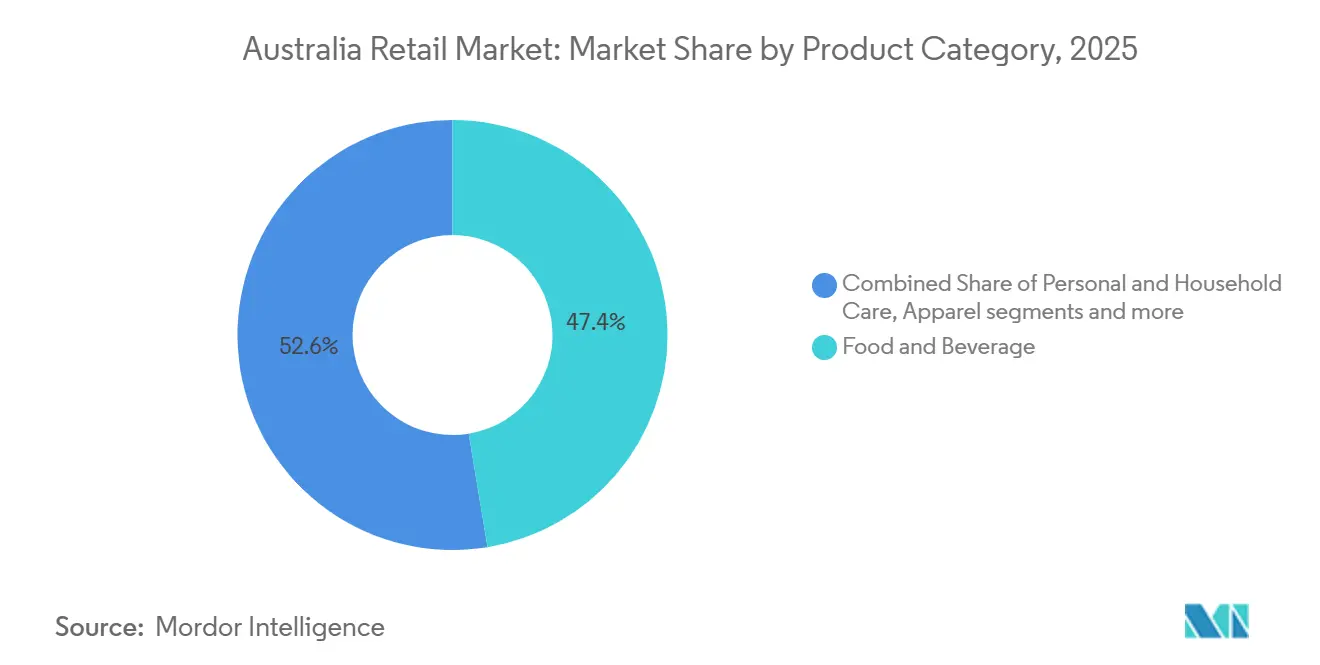
- By product category, Food & Beverage led with 47.38% revenue share in the Australian retail market in 2025, while Personal & Household Care is projected to expand at an 11.24% CAGR to 2031.
- By store size, Mid-Format stores held 51.76% share in the Australian retail market in 2025, while Large-Format stores are forecast to grow at a 12.36% CAGR through 2031.
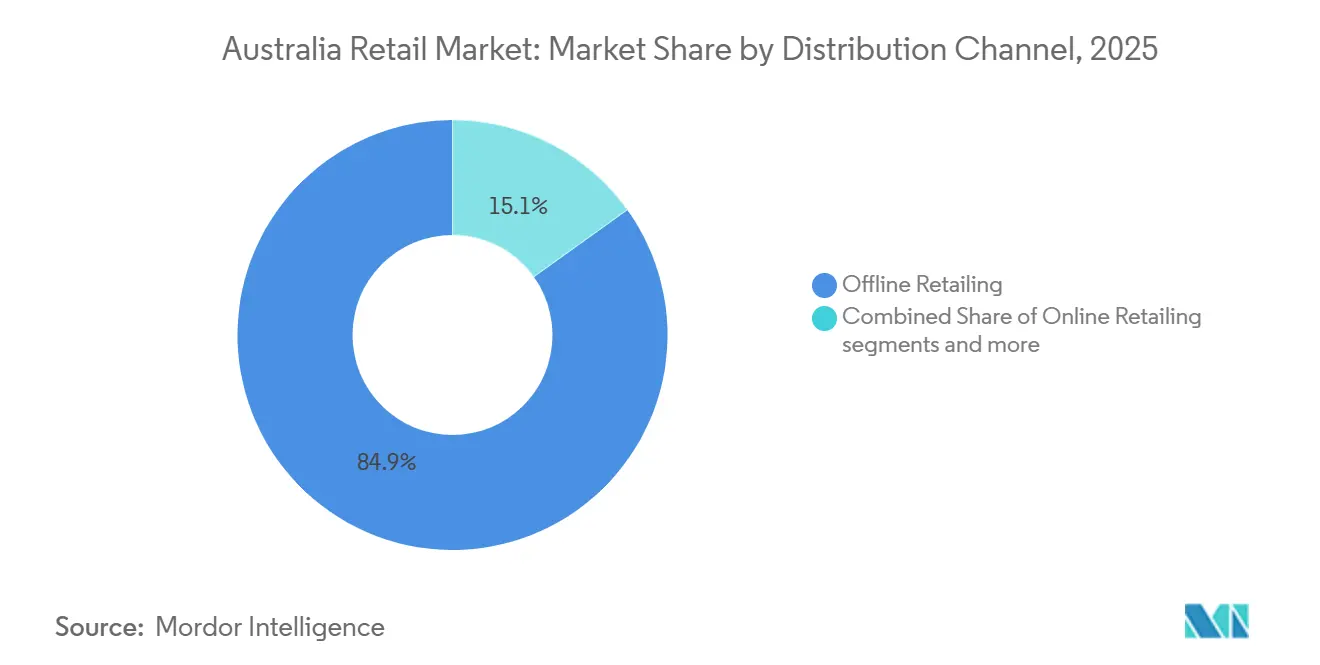
- By distribution channel, Supermarkets/Hypermarkets accounted for an 84.87% share in the Australian retail market in 2025, while Online channels are set to advance at a 13.26% CAGR through 2031.
- By price segment, Mass/Value commanded a 53.33% share in the Australian retail market in 2025, while Luxury is on track to grow at a 10.29% CAGR through 2031.
- By geography, New South Wales held a 35.33% share in the Australian retail market in 2025, while Western Australia is expected to record a 9.33% CAGR through 2031.
Note: Market size and forecast figures in this report are generated using Mordor Intelligence’s proprietary estimation framework, updated with the latest available data and insights as of January 2026.
Australia Retail Market Trends and Insights
Drivers Impact Analysis
| Driver | (~) % Impact on CAGR Forecast | Geographic Relevance | Impact Timeline |
|---|---|---|---|
| Cost-of-Living Pressure Accelerating Private Label Adoption | +1.2% | Global, strongest effects in NSW, Victoria, Queensland metro | Short term (≤ 2 years) |
| Mandatory Sustainability Reporting Pushing Circular Supply Chains | +0.8% | National, early gains in Sydney, Melbourne, Brisbane | Medium term (2-4 years) |
| Gen Z-led Social-Commerce Boom in Metro Cities | +1.1% | Sydney, Melbourne, Brisbane metro corridors | Short to medium term (≤ 3 years) |
| Rapid Roll-out of Dark-Store Quick-Commerce within 5 km Radii | +0.9% | Sydney, Melbourne, Brisbane inner urban zones | Short term (≤ 2 years) |
| Indigenous-Made Product Preference and Australian Made | +0.4% | National, higher uptake in regional and specialty retail | Long term (≥ 4 years) |
| AI-Driven Shelf-Replenishment and Dynamic Pricing Pilots | +1.3% | National, led by Coles, Woolworths, and Wesfarmers divisions | Medium term (2-4 years) |
| Source: Mordor Intelligence | |||
Cost-of-Living Pressure Accelerating Private Label Adoption Across Coles and Woolworths Networks
Private label is shifting from a budget fallback to a durable loyalty lever as households lean into value tiers while continuing to trial premium store brands. Woolworths reported strong momentum in own and exclusive brands in FY25, with pricing and range extensions that supported share defence in grocery and adjacent categories[1]Woolworths Group, “Woolworths Group Annual Report 2025,” Woolworths Group, woolworthsgroup.com.au. Coles sharpened its premium private label under Coles Finest, while growing everyday ranges and investing in replenishment accuracy to reduce stockouts that can erode private label conversion at the shelf. The combination of curated premium tiers and value staples allows retailers to reinforce differentiation beyond promotional cycles while moderating basket inflation for price-sensitive shoppers. These actions coincide with the Australian Competition and Consumer Commission’s heightened scrutiny of pricing and promotions, which is reinforcing a pivot toward more transparent value communication and more consistent shelf price strategies. Public materials from both incumbents emphasize a pipeline of product innovation and supply chain optimization aligned to the same-store adoption of private label ranges, which remains a visible driver of the Australian retail market.
Mandatory Sustainability Reporting Pushing Retailers Toward Circular Supply Chains
Phase-in of climate-related disclosure requirements is elevating sustainability from a voluntary activity to a governance and risk-management obligation for listed retailers. Leading chains are expanding packaging recovery pilots, building waste diversion programs, and adopting reusable transport packaging platforms in partnership with logistics providers to reduce single-use materials. Coles disclosed that solid waste diversion exceeded internal targets, alongside expanded donations to food rescue organizations as part of a broader waste hierarchy program, which helps mitigate both cost and reputational risk. Pallet pooling and reusable packaging collaborations supported by supply chain partners such as CHEP are reducing single-use plastics in distribution, with quantifiable reductions in materials and carbon that can be reported under emerging standards. Federal guidance to businesses on changes commencing July 2025 has sharpened executive focus on compliance timetables, investor expectations, and supply chain traceability, all of which are accelerating investment in circular models. These compliance and operational shifts are now a visible component of the differentiation and risk posture that anchors mid-term growth paths in the Australian retail market.
Gen-Z–Led Social-Commerce Boom in Metro Cities
Younger shoppers rely on mobile-first discovery and purchase journeys that link social content with checkout paths inside retailer ecosystems. Australia Post data show that social browsing and discovery are widespread among younger cohorts, which is shaping how retailers allocate content budgets and measure attribution across owned and marketplace channels[2]Australia Post, “Know Your Shoppers,” Australia Post, australia-post.com.au. The same research indicates that shoppers still research brands on owned channels and email, which underscores the need to integrate social traffic with loyalty and first-party data programs. Retailers are moving to shorten the path from discovery to conversion while preserving trust through clear disclosure and consistent value propositions across promotions and channels. This omnichannel integration supports elevated conversion rates from metro corridors where digital engagement is dense, and specialty formats are experimenting with content-led merchandising. The aggregate effect is a sustained lift in digital-led demand that benefits the Australian retail market as cross-channel journeys evolve and logistics performance improves.
Rapid Roll-out of Dark-Store Quick-Commerce within 5 km Urban Radii
Retailers are compressing last-mile distances through micro-fulfilment and dark-store nodes in metro catchments to meet tighter delivery windows for high-frequency baskets. Woolworths disclosed that a growing share of delivery orders meets two-hour thresholds and that the vast majority of B2C orders are fulfilled within 24 hours, signalling operational maturity in metro fulfilment networks that is reshaping shopper expectations. Australia Post reports that reliable delivery is a leading reason for retailer selection and that Gen Z and Millennial shoppers would switch retailers to access convenient collection points, which helps justify investment in omnichannel pickup options across urban corridors. Investment in large-scale robotics-enabled fulfilment capacity in Western Sydney supports faster delivery in dense catchments and provides spillover benefits in inventory pooling and assortment breadth[3]Amazon Australia, “Investment in Western Sydney Fulfilment Centres,” About Amazon Australia, aboutamazon.com.au. Omnichannel networks that blend dark stores, back-of-store picking, and regional fulfilment centres are now a core component of competitive strategy in the Australian retail market. These capabilities complement improved demand forecasting and replenishment to reduce substitutions, which further lifts satisfaction for time-sensitive orders.
Restraints Impact Analysis
| Restraint | (~) % Impact on CAGR Forecast | Geographic Relevance | Impact Timeline |
|---|---|---|---|
| Freight and Last-Mile Costs across Dispersed Population Hubs | -0.9% | National, acute in regional and remote areas | Medium to long term (2-5 years) |
| Rising National Minimum Wage Lifting Operating Expenses | -0.7% | National, highest impact in labour-intensive formats | Short term (≤ 2 years) |
| Duopoly Supplier Power Imbalance Triggering ACCC Actions | -0.5% | National, concentrated effects on independents and small suppliers | Short to medium term (≤ 3 years) |
| Mortgage-Rate-Driven Discretionary Spending Contraction | -1.0% | Sydney, Melbourne, Canberra high-debt metros | Short to medium term (≤ 3 years) |
| Source: Mordor Intelligence | |||
Freight and Last-Mile Costs across Australia’s Dispersed Population Hubs
Australia’s geography raises structural distribution costs that are pronounced in remote and regional communities, where households often face higher shelf prices because transport adds complexity and expense. The ACCC’s supermarket inquiry highlighted how remote store pricing policies and exemptions operate within large chains, reflecting the constraints of long-distance freight and limited competition. Floods and bushfires add to this cost baseline by disrupting rail and road corridors and by forcing contingency logistics that are more expensive and less reliable. E-commerce volumes are rising in regional areas, yet delivery to low-density postcodes remains costly and hard to scale for rapid windows that metro shoppers now expect. Operators with automotive and logistics exposure are signalling added costs from fleet energy transitions, which weigh on distribution economics through vehicle renewal and infrastructure investments. These conditions limit margin and complicate assortment breadth in affected regions, putting a cap on the near-term contribution of regional growth to the Australian retail market.
Rising National Minimum Wage Lifting Operating Expenses for Brick-and-Mortar Retailers
The National Minimum Wage increased by 3.5% to USD 24.95 per hour from July 1, 2025, and the Superannuation Guarantee rose to 12%, which together lift operating costs for labour-intensive formats like supermarkets, department stores, and specialty chains[4]Fair Work Ombudsman, “Minimum Wages,” Fair Work Ombudsman, fairwork.gov.au. Wage and superannuation increases have been reflected in large retailers’ labour cost lines, and operators have outlined productivity programs to offset the impact without eroding service levels. Central bank materials indicate elevated unit labour cost growth amid weak productivity, which narrows the scope to absorb wage increases through efficiency improvements alone. These dynamics intensify the search for task automation and process simplification in stores, supply chains, and support functions as retailers defend margins. The result is tighter cost control and targeted price investments rather than broad discounting, which supports value communication while preserving profitability. Labor and benefits cost escalation, therefore, remains a near-term constraint on expansion and profitability in the Australian retail market.
Segment Analysis
By Product Category: Health-Focused Premiumisation Drives Personal Care Surge
Food and Beverage commanded a 47.38% share in 2025, while Personal and Household Care is the fastest-growing category at an 11.24% CAGR through 2031 within the Australian retail market. The Australian retail market size reflects resilient demand for essentials alongside premiumization in wellness and beauty, where pharmacy-led formats and specialty ranges anchor growth. Chemist Warehouse and Sigma Healthcare accelerated vertical integration in early 2025, which set a platform to scale distribution, assortment, and in-store health services. Wesfarmers Health has expanded networks across Priceline Pharmacy and adjacent health services, backed by loyalty ecosystems that support repeat visits and cross-category promotion. Coles and Woolworths are adding innovation in private label and category adjacencies while investing in replenishment technology to maintain availability for fast-moving ranges that drive top-up missions.
Electronics and Appliances benefit from periodic replacement cycles and the migration toward connected and AI-enabled devices, yet discretionary softness is still evident in higher ticket subcategories as households manage mortgage and energy bills. Apparel remains sensitive to household confidence and interest costs, which guides retailers to calibrate basics and value-led private label while protecting selective premium capsules. Food and Beverage growth is supported by strategic price investments in core staples and by stronger private label penetration across value and premium tiers that target both wallet and taste. The Australian retail industry continues to reweight space and labour toward faster-growth self-care, beauty, health, and adjacent wellness services to capture demand shifts. That reweighting is paired with data-backed range optimization to ensure store assortments reflect local demographics and income profiles, which underpins steady share performance in urban corridors.
Note: Segment shares of all individual segments available upon report purchase
Get Detailed Market Forecasts at the Most Granular Levels
Download PDF
By Store Size: Large-Format Accelerates with Warehouse Expansion and Automation
Mid-Format stores held the largest share at 51.76% in 2025, while Large-Format locations are slated to grow the fastest at a 12.36% CAGR through 2031 in the Australian retail market. Retailers are scaling large-format assets for fulfilment integration, bulk value propositions, and operational leverage from automation and centralized services. Bunnings’ warehouse footprint, trade centres, and tool depot coverage exemplify how large-format anchors capture both DIY and professional demand while supporting Click and Collect throughput. Investments in robotics-enabled fulfilment capacity in Western Sydney add regional scale for rapid e-commerce delivery and support store replenishment on tighter cycles. Planning and zoning reforms recommended by the competition authority aim to reduce barriers to entry for new sites, which could expand the pool of viable large-format and mid-format locations.
Despite the growth of big boxes, mid-format supermarkets, and specialty stores remain the backbone of urban and suburban shopping due to location density, habitual trip patterns, and adjacency mixes. Small and micro formats focus on proximity and top-up missions yet face rising occupancy and wage costs that pressure operating ratios during quieter dayparts. Large-format players are prioritizing automation, RFID, and digital store services to optimize labour and speed while maintaining customer service standards. These levers support higher throughput per square foot and strengthen economics for omnichannel flows, which is accretive to the Australian retail market. The Australian retail industry will continue to mix formats at the catchment level to balance convenience, range, and cost to serve.
By Distribution Channel: Online Overtakes Traditional as Rapid Fulfilment Reshapes Shopper Expectations
Supermarkets and Hypermarkets held 84.87% share in 2025, while Online channels are the fastest growing at a 13.26% CAGR through 2031 within the Australian retail market. Woolworths reported e-commerce penetration of 15.1% in Q4 FY25, with high next-day fulfilment and an expanding share of orders within two hours, which clarifies how service speeds reinforce digital adoption. Australia Post tracked record online spending in 2024 alongside continued growth in the number of households shopping online, reflecting a normalization of digital purchasing habits. Online marketplaces increased their role in online spend growth, while retailers used store networks to accelerate pickup and returns experiences that lift conversion and lower last-mile costs. These combined moves keep Online on a structural upward path while supermarkets and hypermarkets continue to dominate core basket missions and weekly shops.
Retailers are tightening the link between digital discovery, loyalty, and in-store service through inventory visibility, personalized offers, and reliable delivery or pickup promises. Category growth in discretionary online remains uneven due to mortgage and energy cost pressures, which have kept retailers focused on value and on retention of high-frequency shoppers. For supermarkets and hypermarkets, AI-enabled replenishment reduces substitutions and out-of-stocks, which improves the quality of online baskets and customer satisfaction scores. The Australian retail market size for Online is supported by continuing upgrades to micro-fulfilment, collection points, and regional warehouses that move inventory closer to demand. The Australian retail industry will continue to refine channel roles to capture cross-shopping while keeping fulfilment cost per order in check.
Note: Segment shares of all individual segments available upon report purchase
Get Detailed Market Forecasts at the Most Granular Levels
Download PDF
By Price Segment: Luxury Rebounds as Affluent Consumers Seek Differentiation
Mass and Value segments accounted for a 53.33% share in 2025, while Luxury is expected to grow at a 10.29% CAGR through 2031 in the Australian retail market. Value positioning remains central as households manage budgets, which has prompted targeted shelf price reductions on core items from leading grocers. Retailers are also expanding premium health and beauty ranges and focused capsules to attract higher-spending cohorts in capital city corridors. Pharmacy-led banners refreshed brand propositions and in-store experience ahead of 2025 to sharpen curation and expertise credentials that support premium baskets. Retailers continue to balance value-price signalling with premiumization to defend margins and to sustain category growth through innovation-led ranges.
Lower price initiatives on essential items illustrate how targeted investment can strengthen price trust without broad erosion of gross margin across the portfolio. Retailers are pairing those investments with data-driven promotion planning and with loyalty to improve offer relevance by customer segment. Premiumization is occurring within beauty, wellness, and selected food categories, where provenance, efficacy, and sustainability credentials justify higher price points. This dual-track approach supports both traffic and basket mix, which is accretive to growth and stability in the Australian retail market. The Australian retail market size is therefore anchored by value but sustained by selective premium growth pockets that keep average selling prices balanced across cycles.
Geography Analysis
New South Wales leads with a 35.33% share in 2025, underpinned by Sydney’s population scale, white-collar employment concentration, and logistics centrality for national retail networks. Household debt and mortgage costs weigh on discretionary spending in high-priced suburbs, which keeps retailers focused on private label value, targeted promotions, and loyalty economics in the state. Continued investment in fulfilment infrastructure in Western Sydney supports same-day and next-day service at scale, which reinforces omnichannel adoption across grocery and specialty categories. Retail performance in NSW tracks both finance and professional services employment trends and the distribution of construction activity, which shape incomes and consumer confidence. Even with near-term cost pressures, the Australian retail market remains anchored by NSW due to its depth, network density, and infrastructure advantages.
Western Australia is positioned as the fastest-growing state by 2031 due to high resource-linked incomes and comparatively lower household leverage in key suburbs. Retail trade data over 2025 show a pattern of month-on-month gains in periods where household budgets stabilized, which supported consistent store traffic and online basket growth. Retailers are expanding capacity around Perth to handle growth in bulky goods, trade, and home improvement categories that require large sites and service yards. Inflation remains manageable relative to income dynamics in the state, which supports sustained spending in essentials and in selective discretionary categories. These fundamentals position WA as a growth anchor for the Australian retail market through the forecast period.
Queensland, Victoria, South Australia, Tasmania, the ACT, and the Northern Territory present mixed performance due to divergent exposure to housing costs, energy bills, and public sector wage settings. Queensland benefits from migration and tourism, which support steady spending in essentials and home-related categories, while Victoria continues to adjust to higher debt sensitivity in parts of Melbourne. South Australia and Tasmania show resilience due to balanced cost structures and slower rent growth, which helps sustain store traffic during non-promotional weeks. The ACT’s public sector employment base smooths volatility yet constrains upside during tight wage growth cycles, while the NT faces persistent last-mile and logistics costs that limit range breadth. Across these regions, the Australian retail market is shaped by local planning rules, logistics corridor capacity, and urban density that together influence format feasibility and last-mile economics.
Competitive Landscape
Grocery concentration remains the defining feature of Australian retail, with the two largest chains holding the majority of supermarket share and a third discount player adding discipline on price. The competition regulator’s 2024–2025 inquiry outlined limited incentives for vigorous price competition within traditional grocery, which reinforced the importance of transparency on promotions and supplier dealings. Large banners emphasize private label expansion, everyday price programs, and value tiers to build trust while protecting margins. Supermarket leaders are also deploying AI in forecasting and replenishment to maintain on-shelf availability and to reduce substitutions, which sustains online satisfaction. These levers shape the playbook for the Australian retail market, where value, trust, and convenience remain the primary axes of competition.
Beyond supermarkets, Wesfarmers continues to strengthen home improvement, discount department stores, and office supplies through network optimization and supply chain upgrades. Bunnings invests in commercial trade capability and supply integration to broaden addressable markets, while Kmart Group enhances store automation and omnichannel services to lift throughput. Officeworks is scaling B2B and education solutions and planning an omnichannel supply chain facility to support next-day service and bulk orders. These strategic moves lean on data-driven planning and fulfilment orchestration to improve productivity and customer experience, which helps moderate wage and rent inflation impacts. Together, they illustrate how diversified retail groups are building moat-like capabilities that support growth in the Australian retail market.
E-commerce specialists and marketplaces continue to invest in fulfilment capacity near major urban centres to compress delivery times and expand marketplace assortment. Amazon’s investments in Western Sydney will increase local capacity for fast delivery and broaden small business participation in marketplace programs. Australia Post data indicate shoppers’ preference for reliable delivery and convenient pickup, which underpins adoption and retention for leading online platforms. With acquirers facing a mandatory notification regime from 2026, organic investment in logistics and technology is expected to remain the primary route to share gains in sensitive categories. As execution improves across store and online operations, the Australian retail market is likely to sustain a dual focus on value and speed as defining competitive factors.
Australia Retail Industry Leaders
Woolworths Group Ltd
Coles Group Ltd
Wesfarmers Ltd
Aldi Stores (Australia) Pty Ltd
Metcash Ltd (IGA Network)
- *Disclaimer: Major Players sorted in no particular order
Need More Details on Market Players and Competitors?
Download PDF
Recent Industry Developments
- February 2025: Sigma Healthcare completed the acquisition of Chemist Warehouse, creating a vertically integrated retail pharmacy group across Australia and New Zealand after shareholder approvals and regulatory review.
- May 2025: Woolworths launched Lower Shelf Price on more than 500 everyday items with an average reduction sustained across multiple quarters as part of its value program.
- July 2025: Wesfarmers completed the sale of Coregas and transitioned Catch fulfilment assets to Kmart Group to enhance omnichannel capability and eliminate losses in the standalone e-commerce unit.
- July 2025: Wesfarmers and partners produced the first product from the Covalent Lithium hydroxide refinery in Kwinana, supporting long-term growth and supply chain integration for battery materials.
Australia Retail Market Report Scope
The report on the Australian retail sector provides a comprehensive evaluation of the market, with an analysis of the segments in the market. The Australian retail sector is segmented by products (food and beverages, personal and household care, apparel, footwear and accessories, furniture, toys and hobby, electronic and household appliances, and other products) and distribution channel (supermarkets/hypermarkets, convenience stores, and department stores, specialty stores, online, and other distribution channels).
Food & Beverage
| Personal & Household Care |
| Apparel |
| Footwear & Accessories |
| Furniture |
| Toys & Hobbies |
| Electronics & Household Appliances |
| Other Products |
By Store Size
| Large-Format |
| Mid-Format |
| Small / Micro |
By Distribution Channel
| Supermarkets / Hypermarkets |
| Convenience Stores |
| Department Stores |
| Specialty Stores |
| Online |
| Other Channels |
By Price Segment
| Mass / Value |
| Premium |
| Luxury |
By Region
| New South Wales |
| Victoria |
| Queensland |
| Western Australia |
| South Australia |
| Others |
| Food & Beverage | Personal & Household Care |
| Apparel | |
| Footwear & Accessories | |
| Furniture | |
| Toys & Hobbies | |
| Electronics & Household Appliances | |
| Other Products | |
| By Store Size | Large-Format |
| Mid-Format | |
| Small / Micro | |
| By Distribution Channel | Supermarkets / Hypermarkets |
| Convenience Stores | |
| Department Stores | |
| Specialty Stores | |
| Online | |
| Other Channels | |
| By Price Segment | Mass / Value |
| Premium | |
| Luxury | |
| By Region | New South Wales |
| Victoria | |
| Queensland | |
| Western Australia | |
| South Australia | |
| Others |
Need A Different Region or Segment?
Customize Now
Key Questions Answered in the Report
What is the Australia retail market growth outlook to 2031?
The Australia retail market is projected to reach USD 432.28 billion by 2031 at a 6.67% CAGR, supported by private label premiumization, omnichannel adoption, and logistics upgrades.
Which channels are growing fastest in the Australian retail landscape?
Online is the fastest-growing channel with a 13.26% CAGR through 2031, supported by two-hour windows, next-day fulfilment, and reliable delivery and pickup options.
How are leading grocers competing in the Australia retail environment?
Coles and Woolworths invest in private label, shelf price reductions on essentials, and AI-enabled inventory and replenishment to strengthen value and convenience for households.
What drives the premium segment in the Australian retail ecosystem?
Luxury is forecast to grow at a 10.29% CAGR to 2031, supported by premium beauty, wellness, and curated capsules that combine provenance, efficacy, and an elevated in-store experience.
Which state is expected to grow fastest in the Australian retail arena?
Western Australia is set to lead with a 9.33% CAGR through 2031 due to resource-linked incomes, robust balance sheets, and ongoing logistics and store investments in Perth.
What regulatory changes will impact consolidation in the Australian retail space?
A mandatory merger notification regime commencing in 2026 will require major supermarkets to notify acquisitions of supermarket businesses or land, increasing scrutiny on consolidation.


