Market Overview
| Study Period | 2020 - 2031 |
|---|---|
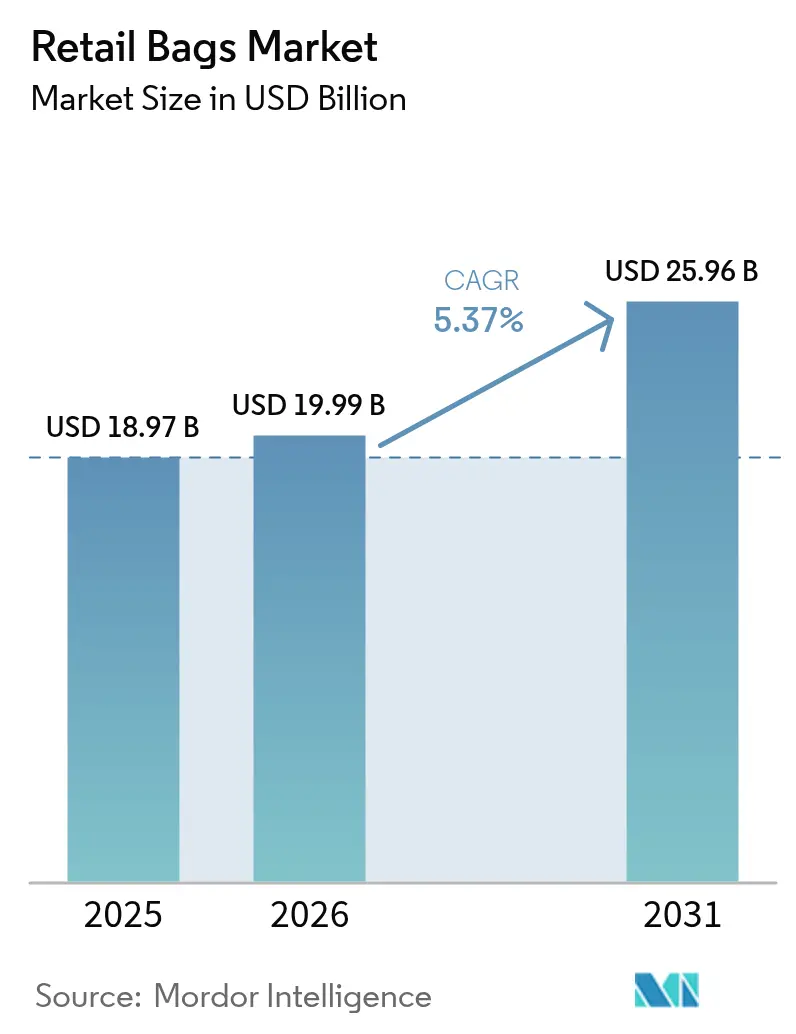
| Market Size (2026) | USD 19.99 Billion |
| Market Size (2031) | USD 25.96 Billion |
| Growth Rate (2026 - 2031) | 5.37% CAGR |
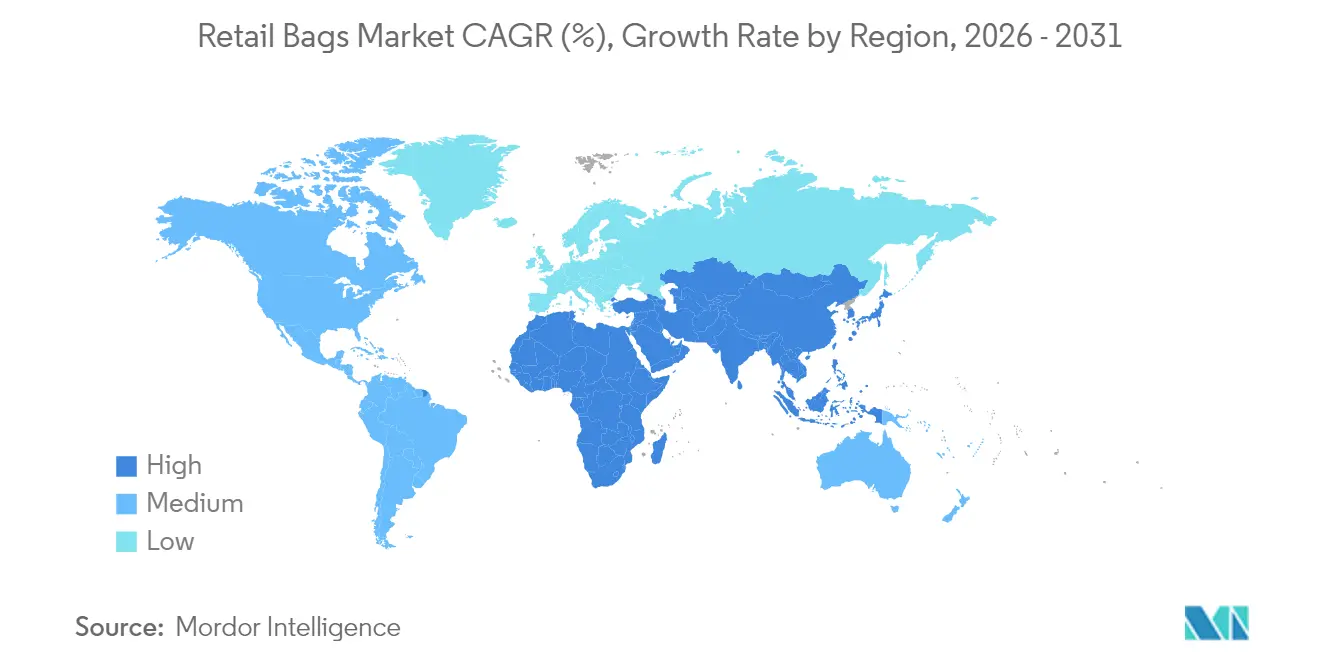
| Fastest Growing Market | Asia Pacific |
| Largest Market | Asia-Pacific |
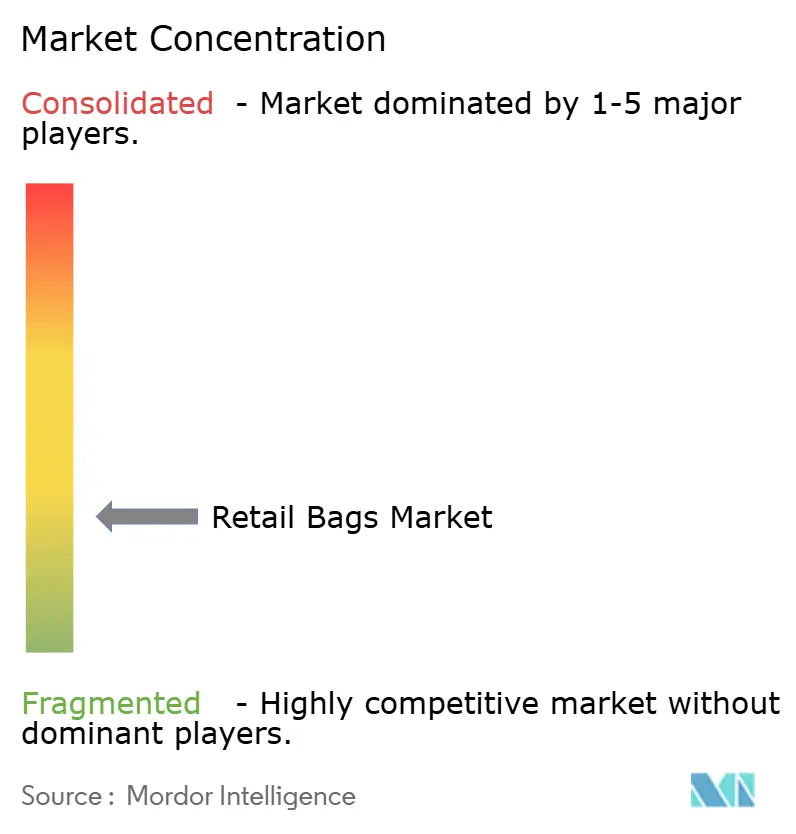
| Market Concentration | Low |
Major Players *Disclaimer: Major Players sorted in no particular order Image © Mordor Intelligence. Reuse requires attribution under CC BY 4.0. | |
Retail Bags Market Analysis by Mordor Intelligence
The retail bags market size is expected to grow from USD 18.97 billion in 2025 to USD 19.99 billion in 2026 and is forecast to reach USD 25.96 billion by 2031 at 5.37% CAGR over 2026-2031. Growth is fueled by single-use plastic restrictions in the United States and the European Union, rising e-commerce volumes that demand right-sized secondary packaging, and brand commitments to recyclable paper alternatives. California’s 2026 prohibition on all plastic checkout bags and Colorado’s carry-out bag fee illustrate how regulatory momentum reshapes procurement strategies, while Extended Producer Responsibility (EPR) laws incentivize converters to invest in closed-loop systems. Raw-material volatility adds complexity: April 2024 polyethylene prices rose 3 cents per pound even as polypropylene slipped 2 cents, eroding converters’ margins. Consolidation among global packaging majors further intensifies competition, positioning large players to absorb compliance costs and expand geographic reach under unified quality standards. Asia-Pacific dominates consumption with 35.67% revenue share in 2024 because of rapid urbanization and mobile-first retail channels, while paper bags post the quickest expansion at 6.89% CAGR as retailers replace legacy polyethylene SKUs.
Key Report Takeaways
- By material type, paper posted a 6.71% CAGR and is on track to become the fastest-advancing component of the retail bags market by 2031.
- By bag type, tote and reusable formats recorded an 8.62% growth rate, leading segment expansion within the retail bags market.
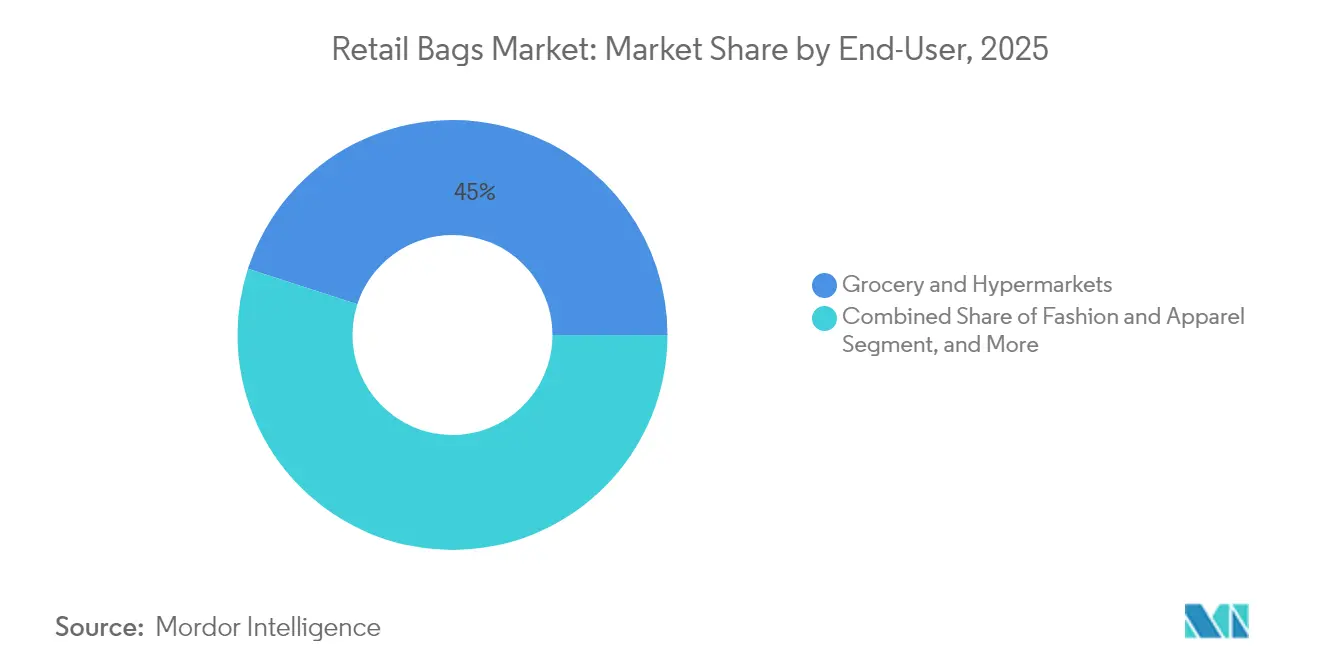
- By end-user, grocery and hypermarkets retained 45.02% of retail bags market share in 2025, whereas food-service and QSR channels registered the highest 7.08% CAGR.
- By distribution channel, e-commerce marketplaces delivered an 8.11% CAGR, outpacing traditional wholesale routes inside the retail bags market.
- By geography, Asia-Pacific controlled 35.41% of 2025 revenue and is projected to compound at 7.62% through 2031.
Note: Market size and forecast figures in this report are generated using Mordor Intelligence’s proprietary estimation framework, updated with the latest available data and insights as of 2026.
Global Retail Bags Market Trends and Insights
Drivers Impact Analysis*
| Driver | (~) % Impact on CAGR Forecast | Geographic Relevance | Impact Timeline |
|---|---|---|---|
| Plastic-reduction mandates and single-use bans | +1.2% | North America & EU, expanding to APAC | Medium term (2-4 years) |
| Rapid growth of grocery and quick-commerce fulfillment | +0.9% | Global, concentrated in urban centers | Short term (≤ 2 years) |
| Brand-owner pivot to paper and textile carrier bags | +0.8% | Global, led by North America & EU | Medium term (2-4 years) |
| Cost-optimized flexographic printing boosting retail branding | +0.5% | Global | Long term (≥ 4 years) |
| RFID-ready smart bags improving shrink-control | +0.3% | North America & EU | Long term (≥ 4 years) |
| Closed-loop take-back programmes by big-box retailers | +0.4% | North America, expanding globally | Medium term (2-4 years) |
| Source: Mordor Intelligence | |||
Plastic-Reduction Mandates Reshape Market Architecture
Single-use bag bans now cover 13 US states, with California’s Senate Bill 1053 eliminating thick plastic substitutes and requiring 40% recycled content in paper bags from 2026, rising to 50% by 2028. Grocers must also replace pre-checkout produce sacks from January 2025, a shift estimated at 176,000 units per average store each month.[1]California Department of Revenue, “Carryout Bag Fee,” tax.colorado.gov The European Union’s Packaging and Packaging Waste Regulation sets matching recycled-content thresholds, ensuring global alignment. These policies accelerate demand for fiber-based carriers and hand shoppers a direct pricing signal through mandatory bag fees, giving domestic paper mills a structural advantage inside the retail bags market.
Rapid Growth of Grocery and Quick-Commerce Fulfillment
Micro-fulfillment centers compress delivery windows below 30 minutes, forcing packaging to survive robotic handling and tightly packed totes. Urban dark stores therefore specify thicker gussets and moisture-resistant coatings, lifting unit values within the retail bags market. Basket-size data from national grocers show 15–20% packaging cost increases once plastic SKUs are swapped for paper alternatives; retailers recover expenses via 10-cent bag levies introduced under state law. Integration of RFID labels into flexo-printed logos enables last-mile inventory visibility, an attribute that commands a USD 0.02 premium but cuts shrinkage on high-value categories by up to 30%.
Brand-Owner Pivot to Paper and Textile Carrier Bags
Mars, Boots and Morrisons collectively removed more than 1 billion plastic units between 2024 and 2025 after converting to recycled-fiber carriers, trimming Scope 3 emissions while reinforcing eco-centric brand narratives. Yet recycled-fiber scarcity sent average mill-delivered kraft prices up 25–30% in 2024, compelling converters to trial wheat-straw and bamboo inputs. OECD studies note fluorine-free grease barriers still occupy under 1% of global volume, kept in check by a 20–40% cost delta over PFAS chemistry.
Cost-Optimized Flexographic Printing Boosts Retail Branding
High-definition flexography shortens make-ready time by 40%, cutting the break-even order quantity for branded bags to fewer than 10,000 units, which opens participation for small retailers. Patent filings for water-based inks used on recycled kraft climbed 35% in 2024, mirroring converter capital investments targeted at EPR compliance. Automated plate-mounting robotics reduce labor input, a critical offset against rising operator wages in North America and Western Europe. These innovations collectively raise value capture per print run, positioning graphic differentiation as a durable growth lever inside the retail bags market.
Restraints Impact Analysis*
| Restraint | (~) % Impact on CAGR Forecast | Geographic Relevance | Impact Timeline |
|---|---|---|---|
| Increasing raw-material volatility for recycled polymers | -0.8% | Global, acute in North America & EU | Short term (≤ 2 years) |
| Patchwork compliance costs across cities and states | -0.5% | North America, emerging in EU | Medium term (2-4 years) |
| Consumer fatigue toward "bring-your-own-bag" initiatives | -0.6% | Developed markets, urban centers | Medium term (2-4 years) |
| PFAS and toxic-ink scrutiny on paper bags | -0.4% | Global, led by North America & EU | Long term (≥ 4 years) |
| Source: Mordor Intelligence | |||
Increasing Raw-Material Volatility for Recycled Polymers
Recycled resin trades unhook from oil benchmarks, making contract pricing unpredictable. April 2024 spot polyethylene gained 3 cents per pound, while polypropylene slid 2 cents, a spread that squeezed blended-film makers. Premiums for post-consumer feedstock widen when municipalities lack curbside collection capacity required to meet statutory recycled-content quotas. With materials representing up to 70% of delivered bag cost, converters struggle to hedge, forcing quarterly surcharges that ripple through the retail bags market.
Consumer Fatigue Toward “Bring-Your-Own-Bag” Initiatives
WRAP’s longitudinal tracking shows 94% household penetration for reusable totes, yet average reuse stands below five cycles, far short of the 100 cycles needed to override the carbon burden of heavier fabrics. As a result, retailers sell more “bags for life,” ironically inflating polymer tonnage despite fee-based deterrents. Stockpiling drives secondary waste streams and jeopardizes circular-economy metrics, muting projected environmental gains and softening demand elasticity within the retail bags market.
*Our forecasts treat driver/restraint impacts as directional, not additive. The impact forecasts reflect baseline growth, mix effects, and variable interactions.
Segment Analysis
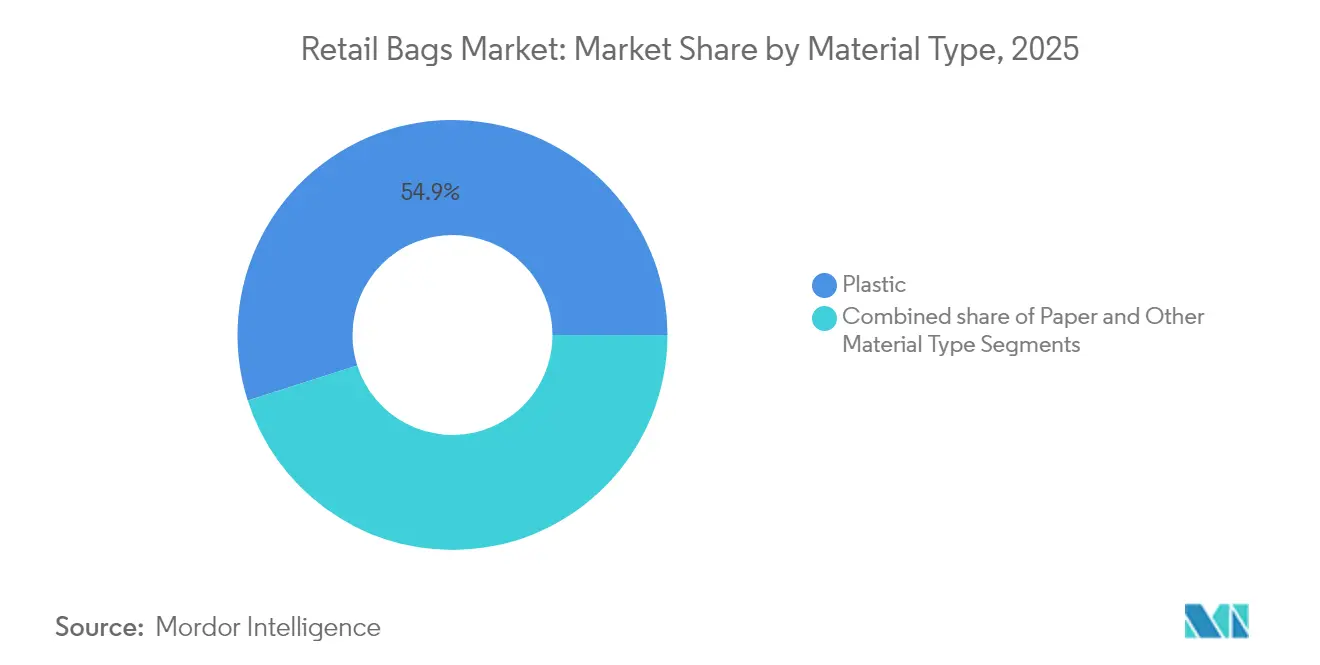
By Material Type: Paper Outpaces Plastics in a Consolidating Mix
Plastic substrates retained 54.92% share of the retail bags market in 2025 thanks to entrenched supply chains and versatile film performance. Polyethylene dominated plastic orders for T-shirt carriers and die-cut shoppers, while polypropylene powered sturdier reusable SKUs. April 2024 spot price divergence—polyethylene up 3 cents per pound and polypropylene down 2 cents—exposed converters to margin swings that cascaded into contract renegotiations. Paper’s 6.71% CAGR positions it as the fastest-advancing material through 2031, driven by mandatory recycled content targets in California and the EU. Mars’s shift to recyclable paper wrappers for 200 million confectionery units annually underlines corporate momentum away from fossil-based films.
Manufacturers face 25–30% cost inflation on recycled fiber, pushing them to secure wheat-straw and bagasse alternatives. PFAS testing, averaging USD 500–1,000 per SKU, coupled with USD 50,000–100,000 reformulation charges, discourages smaller mills from rapid substitution. Mondi’s kraft portfolio and Smurfit WestRock’s global mill footprint mitigate such shocks, reinforcing their leadership inside the retail bags market. Textile and compostable biopolymer bags remain niche; yet city mandates for organic waste streams in Europe and parts of North America give these formats strategic upside as municipal infrastructure matures.


By Bag Type: Reusable Tote Designs Accelerate Despite Behavior Gaps
Tote and durable carrier formats advance at 8.62% CAGR, topping the performance table even as reuse patterns disappoint. Their trajectory is tied to regulatory language exempting thick-gauge bags from plastic bans, which incentivizes retailers to upsell sturdier units. Conversely, traditional T-shirt bags—still 27.98% of shipments—face phased elimination in several US states and EU municipalities by 2026. Custom die-cut and patch-handle designs retain relevance for specialty apparel and cosmetics merchants, who value tactile finishes and heavy ink coverage achievable on laminated substrates. Stand-up pouches and D-cut sacks find favor in food-service aggregation orders where tamper-evident seals are mandatory for delivery platforms.
Average cotton or woven-polypropylene tote production requires 10–15 times the material of a single-use counterpart, translating to higher embedded emissions; nevertheless, per-unit retail pricing of USD 1.00–1.50 shields profitability. Patent activity targeting collapsible geometries and antimicrobial treatments rose 22% in 2024, a response to consumer surveys citing hygiene and storage convenience as key adoption hurdles. The retail bags market size for reusables is projected to expand to USD 6.44 billion by 2031, aligned to dynamic demand from grocery and discount chains that offer loyalty rewards for each reuse instance.
By End-User: Food-Service and QSR Storefronts Drive Incremental Volume
Grocery and hypermarket operators anchored 45.02% of the retail bags market in 2025, a baseline sustained by weekly household stock-up trips and legislated bag-fee schemes. Yet food-service and fast-casual chains accelerate at 7.08% CAGR on the back of delivery-first menu strategies using lightweight kraft sacks with built-in heat vents to combat condensation. Packaging audits show that switching from plastic to grease-resistant paper raises per-order material cost by 12–18% but boosts brand favorability on sustainability indices, offsetting cost through traffic gains. Fashion and specialty retailers employ premium embossed paper and fabric drawstring pouches to extend in-store experience digitally via QR code links on bag panels, capturing social-media share of voice.
Dark grocery stores handling 1,000+ orders daily require bags amenable to pick-to-light automation and able to stack into totes without tearing. RFID-enabled carriers generate data lakes feeding inventory engines that shrink stock-outs by 20%, making smart packaging a defensible value-add inching the retail bags market toward integrated IoT ecosystems. Patent filings for temperature-resistant coatings jumped 31% in 2024 as hot-food operators pressured suppliers for leak-proof barriers compliant with PFAS bans.
By Distribution Channel: E-Commerce Marketplaces Redefine Logistics Requirements
E-commerce captured an 8.11% CAGR, the fastest stride among sales channels, as omnichannel leaders mandate packaging that performs across warehouse conveyors, curbside pickup stations and parcel networks. Amazon’s right-size guidelines stipulate tear-strength thresholds 40% higher than in-store equivalents, compelling converters to reinforce panel seams and upgrade base film gauges. Direct-to-retailer agreements still command 30.21% volume share owing to legacy integrated replenishment systems that minimize working capital. Meanwhile, wholesaler consolidation yields national distributors capable of small-lot digital printing, giving independent merchants access to personalized packaging without prohibitive minimums.
Private-label programs inside supermarket groups fix design elements centrally but pledge 30% recycled content, anchoring long-run capacity for domestic mills. The retail bags market size allocated to marketplace sellers is predicted to reach USD 5.78 billion by 2031 as storefront onboarding rules enforce recyclable material compliance. Automation inside fulfillment centers rewards suppliers delivering palletized units with dimensional tolerances under ±2 mm, further professionalizing converter SOPs.
Geography Analysis
Asia-Pacific spearheads the retail bags market with 35.41% revenue in 2025 and projects the highest 7.62% CAGR to 2031. Urban clusters in China, India and Indonesia upgrade to omnichannel grocery models demanding moisture-resistant kraft sacks and woven-polypropylene totes sized for motorcycle delivery boxes. Production-Linked Incentive schemes in India motivate local extrusion and converting investment, trimming lead-times for global apparel brands shifting sourcing from China. Patent registrations for biodegradable bag substrates across APAC rose 45% in 2024, signaling R&D attention on low-cost fiber blends suited to tropical humidity.
North America navigates a patchwork of state bans and EPR legislation. California’s pre-checkout plastic ban effective 2025 and Colorado’s mandatory 10-cent paper fee illustrate the legal mosaic that forces multi-state retailers to catalog SKUs by jurisdiction. Mega-mergers such as Smurfit WestRock’s USD 11.2 billion tie-up diversify mill networks and spread regulatory risk. PFAS scrutiny remains elevated after Minnesota PCA detected 9–49 ppm fluorine across half of tested yard-waste sacks, prompting rapid substitution toward water-borne coatings. Europe pursues circular-economy objectives anchored in the Packaging and Packaging Waste Regulation, which codifies content targets that ripple through global supply chains. Boots eliminated 900 tonnes of plastic in 2024 by adopting recycled-fiber shoppers, while Morrisons replaced 150 million produce bags with brown paper sleeves. Mondi maintains leadership as the region’s largest paper-bag producer, deploying kraft mills to balance surging fiber demand against energy-driven cost inflation. Public fatigue with BYO-bag schemes persists; WRAP data shows “bag for life” volumes inching up despite per-bag charges, complicating landfill diversion goals.

Competitive Landscape
Consolidation frames competitive intensity. Smurfit WestRock’s cross-Atlantic merger, Novolex’s USD 6.7 billion union with Pactiv Evergreen and International Paper’s USD 7.2 billion purchase of DS Smith collectively propelled the top five suppliers to 54% of global capacity, signaling a moderately concentrated structure. Scale advantages enable vertical integration of kraft pulp, recycled resin and converting, ensuring regulatory compliance at volume-driven cost. Amcor’s pending all-stock combination with Berry Global promises USD 650 million in annual synergies and USD 180 million incremental R&D focused on PFAS-free coatings.
Technology adoption differentiates tier-one players. Smurfit WestRock invests in AI-enabled Bag-in-Box lines that auto-adjust glue deposition based on humidity, minimizing rejects. Novolex scales RFID-embedded kraft for supermarket shrink control, while Amcor pilots mechanically recycled polyethylene sourced from NOVA’s 2025 Indiana facility, channeling feedstock into e-commerce mailer programs. Mid-size converters respond through niche specialization—such as water-based gravure on sugar-cane kraft or antimicrobial reusable totes—to defend share against conglomerates.
Strategic alliances grow around closed-loop recovery. Retail chains partner with Sustainable Packaging Coalition’s How2Recycle label to simplify consumer sorting, and Stina Inc. expands the NexTrex directory to aggregate post-consumer film. Participation grants converters verified access to PCR resin, a critical hedge against virgin price spikes that threatened EBITDA margins during 2024’s hurricane-disrupted Gulf Coast production season.
Retail Bags Industry Leaders
Attwoods Packaging Company
Mondi Group PLC
International Paper Company
Smurfit Westrock
Amcor plc
- *Disclaimer: Major Players sorted in no particular order

Recent Industry Developments
- April 2025: Novolex and Pactiv Evergreen closed a USD 6.7 billion merger, integrating 250 brands and 39,000 SKUs to accelerate innovation in sustainable food-service packaging.
- February 2025: Smurfit WestRock reported Q4 2024 net sales of USD 7.5 billion and announced a 500,000-ton capacity rationalization to optimize mill performance post-merger.
- January 2025: California enacted Senate Bill 1046, banning non-recyclable pre-checkout plastic bags statewide beginning 2025, and mandating recycled paper or certified compostable alternatives.
- January 2025: Amcor and Berry Global agreed to merge, projecting USD 650 million synergy savings while elevating recycled-content usage to 30% by 2030.


Global Retail Bags Market Report Scope
Retail carry bags are utilized in the retail industry to help consumers. The introduction of reusable bags into the retail carry bags industry has grown quickly. Retailers favor using plastic carry bags due to their properties, such as being easy for users, economical, and easy to store packaging format. The prevailing trend for the global retail carry bags market is biodegradable carry bags.
Furthermore, manufacturers of carrying bags are focused on giving environmentally friendly bags which produce smaller wastage. The retail bags market is segmented by material type (plastic, paper, other materials), end user (grocery store, food service, and other end users), and geography (North America, Europe, Asia-Pacific, Latin America, and Middle East & Africa).
By Material Type
| Plastic | Polyethylene (PE) |
| Polypropylene (PP) | |
| Other Plastics (PET, rPET, PLA) | |
| Paper | |
| Other Material Type |
By Bag Type
| T-shirt / Singlet |
| Die-cut / Patch-handle |
| Tote and Reusable |
| Stand-up Pouch / D-cut |
| Garbage / Liner |
By End-User
| Grocery and Hypermarkets |
| Food-Service and QSR |
| Fashion and Apparel |
| E-commerce Marketplaces |
| Other Retail Formats |
By Distribution Channel
| Direct to Retailer |
| Packaging Wholesalers |
| Retail-chain Private Label |
| E-commerce Marketplaces |
By Geography
| North America | United States | |
| Canada | ||
| Mexico | ||
| Europe | Germany | |
| United Kingdom | ||
| France | ||
| Italy | ||
| Spain | ||
| Russia | ||
| Rest of Europe | ||
| Asia-Pacific | China | |
| India | ||
| Japan | ||
| South Korea | ||
| Australia and New Zealand | ||
| Rest of Asia-Pacific | ||
| Middle East and Africa | Middle East | United Arab Emirates |
| Saudi Arabia | ||
| Turkey | ||
| Rest of Middle East | ||
| Africa | South Africa | |
| Nigeria | ||
| Egypt | ||
| Rest of Africa | ||
| South America | Brazil | |
| Argentina | ||
| Rest of South America | ||
| By Material Type | Plastic | Polyethylene (PE) | |
| Polypropylene (PP) | |||
| Other Plastics (PET, rPET, PLA) | |||
| Paper | |||
| Other Material Type | |||
| By Bag Type | T-shirt / Singlet | ||
| Die-cut / Patch-handle | |||
| Tote and Reusable | |||
| Stand-up Pouch / D-cut | |||
| Garbage / Liner | |||
| By End-User | Grocery and Hypermarkets | ||
| Food-Service and QSR | |||
| Fashion and Apparel | |||
| E-commerce Marketplaces | |||
| Other Retail Formats | |||
| By Distribution Channel | Direct to Retailer | ||
| Packaging Wholesalers | |||
| Retail-chain Private Label | |||
| E-commerce Marketplaces | |||
| By Geography | North America | United States | |
| Canada | |||
| Mexico | |||
| Europe | Germany | ||
| United Kingdom | |||
| France | |||
| Italy | |||
| Spain | |||
| Russia | |||
| Rest of Europe | |||
| Asia-Pacific | China | ||
| India | |||
| Japan | |||
| South Korea | |||
| Australia and New Zealand | |||
| Rest of Asia-Pacific | |||
| Middle East and Africa | Middle East | United Arab Emirates | |
| Saudi Arabia | |||
| Turkey | |||
| Rest of Middle East | |||
| Africa | South Africa | ||
| Nigeria | |||
| Egypt | |||
| Rest of Africa | |||
| South America | Brazil | ||
| Argentina | |||
| Rest of South America | |||


Key Questions Answered in the Report
What is the current size of the retail bags market?
The retail bags market is valued at USD 19.99 billion in 2026.
How fast will the retail bags market grow by 2031?
It is forecast to expand at a 5.37% CAGR, reaching USD 25.96 billion by 2031.
Which material segment is growing the quickest?
Paper bags lead with a 6.71% CAGR through 2031, driven by plastic-reduction mandates.
Why are reusable totes controversial despite strong sales?
WRAP studies show average totes are reused fewer than five times, far below the 100 cycles required to offset their higher material footprint, creating waste concerns.
How are regulations influencing the retail bags market in North America?
State bans such as California’s SB 1046 and fee structures like Colorado’s 10-cent charge compel retailers to shift toward recycled-content paper or certified compostable bags.
Page last updated on:


