
Refuse-Derived Fuel (RDF) Market Size and Share
Market Overview
| Study Period | 2021 - 2031 |
|---|---|
| Market Size (2026) | USD 7.72 Billion |
| Market Size (2031) | USD 10.12 Billion |
| Growth Rate (2026 - 2031) | 5.56 % |
| Fastest Growing Market | Asia-Pacific |
| Largest Market | Europe |
| Market Concentration | Low |
Major Players *Disclaimer: Major Players sorted in no particular order Image © Mordor Intelligence. Reuse requires attribution under CC BY 4.0. | |
Refuse-Derived Fuel (RDF) Market Analysis by Mordor Intelligence
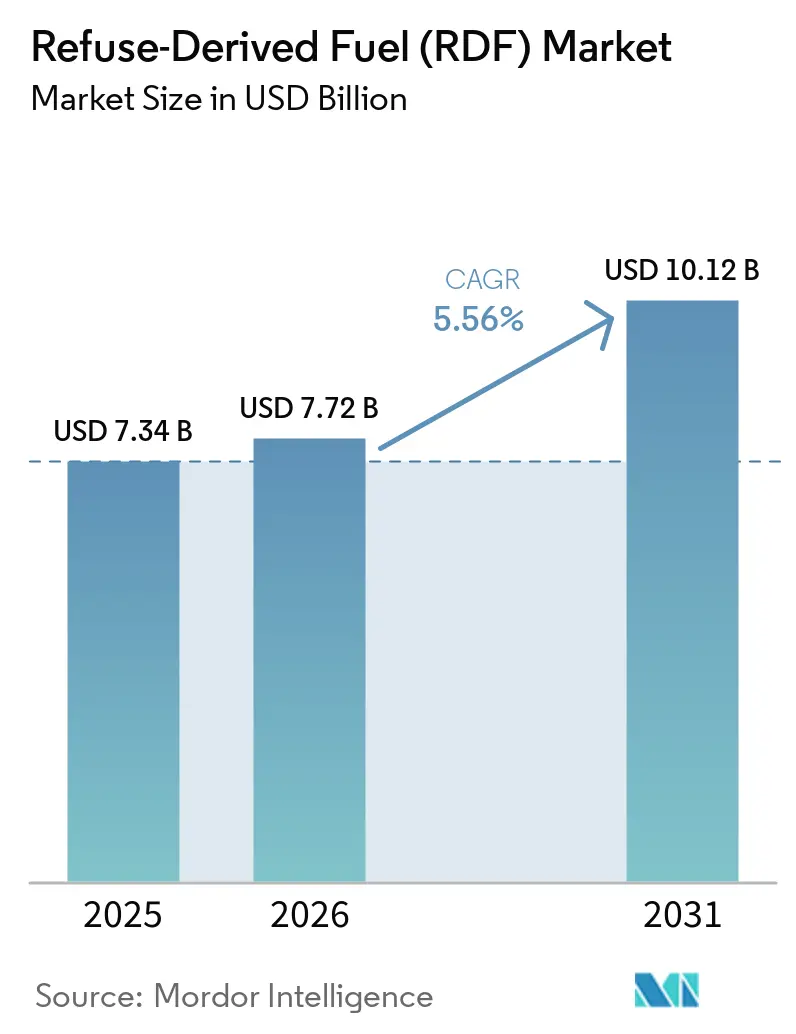
The Refuse-Derived Fuel Market size is expected to grow from USD 7.34 billion in 2025 to USD 7.72 billion in 2026 and is forecast to reach USD 10.12 billion by 2031 at 5.56% CAGR over 2026-2031. Landfill restrictions, carbon-cost exposure, and industrial demand for alternatives to fossil fuels are supporting the refuse-derived fuel market. Europe remained the largest regional base in 2025 because waste diversion rules, energy recovery assets, and cement demand are already established. Asia-Pacific is expected to add demand more quickly as cities face rising municipal waste volumes and build processing and co-processing capacity. The commercial opportunity is moving toward reliable, high-calorific fuel with traceable composition rather than unsorted residual waste. Operators with collection capacity, processing assets, and long-term offtake arrangements are better placed to manage quality and supply risk in the refuse-derived fuel market.
Key Report Takeaways
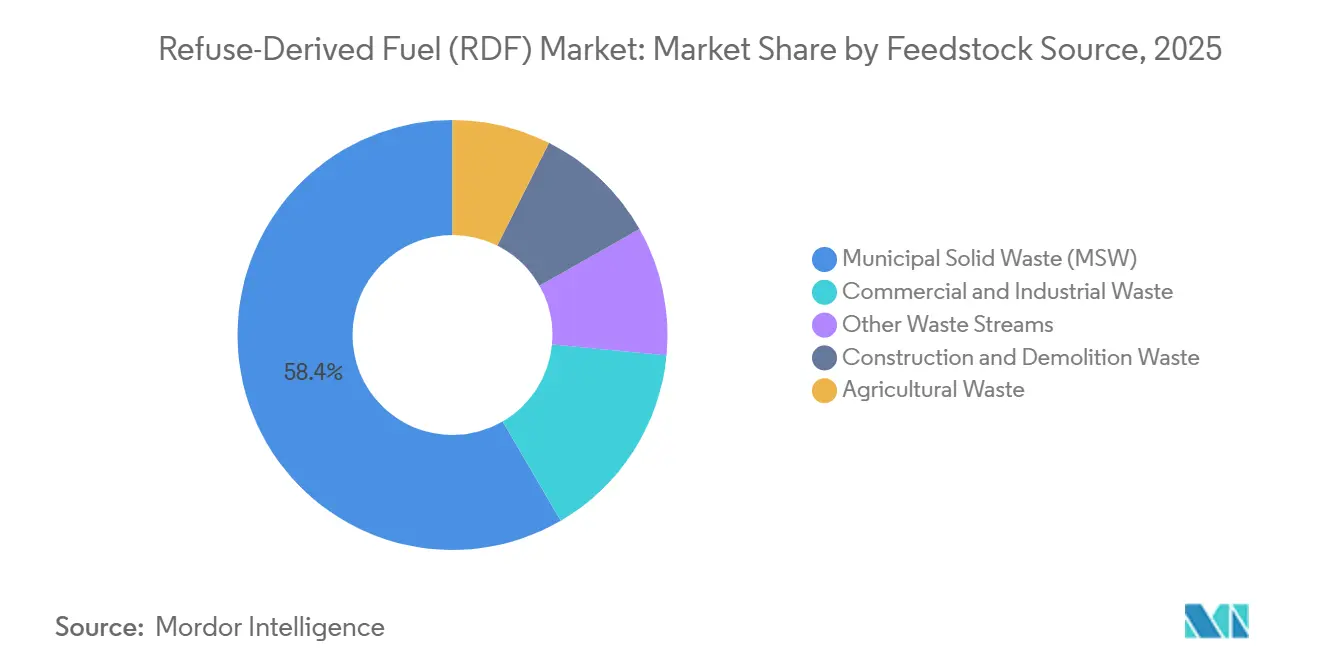
- By feedstock source, municipal solid waste held 58.4% of the refuse-derived fuel market share in 2025, while commercial and industrial waste is forecast to grow at a 6.3% CAGR through 2031.
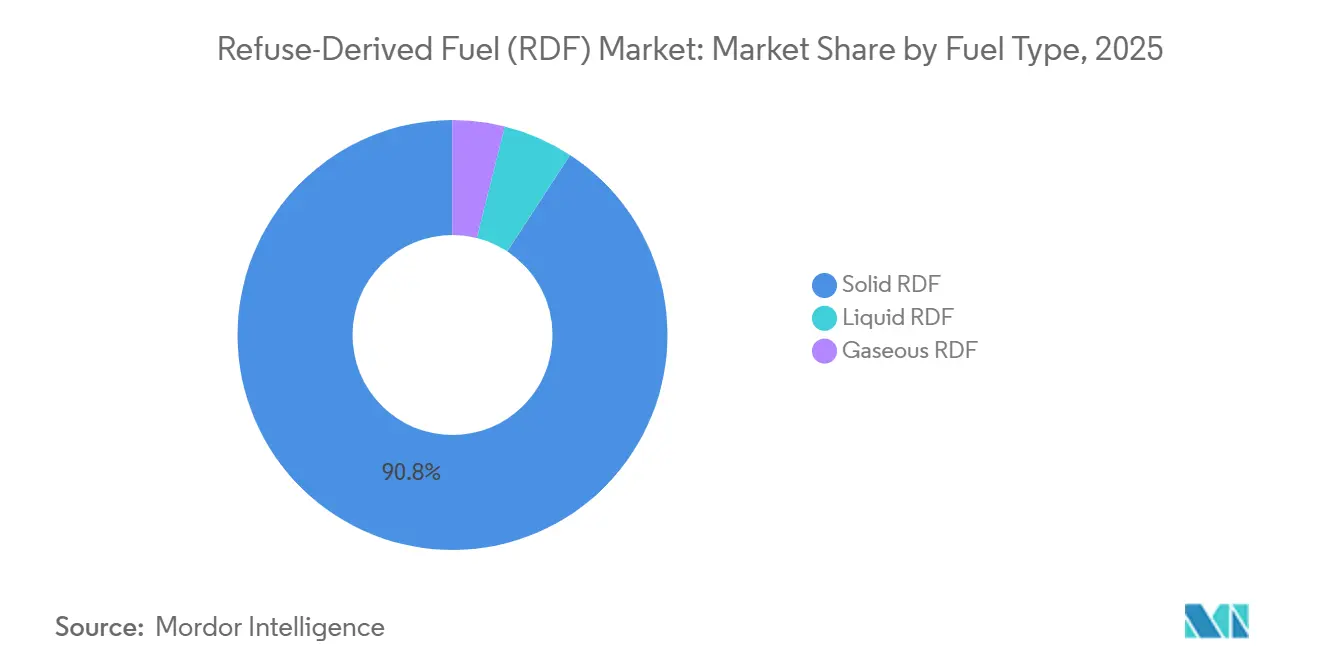
- By fuel type, solid RDF accounted for 90.8% in 2025 and is projected to advance at a 5.9% CAGR through 2031.
- By end user, cement manufacturing accounted for 43.5% of the refuse-derived fuel market size in 2025 and is forecast to expand at a 6.9% CAGR through 2031.
- By geography, Europe held 46.7% in 2025, while Asia-Pacific is forecast to grow at a 6.1% CAGR through 2031.
Note: Market size and forecast figures in this report are generated using Mordor Intelligence’s proprietary estimation framework, updated with the latest available data and insights as of January 2026.
Market Trends and Insights
Drivers Impact Analysis of Refuse-Derived Fuel (RDF) Market*
| Driver | % Impact on CAGR Forecast | Geographic Relevance | Impact Timeline |
|---|---|---|---|
| Landfill Diversion and Circular-Economy Mandates | +1.20% | Global, concentrated in EU27 and Asia-Pacific | Medium term (2-4 years) |
| Cement and Industrial Fossil-Fuel Substitution | +1.30% | Global, high-intensity in EU, India, China, MEA | Long term (≥ 4 years) |
| Rising Residual Waste Volumes and Waste-to-Energy Demand | +0.90% | APAC core, spill-over to MEA and South America | Medium term (2-4 years) |
| Carbon Pricing and Embedded-Carbon Accounting | +0.80% | EU27 primary, early signals in UK and Canada | Long term (≥ 4 years) |
| Digital Sorting and Fuel-Quality Traceability | +0.50% | Europe leading, APAC scaling | Medium term (2-4 years) |
| Local Energy Security Through Distributed Heat and Power | +0.60% | Eastern Europe, Nordics, Southeast Asia | Short term (≤ 2 years) |
| Source: Mordor Intelligence | |||
Landfill Diversion and Circular-Economy Mandates
Landfill diversion requirements continue to support the refuse-derived fuel market by redirecting non-recyclable material toward recovery. The EU target limits landfill disposal to 10% by 2035, and 9 Member States have reached that level. Romania and Croatia reported landfill rates of 73% and 71%, respectively, in 2021, leaving substantial material that could enter processing systems as capacity develops.[1] The European Commission identified a Circular Economy Act as part of its circular economy policy agenda in 2026. A future restriction on landfilling combustible municipal and commercial waste would expand available feedstock where disposal remains common and require local sorting, pre-treatment, and stable contracts before new volumes can become usable fuel. The refuse-derived fuel market depends on this local capacity to turn diverted material into an acceptable fuel stream.
Cement and Industrial Fossil-Fuel Substitution
Cement manufacturing provides the most stable demand base for the refuse-derived fuel market because kiln heat is difficult to replace through direct electrification. European cement plants substituted 53% of kiln fuel with waste-derived alternatives, compared with a global average of 6%.[2] JSW Cement co-processed 157,000 metric tons of RDF in FY2024-25 and achieved a 16.5% thermal substitution rate across 2 facilities. The company reported avoided emissions of 120,000 metric tons of CO2, which connects fuel substitution with decarbonization reporting. A 2025 review found that 20% RDF thermal substitution could reduce the global warming potential of cement production by 3.3% to 4.2%, with a higher result when avoided landfill methane was included. Indocement’s 2026 agreement with Paser Regency shows that Asian cement producers are shifting toward formal local supply arrangements instead of relying only on spot procurement.
Rising Residual Waste Volumes and Waste-to-Energy Demand
Rising residual waste volumes support feedstock availability for the refuse-derived fuel market, especially where source separation remains limited. Global municipal solid waste generation exceeds 2.3 billion metric tons annually and is projected to increase 70% by 2050.[3] India generates more than 150,000 metric tons of municipal solid waste each day, while less than 25% is converted to RDF fuel. Commercial and industrial waste is gaining value because it generally has less moisture and a more consistent composition than mixed municipal waste. Extended producer responsibility rules can also increase the quantity of non-recyclable packaging and production residues that require treatment, favoring processors that can separate material at source and document its energy characteristics. It also strengthens the role of consistent input material in the refuse-derived fuel market.
Carbon Pricing and Embedded-Carbon Accounting
Carbon pricing is changing the economics of residual waste treatment in the refuse-derived fuel market. The European Commission proposed including municipal waste incineration in the EU Emissions Trading System from 2031, with 25% coverage in 2031 and full coverage in 2034. Modeling commissioned by Zero Waste Europe estimated that an EU ETS price of EUR 108 per tonne of CO2 in 2030 could raise waste gate tariffs by EUR 74 to EUR 132 per tonne. Higher costs for unsorted incineration can favor the removal of fossil carbon before combustion and increase demand for quality-controlled fuel. The EU Carbon Border Adjustment Mechanism is operating in phases through 2026 and increases attention to embedded emissions in imported cement. Digital measurement of renewable carbon content and batch quality can make fuel specifications more useful in long-term supplier negotiations, raising the importance of documented quality across the refuse-derived fuel market.
Restraints Impact Analysis of Refuse-Derived Fuel (RDF) Market*
| Restraint | % Impact on CAGR Forecast | Geographic Relevance | Impact Timeline |
|---|---|---|---|
| Feedstock Quality and Moisture Variability | -0.50% | Global, most acute in APAC developing markets | Medium term (2-4 years) |
| High Logistics Cost and Limited Economical Haul Distance | -0.40% | Global, highest constraint in South America and MEA | Long term (≥ 4 years) |
| Permitting, Community Acceptance and Emissions Retrofit Risk | -0.30% | North America, Australia, EU fringe markets | Medium term (2-4 years) |
| Competition for High-Calorific Residual Waste | -0.50% | EU27, UK, Japan, South Korea | Short term (≤ 2 years) |
| Source: Mordor Intelligence | |||
Feedstock Quality and Moisture Variability
Feedstock inconsistency limits wider adoption in the refuse-derived fuel market because cement kilns require predictable combustion characteristics. Unprocessed mixed waste can contain more than 35% moisture, which can reduce net calorific value from a target of 18 MJ/kg to below 11 MJ/kg. European industrial emissions rules impose chlorine and moisture limits that can lead to rejection of poor-quality RDF loads. High organic content in developing Asian waste streams can raise moisture above 40% and increase the drying requirement. India’s co-processing guidelines set quality thresholds that small facilities may struggle to meet. Advanced drying and real-time monitoring add USD 8 to USD 15 per tonne to processing costs.
High Logistics Cost and Limited Economical Haul Distance
Transport costs constrain the refuse-derived fuel market because fuel value can be lost when material moves too far by road. A 2025 life cycle assessment found that centralized systems had 31% to 33% higher logistics costs than decentralized alternatives. The study reported logistics costs near EUR 33 per tonne for centralized arrangements and EUR 23 per tonne for decentralized ones. It also placed the road-to-rail break-even distance near 700 km, with lower practical distances for low-density fluff RDF. Processing plants must therefore be located near suitable waste sources and cement kilns or energy users, making location discipline essential to the economics of the refuse-derived fuel market. SUEZ used barge logistics in France in 2025 to replace many truck movements with 2 to 3 daily barge movements carrying 12-tonne containers.
*Our forecasts treat driver/restraint impacts as directional, not additive. The impact forecasts reflect baseline growth, mix effects, and variable interactions.
Refuse-Derived Fuel (RDF) Market Segment Analysis
By Feedstock Source:
C&I Waste Gains Ground on MSW DominanceMunicipal solid waste accounted for 58.4% of the refuse-derived fuel market value in 2025, supported by municipal diversion requirements and established mechanical-biological treatment assets. Its supply scale reflects years of investment in collection and processing systems. However, organic contamination and seasonal moisture can restrict calorific output and chlorine control. These constraints limit the share of municipal material that can meet premium solid recovered fuel specifications. Commercial and industrial waste is forecast to grow at a 6.3% CAGR through 2031, the highest rate among feedstock sources.
Its lower moisture and more consistent composition, together with source separation under extended producer responsibility frameworks, can support a closer match with engineered fuel requirements in the refuse-derived fuel market. The SoliD-Q project began in 2026 to develop digital recycling data for precise recyclate quality.[4] Construction and demolition waste remains a smaller opportunity in infrastructure-intensive markets, though gypsum and treated timber can restrict kiln use. Agricultural waste is being tested in South Asia and South America through co-pelletized blends. Pellet production costs range from USD 35 to USD 50 per tonne, while the cited fuel savings versus coal can reach USD 70 per tonne and quality standards can support longer-term offtake agreements.

By Fuel Type:
Solid RDF’s Physical Advantages Sustain Scale and GrowthSolid RDF held 90.8% of the refuse-derived fuel market share in 2025 and is projected to grow at a 5.9% CAGR through 2031. Baled and pelletized solid fuel fits existing transport systems and cement kiln feeding equipment. European lines can deliver calorific accuracy within ±1 MJ/kg through inline sensing. Advanced pelletization can raise energy density from 11 MJ/kg in raw mixed waste to more than 18 MJ/kg. This reduces the performance difference with bituminous coal.
Solid RDF, therefore, remains the format most readily used in contractual fuel specifications in the refuse-derived fuel market. TOMRA launched the GAINnext AI platform in 2026, providing tools that can help processors manage quality variation and document fuel performance. Liquid RDF serves specialized kilns using solvent-bearing and oil-bearing industrial residues, while gaseous RDF from anaerobic digestion or gasification is the smallest format. Renewi produced 19 million cubic meters of biogas at its Amsterdam site in 2025, including 11 million cubic meters upgraded to green gas for the Dutch grid. The Netherlands’ green gas blending obligation, taking effect in 2027, directs part of this value chain toward grid injection.
By End User:
Cement Manufacturing Leads All Metrics, Industrial Channels DiversifyCement manufacturing held 43.5% of the refuse-derived fuel market size in 2025 and is forecast to expand at a 6.9% CAGR through 2031. Its position reflects the continuing need for high-temperature kiln fuel. Many Asian producers remain below 20% thermal substitution, compared with Europe’s 53% rate. This gap leaves room for higher use where local collection, sorting, and permitting improve. The Cement and Concrete Breakthrough for COP30 includes waste-derived fuel actions focused on permitting and fuel-quality harmonization. These measures can improve access to the refuse-derived fuel market for qualified local suppliers.
Power generation is the second-largest end-user channel, led by dedicated waste-to-energy plants and co-fired coal facilities. Combined heat and power plants are important in Scandinavia, Germany, and Poland because district heating can provide revenue beyond electricity sales. Industrial boilers and lime plants are developing outlets in Central and Eastern Europe where industrial waste and mineral-processing facilities are close together. Proposed EU ETS inclusion can increase pressure on energy-from-waste plants to purchase better-sorted fuel, supporting processors with documented quality. Paper and pulp mills in Nordic markets and North America also use waste-derived solids alongside wood chips in large on-site biomass boilers.
Geography Analysis
Europe Refuse-Derived Fuel (RDF) Market
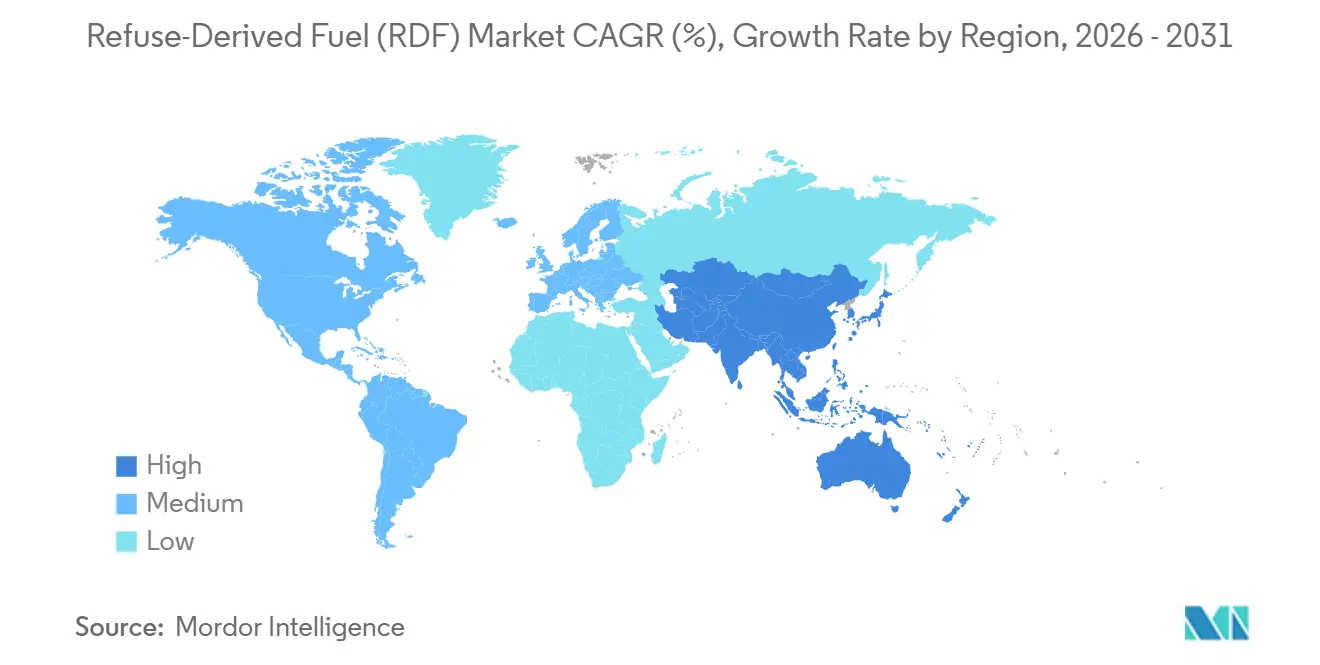
Europe held 46.7% in 2025, supported by landfill diversion rules, energy recovery assets, and carbon pricing in the refuse-derived fuel market. Germany, the Netherlands, Italy, the United Kingdom, and France remained central production and consumption centers. Poland, Romania, and Croatia are adding capacity through mechanical-biological treatment investment. Sweden’s imports from the United Kingdom and Norway show how installed energy-from-waste capacity can sustain cross-border fuel trade. The EU Landfill Directive and Waste Framework Directive continue to shape regional demand, while the Circular Economy Act adds policy direction in 2026.
APAC Refuse-Derived Fuel (RDF) Market
Asia-Pacific is expected to grow at a 6.1% CAGR through 2031, making it the fastest-growing regional component of the refuse-derived fuel market. Urban waste growth, limited landfill space, and cement producers’ efforts to reduce coal use support this outlook. India’s daily municipal waste volume exceeds 150,000 metric tons, with less than 25% converted to RDF fuel. China’s industrial growth increases demand for consistent alternative fuels, while Japan’s waste-separation infrastructure supports higher use of solid recovered fuel. Indonesia’s 2026 Indocement and Paser Regency agreement provides an example of government-supported kiln co-processing.
The Americas and MEA Refuse-Derived Fuel (RDF) Market
North America has a moderate position because landfill disposal remains relatively affordable across many U.S. states and Canadian provinces. The U.S. Environmental Protection Agency finalized updated large municipal waste combustor standards in March 2026, covering more than 150 units at 57 facilities. South America remains at an early stage, with RDF use below 5% of residual waste volumes in Brazil, Chile, and Argentina. Logistics and limited cement co-processing capacity constrain development there. Middle East and African activity is most visible in Saudi Arabia, the United Arab Emirates, Egypt, and Morocco, while high-moisture waste can delay larger RDF projects in Sub-Saharan Africa. These conditions keep project economics uneven across the refuse-derived fuel market.
Competitive Landscape
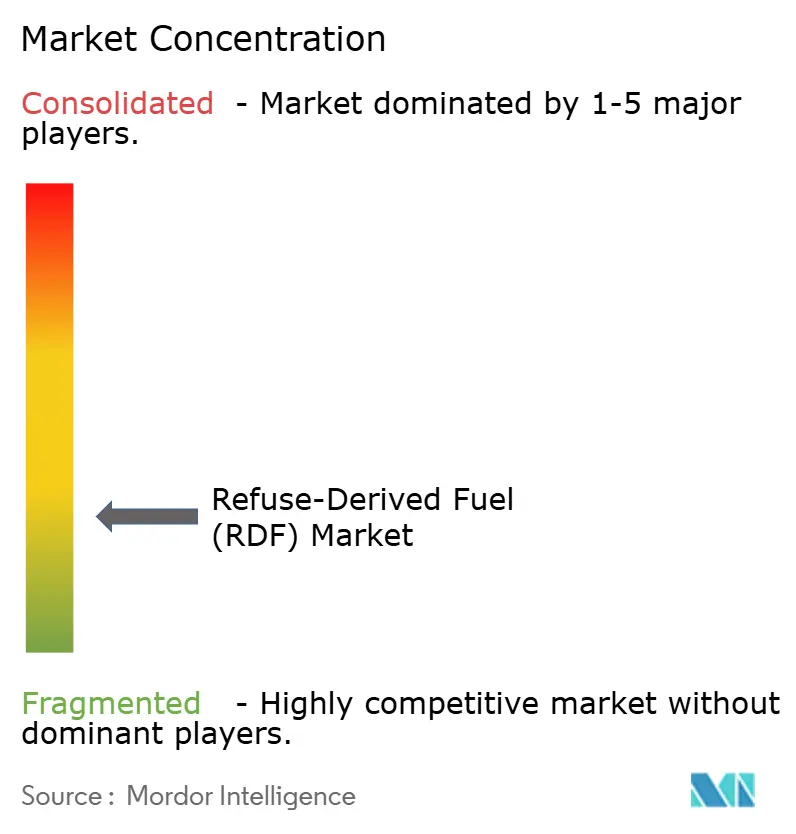
The refuse-derived fuel market is fragmented, with REMONDIS, Veolia, SUEZ, Renewi, and PreZero influential in Europe through collection networks, mechanical-biological treatment assets, and long-term fuel agreements. Their control over waste collection and processing helps limit feedstock and quality risk. They also supply cement groups, including Heidelberg Materials, Holcim, and Buzzi. Smaller processors remain relevant at waste origination and logistics stages, while better sorting can narrow the fuel-quality gap with integrated groups. TOMRA’s GAINnext platform supports data-based sorting-line optimization in 2026.
PreZero opened Spain’s largest RDF production plant at Barcelona Free Zone in 2025, with 70,000 metric tons of annual capacity in a EUR 42 million investment that also includes a biomethane facility. SUEZ signed a EUR 465 million, 10-year contract in December 2025 to reconstruct the Romainville-Bobigny waste treatment center in France. The facility is expected to process up to 450,000 metric tons each year from 2029. These moves indicate a preference for long-term infrastructure contracts and raise entry barriers where feedstock and offtake are secured together.
Geminor reported that SRF volumes increased 3.7% in 2025, while RDF volumes fell 15.2% because of milder weather and lower electricity prices. The company is growing its United Kingdom domestic energy-from-waste fuel supply toward 250,000 metric tons per year through long-term municipal contracts. South and Southeast Asia remain open areas because no comparable integrated regional platform has been established. Commercial and industrial waste aggregation is another opportunity because industrial generators remain fragmented. Patent activity in pelletization and emissions monitoring supports differentiation in premium solid recovered fuel and a quality-focused position in the refuse-derived fuel market.
Refuse-Derived Fuel (RDF) Industry Leaders
-
Veolia Environnement S.A.
-
SUEZ S.A.
-
REMONDIS SE & Co. KG
-
Renewi plc
-
Biffa Limited
- *Disclaimer: Major Players sorted in no particular order
Refuse-Derived Fuel (RDF) Market Companies Covered in this Report
- A2A S.p.A.
- Andusia Recovered Fuels Limited
- Averda International Limited
- Biffa Limited
- Blue Phoenix Group B.V.
- Enva Group Limited
- FCC Servicios Medio Ambiente Holding, S.A.U.
- Geminor AS
- Indaver NV
- PAPREC Group
- PreZero International GmbH
- Ragn-Sells AB
- REMONDIS SE & Co. KG
- Renewi plc
- SARIA SE & Co. KG
- SUEZ S.A.
- Veolia Environnement S.A.
- Waste Management, Inc.
Recent Industry Developments in Refuse-Derived Fuel (RDF) Market
- May 2026: SUEZ secured a GBP 396 million (USD 507 million) 10-year contract with Milton Keynes City Council to operate a waste recovery park, while concurrently constructing a 50,000-tonne anaerobic digestion plant in Northumberland and operating the NESS EfW facility in Aberdeen.
- March 2026: The US EPA finalized updated emission standards for large municipal waste combustors for the first time in 20 years, covering over 150 combustion units at 57 facilities, including dedicated refuse-derived fuel facilities; the standards are expected to modernize emission controls and could redirect waste streams toward pre-sorted RDF pathways as operators seek compliance.
- February 2026: PT Indocement Tunggal Prakarsa Tbk signed an MoU with Paser Regency Government, Indonesia, to supply RDF from TPST Janju, 10 metric tons per hour, and TPST Songka, 5 metric tons per hour, facilities for cement kiln use; witnessed by Indonesia’s Minister of Environment, the initiative is positioned as a national model for industry-government co-processing collaboration.
- January 2026: SUEZ won a 12-year contract worth nearly EUR 420 million (USD 470 million) from Sydetom66 for the Calce waste treatment facility near Perpignan; the contract covers a new sorting center, non-recyclable waste preparation center, and an energy-from-waste plant generating 55,000 MWh of heat and 135,000 MWh of electricity annually from 2028.
Global Refuse-Derived Fuel (RDF) Market Report Scope
Refuse-Derived Fuel (RDF) is a processed fuel produced from non-hazardous combustible waste materials. It is manufactured by removing recyclable and inert components from waste, then shredding, drying, and homogenizing the remaining material to produce a consistent, high-calorific-value fuel. RDF is primarily derived from municipal solid waste (MSW), commercial and industrial (C&I) waste, and selected construction and demolition (C&D) waste. It is widely used as a substitute for fossil fuels such as coal in cement kilns, power plants, and industrial boilers. Its use helps reduce landfill disposal, recover energy from waste, lower fossil fuel consumption, and support the circular economy and greenhouse gas emission reduction objectives.
The Refuse-Derived Fuel (RDF) market is segmented by feedstock source, fuel type, end user, and geography. By feedstock source, the market is segmented into municipal solid waste (MSW), commercial and industrial (C&I) waste, construction and demolition (C&D) waste, agricultural waste, and other waste streams. By fuel type, the market is segmented into solid RDF, liquid RDF, and gaseous RDF. By end user, the market is segmented into cement industry, power generation, combined heat and power (CHP), industrial boilers, waste-to-energy (WtE) plants, lime industry, steel industry, paper and pulp industry, and other end users. The report also covers the market size and forecasts for the global refuse-derived fuel (RDF) market across 26 countries in key regions. For each segment, the market sizing and forecasts have been provided on the basis of value (USD).
Segmentation Overview
| Municipal Solid Waste (MSW) |
| Commercial & Industrial (C&I) Waste |
| Construction & Demolition (C&D) Waste |
| Agricultural Waste |
| Other Waste Streams |
| Solid RDF |
| Liquid RDF |
| Gaseous RDF |
| Cement Manufacturing |
| Power Generation |
| Combined Heat & Power (CHP) |
| Industrial Boilers |
| Waste-to-Energy Plants |
| Lime Industry |
| Steel & Metal Processing |
| Paper & Pulp |
| Other Industrial Applications |
| North America | United States |
| Canada | |
| Mexico | |
| Europe | Germany |
| France | |
| Italy | |
| Spain | |
| United Kingdom | |
| Poland | |
| Russia | |
| Rest of Europe | |
| Asia-Pacific | China |
| India | |
| Japan | |
| South Korea | |
| Australia | |
| Indonesia | |
| Vietnam | |
| Thailand | |
| Rest of Asia-Pacific | |
| South America | Brazil |
| Argentina | |
| Chile | |
| Rest of South America | |
| Middle East and Africa | Saudi Arabia |
| United Arab Emirates | |
| Egypt | |
| South Africa | |
| Morocco | |
| Rest of Middle East and Africa |
| By Feedstock Source | Municipal Solid Waste (MSW) | |
| Commercial & Industrial (C&I) Waste | ||
| Construction & Demolition (C&D) Waste | ||
| Agricultural Waste | ||
| Other Waste Streams | ||
| By Fuel Type | Solid RDF | |
| Liquid RDF | ||
| Gaseous RDF | ||
| By End User | Cement Manufacturing | |
| Power Generation | ||
| Combined Heat & Power (CHP) | ||
| Industrial Boilers | ||
| Waste-to-Energy Plants | ||
| Lime Industry | ||
| Steel & Metal Processing | ||
| Paper & Pulp | ||
| Other Industrial Applications | ||
| By Geography | North America | United States |
| Canada | ||
| Mexico | ||
| Europe | Germany | |
| France | ||
| Italy | ||
| Spain | ||
| United Kingdom | ||
| Poland | ||
| Russia | ||
| Rest of Europe | ||
| Asia-Pacific | China | |
| India | ||
| Japan | ||
| South Korea | ||
| Australia | ||
| Indonesia | ||
| Vietnam | ||
| Thailand | ||
| Rest of Asia-Pacific | ||
| South America | Brazil | |
| Argentina | ||
| Chile | ||
| Rest of South America | ||
| Middle East and Africa | Saudi Arabia | |
| United Arab Emirates | ||
| Egypt | ||
| South Africa | ||
| Morocco | ||
| Rest of Middle East and Africa | ||
Key Questions Answered in the Report
What is the projected value of refuse-derived fuel in 2031?
The refuse-derived fuel market is projected to reach USD 10.12 billion by 2031, growing at a 5.56% CAGR from 2026.
Why is cement manufacturing important for refuse-derived fuel?
Cement manufacturing held 43.5% of demand in 2025 and is forecast to grow at a 6.9% CAGR through 2031 because kilns need high-temperature alternative fuel.
Which feedstock is growing fastest for RDF production?
Commercial and industrial waste is forecast to grow at a 6.3% CAGR through 2031 because it can offer lower moisture and more consistent composition.
Which region is growing fastest for RDF use?
Asia-Pacific is forecast to grow at a 6.1% CAGR through 2031, supported by urban waste growth and cement-sector demand.
What limits wider use of refuse-derived fuel?
Moisture and quality variation can reduce calorific value, while transport costs can make long-distance road delivery uneconomic.
Which fuel format has the largest role in RDF supply?
Solid RDF held 90.8% share in 2025 because it works with established transport systems and cement kiln feeding equipment.