Market Overview
| Study Period | 2020 - 2030 |
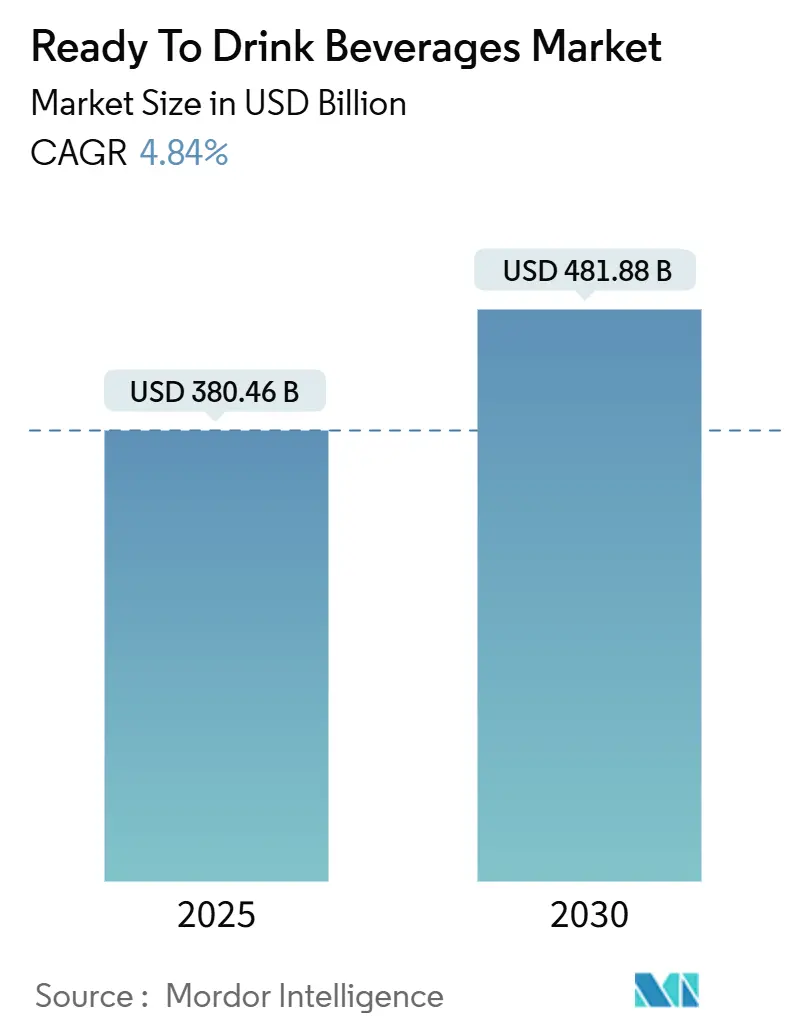
| Market Size (2025) | USD 380.46 Billion |
| Market Size (2030) | USD 481.88 Billion |
| Growth Rate (2025 - 2030) | 4.84% CAGR |
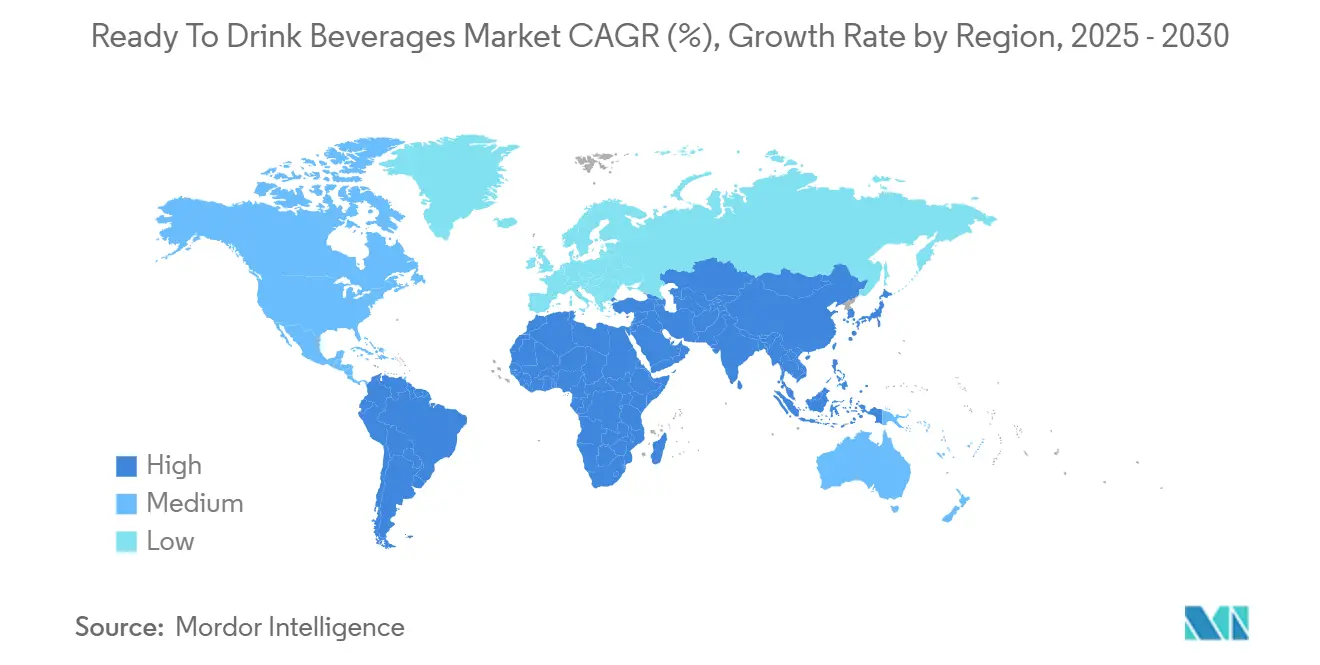
| Fastest Growing Market | South America |
| Largest Market | Asia Pacific |
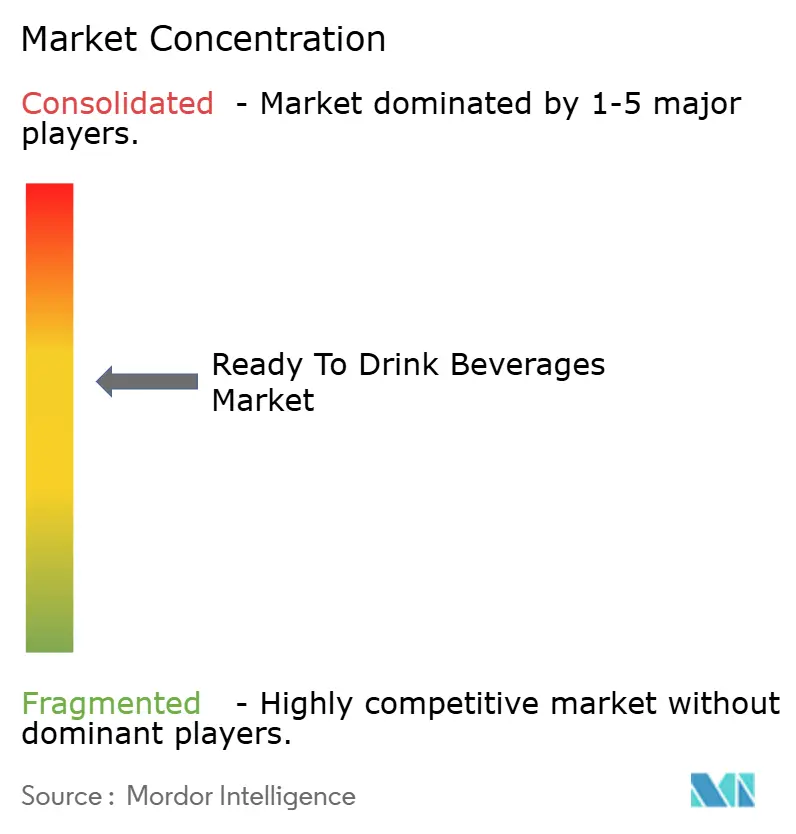
| Market Concentration | Medium |
Major Players*Disclaimer: Major Players sorted in no particular order Image © Mordor Intelligence. Reuse requires attribution under CC BY 4.0. |
|
Ready To Drink Beverages Market Analysis by Mordor Intelligence
The ready-to-drink beverages market, valued at USD 380.46 billion in 2025, is projected to surge to USD 481.88 billion by 2030, marking a steady CAGR of 4.84%. Households in developed nations have long embraced these products, while emerging markets are rapidly catching up. Urbanization, fast-paced lifestyles, and rising disposable incomes drive this trend. Globally, a shift towards healthier choices spans all demographics. Quick product launches focus on gut health, cognitive boosts, and immune support, while sustainability reshapes packaging. Competition is moderate, with global players facing agile start-ups targeting niche markets. Regulatory scrutiny on sugar and packaging waste limits and guides innovation. Manufacturers are adopting natural sweeteners, recycled materials, and clear labeling to enhance brand value and maintain margins.
Key Report Takeaways
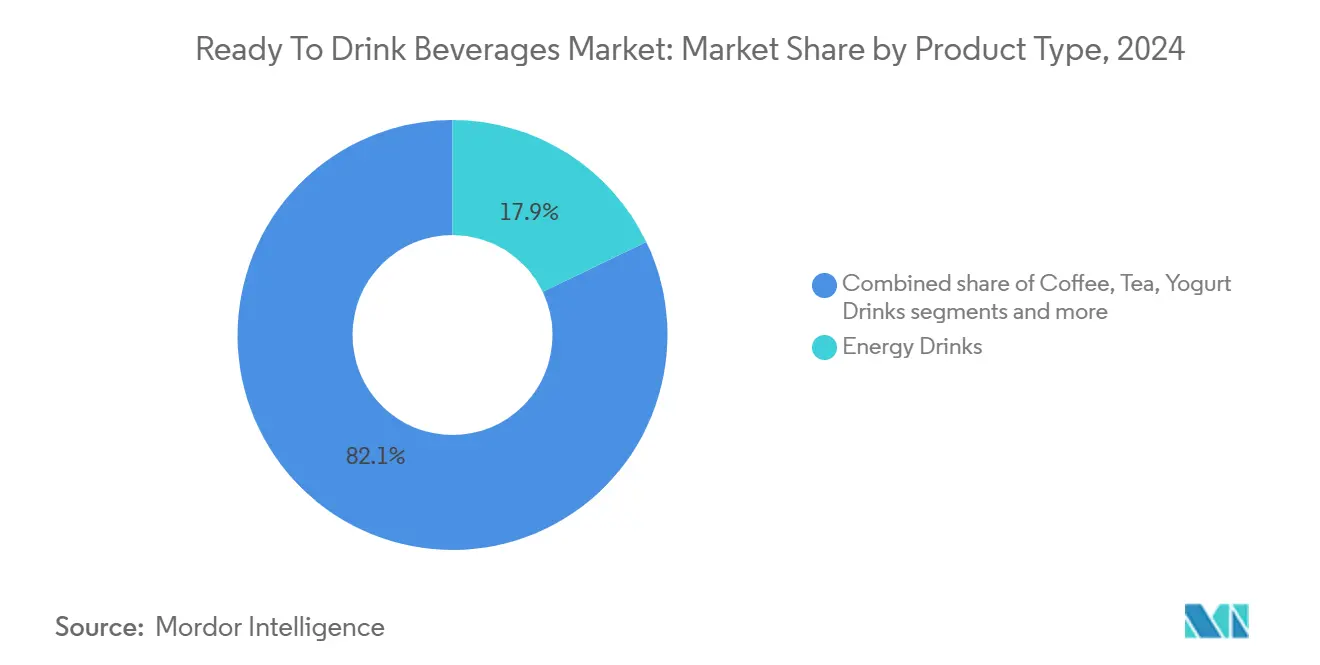
- By product type, energy drinks led with 17.88% revenue share in 2024, whereas dairy and dairy alternatives are projected to expand at a 5.24% CAGR through 2030.
- By ingredient, conventional inputs held 68.47% of the ready-to-drink beverages market share in 2024, while natural and organic beverages are on track for a 5.75% CAGR to 2030.
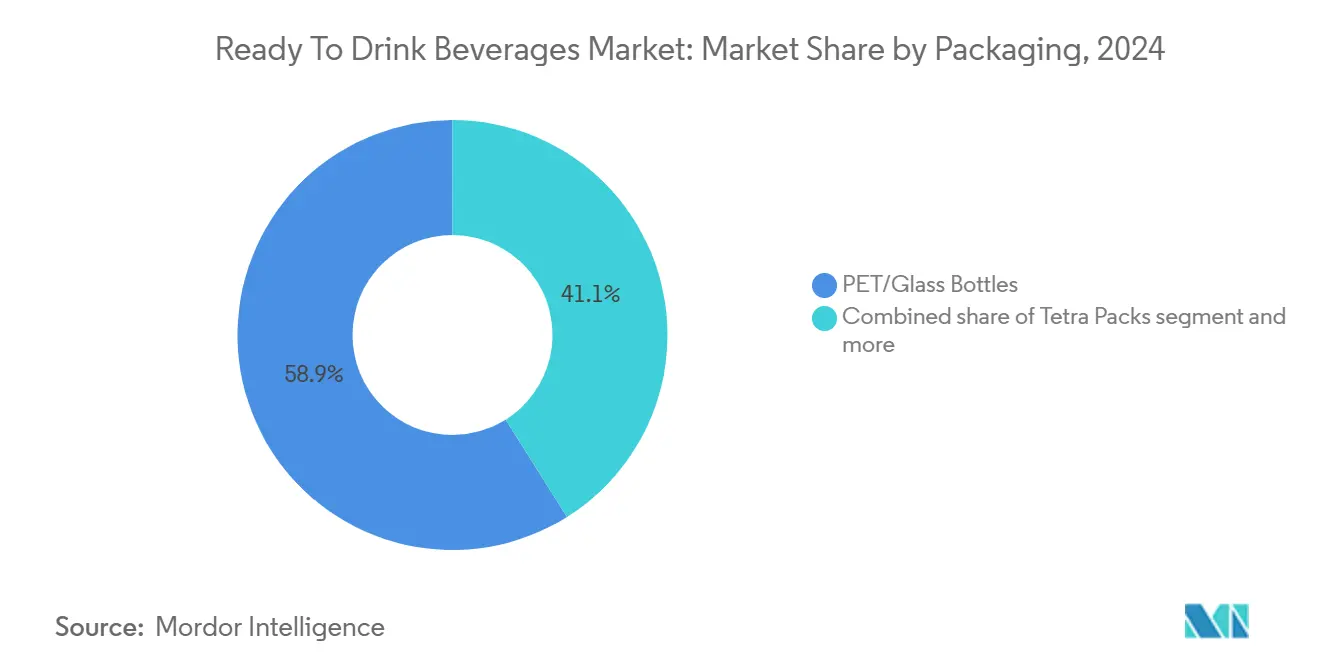
- By packaging, PET/glass bottles accounted for 58.99% of the ready-to-drink beverages market size in 2024; cans are set to grow at a 6.13% CAGR through 2030.
- By distribution channel, off-trade captured 80.23% of sales in 2024, with on-trade forecast to post a 5.01% CAGR to 2030.
- By region, Asia-Pacific dominated with a 33.26% share in 2024, while South America is expected to register the fastest 6.64% CAGR between 2025-2030.
Global Ready To Drink Beverages Market Trends and Insights
Drivers Impact Analysis
| Drivers | (~) % Impact on CAGR Forecast | Geographic Relevance | Impact Timeline |
|---|---|---|---|
| Increasing Demand For On-The-Go Healthy Beverages | +1.2% | Global, with stronger influence in North America, Europe, and Asia-Pacific urban centers | Medium term (2-4 years) |
| Consumer's Inclination Towards LowSugar/Sugar-Free Beverages | +1.0% | North America, Europe, and increasingly Asia-Pacific | Medium term (2-4 years) |
| Technological Advancement in terms of Production | +0.7% | North America, Europe, developed Asia-Pacific markets | Long term (≥ 4 years) |
| Innovation in Flavor, Ingredients and Packaging Format | +0.9% | Global, with early adoption in North America and Europe | Medium term (2-4 years) |
| Rising Participation in Sports and Fitness Activities | +0.6% | Global, particularly urban centers across all regions | Short term (≤ 2 years) |
| Growing Influence of Endorsements and Social Media Marketing | +0.5% | Global, with stronger impact among younger demographics | Short term (≤ 2 years) |
Source: Mordor Intelligence
Understand The Key Trends Shaping This Market
Download PDF
Increasing Demand For On-The-Go Healthy Beverages
As lifestyles grow busier and health awareness rises, consumer expectations are evolving. The World Health Organization highlights a global shift in recognizing nutrition's role in preventing chronic diseases, driving demand for functional beverages that combine health benefits with convenience. This trend spans all age groups, with older adults increasingly opting for ready-to-drink (RTD) beverages tailored to their needs. Urban centers, where professionals face time constraints, are key growth markets for RTD beverages. In 2024, the International Labour Organization reported that 57.92% of the global population was employed, reflecting the demand for convenient, health-focused options [1]Source: International Labour Organization, "Number of employees worldwide from 1991 to 2025", www.ilo.org. Brands that emphasize health benefits while maintaining RTD convenience are well-positioned for success. Additionally, government initiatives promoting reduced sugar intake and functional nutrients support the growth of health-oriented RTD beverages.
Consumer's Inclination Towards LowSugar/Sugar-Free Beverages
Global health initiatives are driving reduced sugar consumption, with the WHO recommending free sugars make up less than 10% of energy intake. This has increased regulatory pressure on beverage manufacturers, especially in regions with sugar taxes, to develop low-calorie alternatives without compromising taste. Regulatory approvals, such as the European Food Safety Authority's endorsement of natural sweeteners, have supported these efforts. However, manufacturers face challenges in balancing taste and reduced sugar content, prompting investments in alternative sweeteners and flavor technologies. The FDA's updated nutrition labels, highlighting added sugars, have raised consumer awareness, influencing demand for lower-sugar options. Growing awareness of sugar's health impact presents opportunities for brands that combine taste and health benefits. As a result, the reduced-sugar beverage market is expected to grow significantly during the forecast period, driven by innovation and regulatory compliance.
Innovation in Flavor, Ingredients and Packaging Format
The RTD beverage market is evolving through regulatory approvals for novel ingredients and advancements in sustainable packaging technologies. The FDA's GRAS program has approved functional ingredients like adaptogens and nootropics, enabling products with targeted health benefits. Simultaneously, the EPA promotes recyclable and biodegradable materials, driving sustainability efforts. Digital technologies, such as QR codes, are enhancing consumer engagement by providing product details and fostering transparency. Global standards like ISO's sustainable packaging guidelines are further influencing eco-friendly practices. The convergence of ingredient innovation and packaging advancements is transforming the market, aligning brands with health and environmental trends while meeting consumer preferences.
Rising Participation in Sports and Fitness Activities
Government health initiatives promoting physical activity are boosting demand for ready-to-drink (RTD) beverages offering hydration, nutrition, and performance benefits. In 2024, the Sports and Fitness Industry Association (SFIA) reported that 68.8% of the U.S. population participated in fitness sports, showing a slight increase from the previous year [2]Source: Sports and Fitness Industry Association, "Share of population who participate in fitness sports in the United States from 2013 to 2024", www.sfia.org. This trend expands the market beyond professional athletes to casual fitness enthusiasts and the general public. Innovations in RTD sports beverages include customized formulations, recovery-focused drinks, and hybrid options with added benefits like energy boosts or immune support. The International Olympic Committee's nutrition guidelines, emphasizing electrolyte balance and nutrient timing, influence product development. By aligning with health-focused initiatives and highlighting functional benefits, brands are positioned to drive growth and innovation in the sports beverage market.
Restraint Impact Analysis
| Restraint | (~) % Impact on CAGR Forecast | Geographic Relevance | Impact Timeline |
|---|---|---|---|
| Health Concerns Over Chemical Ingredients | -0.8% | North America, Europe, and increasingly Asia-Pacific | Medium term (2-4 years) |
| Consumer Inclination Towards Fresh Prepared Drinks | -0.6% | Global, particularly in health-conscious urban centers | Medium term (2-4 years) |
| Environmental Impact and Packaging Waste Concerns | -0.7% | Europe, North America, and increasingly Asia-Pacific | Long term (≥ 4 years) |
| Fluctuating Raw Material Prices | -0.5% | Global, with stronger impact in developing markets | Short term (≤ 2 years) |
Source: Mordor Intelligence
Health Concenrs Over Chemical Ingredients
RTD beverage manufacturers face challenges as global regulatory scrutiny of artificial ingredients grows. The European Food Safety Authority has tightened safety standards, while the FDA demands stronger safety data for synthetic additives. These pressures are significant for energy drinks and functional beverages, which often rely on synthetic components. Manufacturers are turning to natural alternatives, which meet regulatory and consumer demands but increase costs or reduce efficacy. In Canada, Health Canada’s new labeling rules require clearer disclosure of artificial ingredients, reshaping consumer habits. This has driven manufacturers to prioritize clean-label products while balancing shelf stability and costs. Companies are reformulating products and introducing natural ingredient offerings, though these changes impact supply chains, profitability, and efficiency. Despite challenges, the industry’s focus on innovation positions it to meet evolving expectations effectively.
Environmental Impact and Packaging Waste Concerns
Global environmental agencies and waste management authorities are increasingly scrutinizing beverage containers due to rising concerns over packaging waste. The European Union's Single-Use Plastics Directive mandates higher recycled content and improved collection systems for plastic beverage containers. Similarly, the U.S. Environmental Protection Agency is driving efforts to reduce packaging waste and promote circular economy principles, though compliance varies by state and municipality. Growing consumer awareness, fueled by environmental campaigns, has led the United Nations Environment Programme to prioritize beverage packaging in its waste reduction agenda, influencing global policies. While the industry invests in sustainable packaging, smaller producers face higher costs and technical challenges. Brands that overcome these hurdles can gain a competitive edge by aligning with consumer values and preparing for stricter regulations.
Segment Analysis
By Product Type: Energy Drinks Dominate Market Leadership
In 2024, energy drinks hold a 17.88% market share, driven by innovations in functional ingredients and a growing consumer base seeking benefits beyond energy boosts. Research from the International Energy Drink Association highlights strong consumption growth, especially among the 18-34 age group. Brands are reformulating offerings with natural caffeine and functional ingredients like L-theanine to provide balanced energy and avoid crashes. The FDA's caffeine guidelines have promoted transparent labeling and responsible marketing. Strong brand loyalty and premium pricing sustain this segment as consumers prioritize consistent performance for their dynamic lifestyles.
The dairy and dairy alternatives segment is projected to grow at a CAGR of 5.24% from 2025 to 2030, driven by rising awareness of protein and probiotic health benefits. The USDA's Dietary Guidelines support RTD dairy beverages as convenient nutrition sources. Manufacturers are creating high-protein products with 15-30 grams per serving to meet consumer demands. The FDA's recognition of probiotics and Health Canada's approval of probiotic strains have enabled innovation, allowing manufacturers to combine convenience with proven health benefits, driving segment growth.
Note: Segment shares of all individual segments available upon report purchase
By Ingredient: Conventional Ingredients Maintain Market Dominance
In 2024, conventional ingredients dominate the market with a 68.47% share, driven by established supply chains, clear regulatory pathways, and cost advantages. The FDA's safety database ensures predictable regulatory processes and lower development costs, making these ingredients essential for consistent quality and global distribution. Regulatory bodies like the European Food Safety Authority validate their safety, while consumer familiarity and cost-effectiveness strengthen their position, particularly in price-sensitive markets. Manufacturing efficiency and supply chain reliability further support high-volume production.
The natural and organic segment is projected to grow at a 5.75% CAGR from 2025-2030, driven by regulatory support for organic certification and increasing consumer preference for familiar ingredients. The USDA's National Organic Program establishes clear standards, boosting consumer confidence and enabling premium pricing. Health Canada's endorsement of natural health products and their therapeutic claims further supports this growth, allowing manufacturers to highlight specific health benefits. International organic standards, led by entities like the International Federation of Organic Agriculture Movements, facilitate global trade and enhance consumer recognition [3]Source: IFOAM - Organic International, "How can Organic Thrive in extreme heat?", ifoam.bio. Additionally, advancements in natural preservation and ingredient processing enable manufacturers to create clean-label products that rival conventional ones.
By Packaging: PET/Glass Bottles Lead Market Share
In 2024, PET and glass bottles hold a 58.99% market share due to consumer familiarity, versatility, and strong recycling infrastructure supported by government initiatives. The Container Recycling Institute highlights high recycling rates for glass and an evolving PET recycling framework. The FDA's approval of recycled PET for food use enhances its sustainability image. Glass packaging, promoted by the Glass Packaging Institute, offers limitless recyclability, premium appeal, and product integrity without flavor interference. Established supply chains and manufacturing setups provide cost benefits, crucial for high-volume production in mainstream beverages where packaging costs impact retail prices.
Cans are projected to grow at a 6.13% CAGR from 2025-2030, driven by recyclability and lightweight transport, aligning with sustainability goals. The Aluminum Association identifies aluminum cans as leaders in recycling rates, resonating with eco-conscious consumers and regulators. The EPA emphasizes aluminum recycling's role in the circular economy. Cans protect products from light and oxygen, ensuring quality for functional beverages with delicate ingredients. Innovations in can manufacturing, such as intricate graphics and enhanced features, and promotion by the Can Manufacturers Institute further support the segment's growth.
Note: Segment shares of all individual segments available upon report purchase
By Distribution Channel: Off-Trade Dominates Market Access
In 2024, the Off-Trade channel leads the RTD beverage distribution market with an 80.23% share, driven by robust retail infrastructure and consumer preference for convenience. Research from the Food Marketing Institute highlights a growing trend in retail grocery shopping, with impulse buying and promotions boosting RTD beverage volumes. Supermarkets and hypermarkets dominate, while convenience stores cater to immediate consumption. Data from the USDA confirms retail food sales' dominance in food and beverage purchases. A strong cold chain and efficient inventory systems ensure quality and availability for temperature-sensitive RTD items like dairy-based drinks and premium functional beverages.
The On-Trade segment, though smaller, is projected to grow at a 5.01% CAGR from 2025 to 2030, driven by foodservice recovery and premium-priced offerings. Research from the National Restaurant Association shows rising foodservice sales, creating opportunities for RTD brands in bars, restaurants, and entertainment venues. Foodservice operators value RTD products for consistent quality, reduced labor, and simplified inventory. The International Foodservice Distributors Association highlights growing RTD adoption in commercial settings. The segment benefits from premium pricing and brand-building opportunities in upscale hospitality, while alcohol regulations create structured avenues for alcoholic RTD products in licensed venues.
Geography Analysis
In 2024, the Asia-Pacific region leads the global ready-to-drink (RTD) beverages market with a 33.26% share. This dominance stems from urbanization, a growing middle class, and a shift toward convenience and functionality. Government initiatives emphasizing food safety and nutrition further drive growth. For instance, China's National Health Commission includes functional beverages in dietary guidelines, while India's Food Safety and Standards Authority enforces regulations for functional foods and beverages. The region's diverse preferences shape unique product offerings, supported by improved cold chain infrastructure and modern retailing. Japan's Ministry of Health, Labour and Welfare highlights functional beverage benefits, enabling credible health claims that appeal to consumers.
South America is set to grow fastest, with a CAGR of 6.64% from 2025 to 2030, driven by rising incomes and lifestyle changes favoring RTD beverages. Brazil's National Health Surveillance Agency (ANVISA) has simplified regulations for functional beverages, expediting approvals. The region leverages its agricultural resources to produce beverages with indigenous ingredients for local and export markets. Argentina's mandatory nutrition labeling boosts transparency and demand for healthier options. While fresh beverages dominate, manufacturers can overcome challenges by focusing on quality and natural ingredients. Government health campaigns promoting balanced nutrition further support functional beverage growth.
North America maintains a strong position, balancing innovation with strict safety and quality standards. The FDA's oversight on ingredients and labeling guides manufacturers, fostering innovation in functional RTD products. Health Canada's Natural Health Products Regulations allow manufacturers to highlight approved functional ingredients' benefits, enabling premium branding and consumer education. In Europe, the European Food Safety Authority's stringent approval process ensures safety while encouraging innovation. In the Middle East and Africa, urbanization and a youthful population drive RTD adoption, though diverse regulations require tailored strategies and collaboration with local authorities.
Competitive Landscape
The RTD beverages market is moderately consolidated, with global giants and regional players competing in segments such as tea, coffee, energy drinks, and functional beverages. Large corporations dominate the market due to their extensive product portfolios and strong distribution networks. However, mid-sized and niche brands continue to drive innovation, creating opportunities for new products and ideas. This competitive environment encourages affordable pricing, unique flavor developments, and the introduction of health-focused products. Leading companies in this market include The Coca-Cola Company, Red Bull GmbH, Nestle S.A., Monster Beverage Corporation, and PepsiCo, Inc.
Market strategies reveal a dual approach: expanding product portfolios to meet changing consumer demands while also focusing on specialized sub-brands to target niche markets. Major players are diversifying their offerings to capture a broader audience while simultaneously developing products tailored to specific consumer needs. The energy drinks segment, in particular, is highly competitive, with companies like Monster Beverage and Red Bull facing increasing challenges. Monster's co-CEO has acknowledged the heightened competition, especially from emerging brands like Celsius, which are gaining traction in the market.
Opportunities for growth lie in hybrid beverages that combine elements from different categories, personalized nutrition solutions, and premium non-alcoholic drinks that offer sophisticated flavors without alcohol. Emerging brands like Olipop and Poppi are disrupting traditional categories with innovative functional formulations. PepsiCo's acquisition of Poppi for USD 1.95 billion highlights the significant potential of these new approaches and their ability to reshape the market.
Ready To Drink Beverages Industry Leaders
-
The Coca-Cola Company
-
Red Bull GmbH
-
Nestle S.A
-
Monster Beverage Corporation
-
PepsiCo, Inc.
- *Disclaimer: Major Players sorted in no particular order
Need More Details on Market Players and Competitors?
Download PDF
Recent Industry Developments
- April 2025: International Delight has launched new Cinnabon Iced Coffee cans in partnership with the iconic bakery, blending the flavors of cinnamon rolls and cream cheese frosting into a convenient, ready-to-drink 15-ounce can available year-round at grocery, convenience, and dollar stores nationwide for USD 2.68, according to the brand.
- April 2025: Meiji expanded its beverage portfolio by launching a ready-to-drink (RTD) coffee beverage with whole oats under its Meiji Marugoto Oats product line. According to the brand, the formulation incorporates 6% whole oat flour and 12 g of whole grain oats per unit, delivering dietary fiber and beta-glucan content. The product is available in 200 ml cartons at JPY 162.
- April 2025: Lipton Ice Tea has launched a new twist on RTD tea with Lipton Fusions: a lemonade iced tea infused with fruit flavor. According to the brand, the drink comes in two flavors: strawberry lemonade and pineapple mango lemonade.
- February 2025: Red Bull has launched its 2025 Summer Edition White Peach energy drink, available nationwide in both regular and sugar-free versions, and packaged in vibrant magenta cans. According to the brand, this limited-time flavor features the taste of white peach with hints of citrus peel and floral notes, offering a refreshing twist for summer and maintaining the same core energy-boosting ingredients as the original Red Bull.
Global Ready To Drink Beverages Market Report Scope
Ready-to-drink beverages are a packaged form of drinks that are sold in the prepared form and are ready for consumption.
The ready-to-drink beverages market is segmented into product type, distribution channel, and geography. By product type, the market is segmented into tea, coffee, energy drinks, yogurt drinks, dairy and dairy alternative beverages, flavored and fortified water, and other product types. By distribution channel, the market is segmented into supermarkets/hypermarkets, convenience/grocery stores, online stores, specialty retail stores, and other distribution channels. Based on geography, the market is segmented into North America (United States, Canada, Mexico, and Rest of North America), Europe (Spain, United Kingdom, Germany, France, Italy, Russia, and Rest of Europe), Asia-Pacific (China, Japan, India, Australia, and Rest of Asia-Pacific), South America (Brazil, Argentina, and Rest of South America), and Middle East and Africa (South Africa, Saudi Arabia, and Rest of Middle East and Africa).
For each segment, the market sizing and forecasts have been done based on value (USD).
| By Product Type | Tea | ||
| Coffee | |||
| Energy Drinks | |||
| Yogurt Drinks | |||
| Dairy and Dairy Alternatives | |||
| Flavored and Fortified Water | |||
| Other Product Types | |||
| By Ingredient | Conventional | ||
| Natural and Organic | |||
| By Packaging | PET/Glass Bottles | ||
| Tetra Packs | |||
| Cans | |||
| Other Packaging Types | |||
| By Distribution Channel | On-Trade | ||
| Off-Trade | Supermarkets/Hypermarkets | ||
| Convenience/Grocery Stores | |||
| Online Retail Stores | |||
| Other Distribution Channels | |||
| By Geography | North America | United States | |
| Canada | |||
| Mexico | |||
| Rest of North America | |||
| Europe | Germany | ||
| United Kingdom | |||
| Italy | |||
| France | |||
| Spain | |||
| Netherlands | |||
| Poland | |||
| Belgium | |||
| Sweden | |||
| Rest of Europe | |||
| Asia-Pacific | China | ||
| India | |||
| Japan | |||
| Australia | |||
| Indonesia | |||
| South Korea | |||
| Thailand | |||
| Singapore | |||
| Rest of Asia-Pacific | |||
| South America | Brazil | ||
| Argentina | |||
| Colombia | |||
| Chile | |||
| Peru | |||
| Rest of South America | |||
| Middle East and Africa | South Africa | ||
| Saudi Arabia | |||
| United Arab Emirates | |||
| Nigeria | |||
| Egypt | |||
| Morocco | |||
| Turkey | |||
| Rest of Middle East and Africa | |||
By Product Type
| Tea |
| Coffee |
| Energy Drinks |
| Yogurt Drinks |
| Dairy and Dairy Alternatives |
| Flavored and Fortified Water |
| Other Product Types |
By Ingredient
| Conventional |
| Natural and Organic |
By Packaging
| PET/Glass Bottles |
| Tetra Packs |
| Cans |
| Other Packaging Types |
By Distribution Channel
| On-Trade | |
| Off-Trade | Supermarkets/Hypermarkets |
| Convenience/Grocery Stores | |
| Online Retail Stores | |
| Other Distribution Channels |
By Geography
| North America | United States |
| Canada | |
| Mexico | |
| Rest of North America | |
| Europe | Germany |
| United Kingdom | |
| Italy | |
| France | |
| Spain | |
| Netherlands | |
| Poland | |
| Belgium | |
| Sweden | |
| Rest of Europe | |
| Asia-Pacific | China |
| India | |
| Japan | |
| Australia | |
| Indonesia | |
| South Korea | |
| Thailand | |
| Singapore | |
| Rest of Asia-Pacific | |
| South America | Brazil |
| Argentina | |
| Colombia | |
| Chile | |
| Peru | |
| Rest of South America | |
| Middle East and Africa | South Africa |
| Saudi Arabia | |
| United Arab Emirates | |
| Nigeria | |
| Egypt | |
| Morocco | |
| Turkey | |
| Rest of Middle East and Africa |
Need A Different Region or Segment?
Customize Now
Key Questions Answered in the Report
What is the current size of the global ready-to-drink beverages market?
The market reached USD 380.46 billion in 2025 and is projected to grow at a 4.84% CAGR through 2030.
Which product category holds the largest share?
Energy drinks lead with 17.88% of 2024 revenues, supported by strong brand loyalty and continuous functional upgrades.
Which region is expanding the fastest?
South America is forecast to post the highest growth at a 6.64% CAGR between 2025-2030, fueled by rising incomes and innovation with indigenous ingredients.
What packaging format dominates sales today?
PET and glass bottles account for 58.99% of global volume, benefiting from established filling lines and widespread recycling infrastructure.
Page last updated on: July 3, 2025

