Market Overview
| Study Period | 2020 - 2031 |
|---|---|
| Forecast Data Period | 2026 - 2031 |
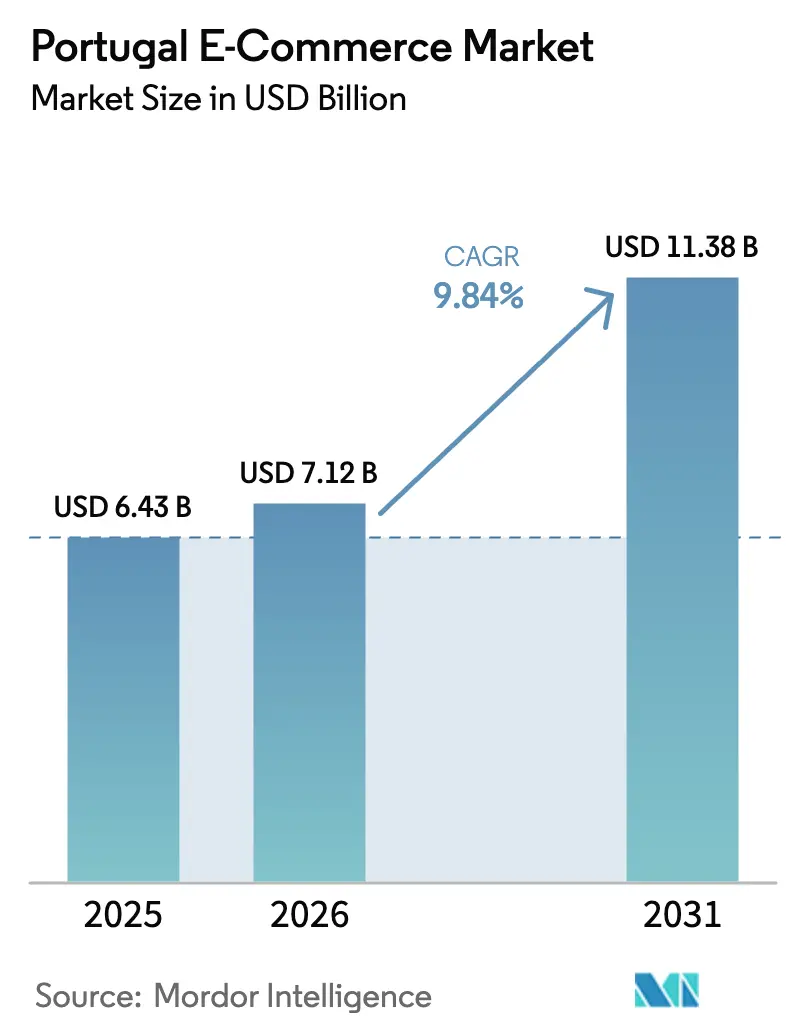
| Base Year Market Size (2025) | USD 6.43 Billion |
| Market Size (2026) | USD 7.12 Billion |
| Market Size (2031) | USD 11.38 Billion |
| Growth Rate (2026 - 2031) | 9.84% CAGR |
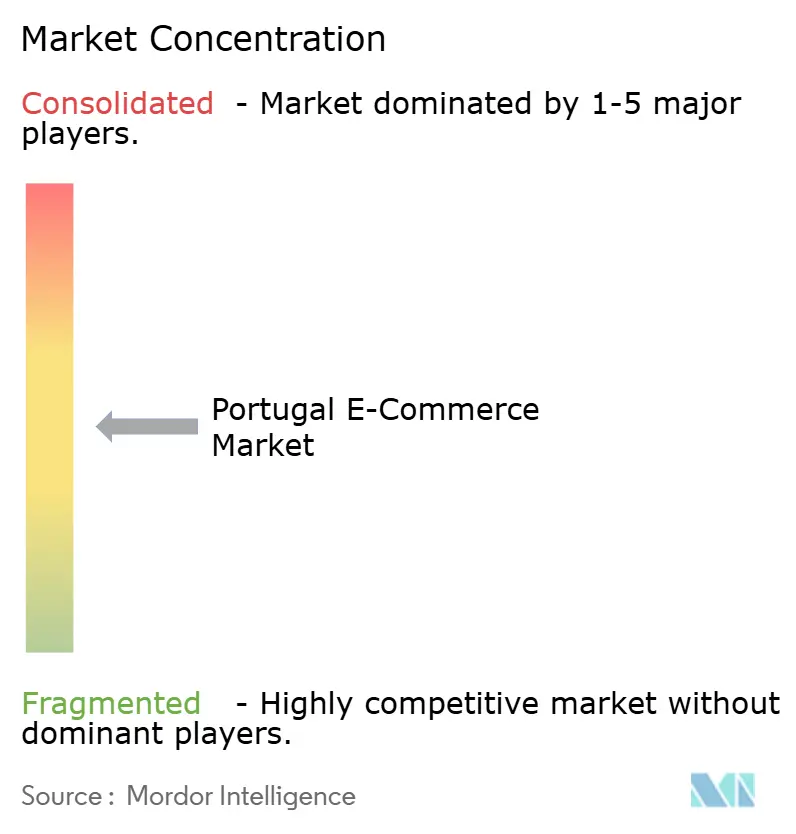
| Market Concentration | Medium |
Major Players *Disclaimer: Major Players sorted in no particular order Image © Mordor Intelligence. Reuse requires attribution under CC BY 4.0. | |
Portugal E-commerce Market Analysis by Mordor Intelligence
The Portugal E-commerce Market size is projected to be USD 6.43 billion in 2025, USD 7.12 billion in 2026, and reach USD 11.38 billion by 2031, growing at a CAGR of 9.84% from 2026 to 2031. The outlook reflects how smartphone-centric shopping behavior, EU-backed SME digitalization grants, and sustained logistics upgrades continue to widen the addressable shopper base and compress delivery times. Larger platforms are investing heavily in automated fulfillment hubs, while domestic chains accelerate omnichannel programs to protect share against multinational entrants. Momentum is strongest in mobile checkout and digital-wallet adoption, both of which lower friction for first-time buyers and older cohorts. Quick-commerce expansion beyond Lisbon and Porto, together with policy-driven B2B uptake, creates additional layers of demand that reinforce the positive growth trajectory.
Key Report Takeaways
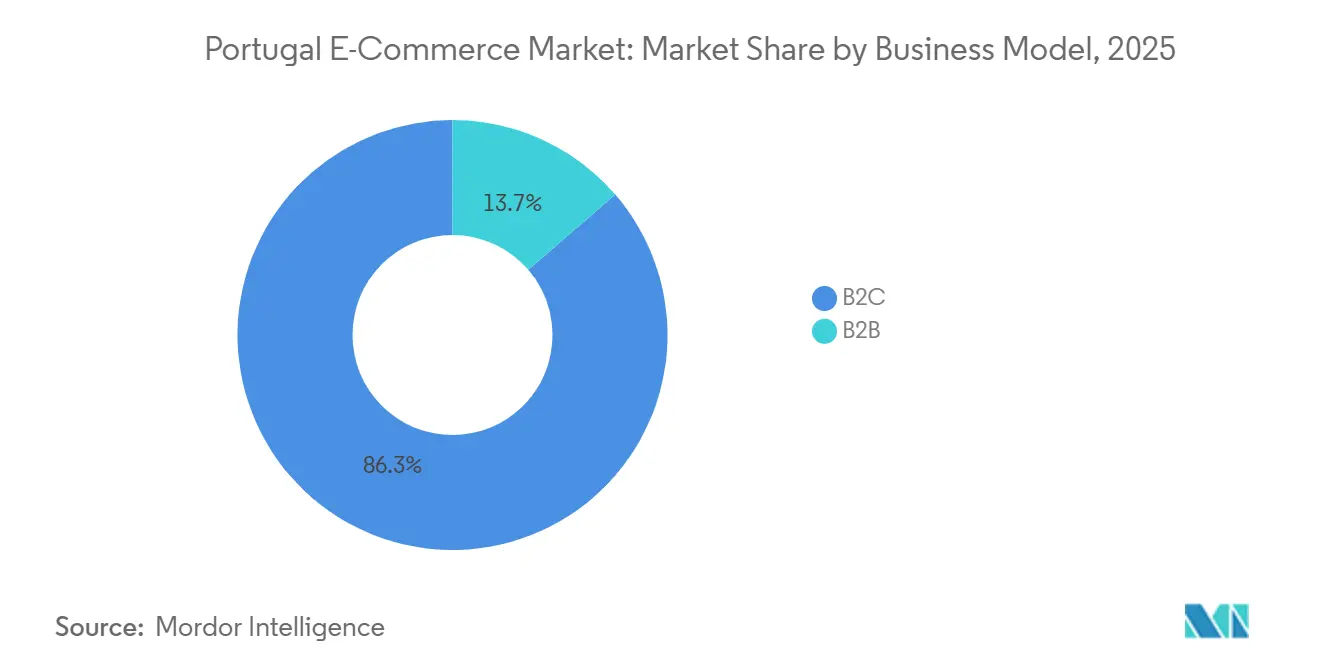
- By business model, consumer transactions held 86.34% revenue share of the Portugal E-commerce Market in 2025, while B2B is forecast to expand at an 11.27% CAGR through 2031.
- By device type, smartphones captured 71.42% of the Portugal E-commerce Market in 2025 and will grow at a 10.31% CAGR, outpacing desktops.
- By payment method, cards retained a 43.68% share in the Portugal E-commerce Market in 2025, yet digital wallets will advance at a 13.62% CAGR to 2031.
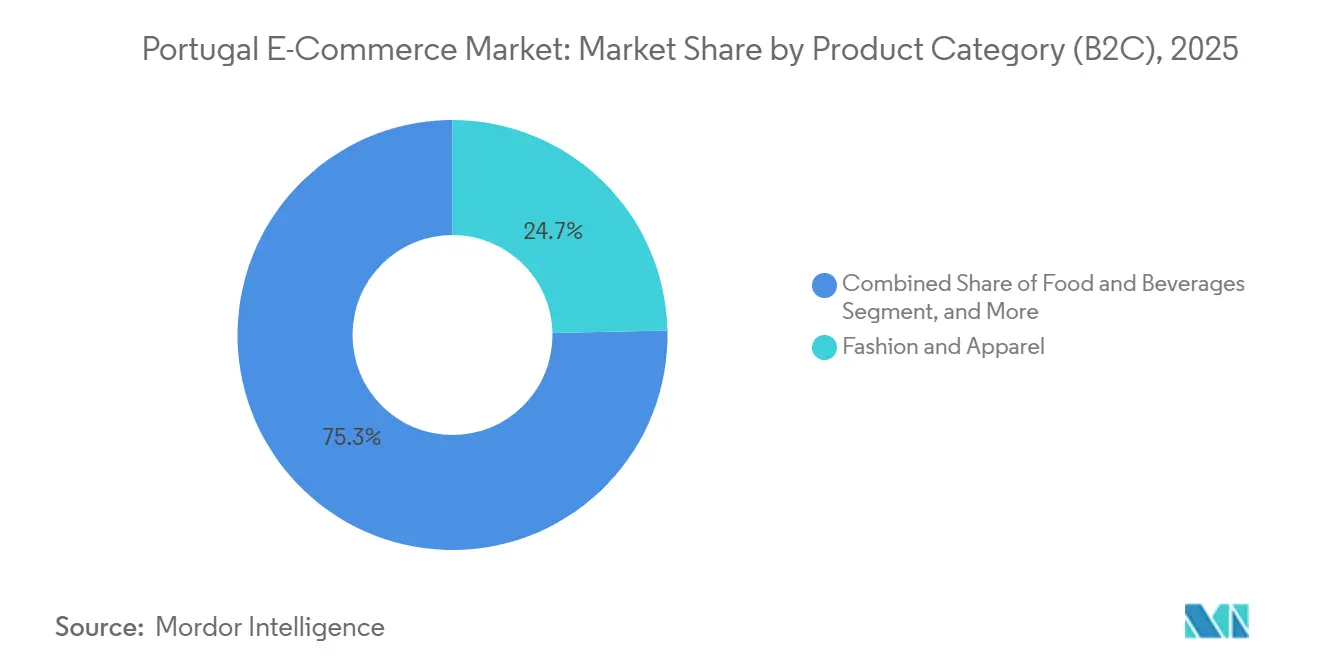
- By product category, fashion led with 24.67% of the Portugal E-commerce Market in 2025, whereas food and beverages are projected to post a 12.23% CAGR through 2031.
Note: Market size and forecast figures in this report are generated using Mordor Intelligence’s proprietary estimation framework, updated with the latest available data and insights as of January 2026.
Portugal E-commerce Market Trends and Insights
Drivers Impact Analysis*
| Driver | (~) % Impact on CAGR Forecast | Geographic Relevance | Impact Timeline |
|---|---|---|---|
| Surging mobile-commerce adoption | 1.80% | Lisbon and Porto metropolitan areas | Short term (≤ 2 years) |
| Rapid uptake of digital wallets | 2.10% | Nationwide, highest in urban centers | Medium term (2-4 years) |
| EU Recovery and Resilience Funds for SMEs | 1.50% | Nationwide, focus on interior regions | Medium term (2-4 years) |
| Logistics upgrades by CTT and DHL | 1.60% | Nationwide, early gains along Lisbon-Porto-Braga corridor | Short term (≤ 2 years) |
| Tourism-driven seasonal demand | 1.30% | Algarve, Lisbon, Porto, islands during peak seasons | Short term (≤ 2 years) |
| Growth of near-sourcing micro-factories | 0.90% | Lisbon and Porto, possible expansion to Braga | Long term (≥ 4 years) |
| Source: Mordor Intelligence | |||
Surging Mobile-Commerce Adoption Driven by Lisbon and Porto Consumers
Portugal achieved near-saturation smartphone penetration among 18-to-54-year-olds by 2024, and retailers deepened engagement in 2025 by refining app checkouts and embedding biometric authentication.[1]ANACOM, “48.9% of Residents Made Online Purchases in 2024,” anacom.pt Dense urban geographies support next-day or same-day delivery promises that encourage impulse purchases via mobile apps. Features such as augmented-reality visualization in Worten’s app raise conversion in home categories. Payment Services Directive 2 compliance initially added authentication steps but ultimately boosted trust, helping mobile surpass desktop for both browsing and checkout.[2]European Commission, “Payment Services Directive 2,” ec.europa.eu Forward momentum continues as location-based promotions and loyalty-wallet integration improve lifetime value.
Rapid Uptake of Digital Wallets Enabled by Multibanco and MB Way
MB Way leverages the country’s legacy ATM rail to remove friction from wallet enrollment, attracting 6 million users and accounting for roughly 45% of e-commerce transactions by late 2025. Zero-fee peer transfers train consumers to preload balances, reducing card reliance at checkout. Klarna’s 2025 arrival layered buy-now-pay-later options onto this wallet-first culture and spurred banks to add instant cashback and loyalty redemptions. Together, these features raise basket sizes and bring younger shoppers, who dislike revolving credit, into higher-value categories.
EU Recovery and Resilience Funds Accelerating SME Web-Shop Launch
Portugal has earmarked EUR 16.6 billion (USD 17.7 billion) for digital transformation, including grants that offset storefront-development costs for small firms.[3]European Commission, “Portugal’s Recovery and Resilience Plan,” commission.europa.eu The Simplex+ initiative shortens business registration cycles, while phased electronic-invoicing mandates create the backbone for real-time B2B and B2C trade. The majority of firms had adopted source-to-pay tools by 2024, underscoring commitment even among capital-constrained SMEs. Interior regions, once retail deserts, now see artisans of wine and olive oil selling nationwide, widening the Portugal E-commerce Market footprint without new physical stores.
Logistics Upgrades by CTT and DHL Cutting Average Delivery Time Below 24 Hours
The 2024 CTT-DHL alliance merges international linehaul with domestic last-mile assets, targeting sub-24-hour delivery in Lisbon and Porto by mid-2026.[4]CTT, “CTT and DHL Strategic Parcel Partnership,” ctt.pt CTT plans annual capex of EUR 50-55 million (USD 59-65 million) through 2028 to automate hubs and roll out electric vans, lowering cost per parcel and emissions. Worten’s 115,000-square-meter facility, under construction since July 2025, will process 10,000 orders per hour when fully operational. Faster handoffs raise customer satisfaction and attract cross-border sellers that previously prioritized Spain due to Portugal’s longer lead times.
Restraints Impact Analysis*
| Restraint | (~) % Impact on CAGR Forecast | Geographic Relevance | Impact Timeline |
|---|---|---|---|
| Persistent Last-Mile Costs in Rural Algarve and Islands | -1.9% | Rural Algarve, Azores, Madeira archipelagos | Long term (≥ 4 years) |
| Higher Return Rates in Fashion Raising Reverse-Logistics Expenses | -1.3% | National, concentrated in urban fashion retail segments | Medium term (2-4 years) |
| Low Digital Skills in 55+ Cohort Limiting Shopper Pool | -0.8% | National, with rural concentration effects | Long term (≥ 4 years) |
| Stricter EU Digital Services Act Compliance Costs for SMEs | -0.7% | National, disproportionate impact on smaller merchants | Short term (≤ 2 years) |
| Source: Mordor Intelligence | |||
Persistent Last-Mile Costs in Rural Algarve and Islands
Deliveries to Azores, Madeira, and thinly populated Algarve districts can cost twice the mainland average, with two- to three-day lead times common. Surcharges of EUR 3-EUR 5 per order deter smaller merchants from offering free shipping, limiting product choice for island residents. Seasonal tourism spikes intensify bottlenecks just as labor pools rotate. Crowdsourced driver pilots exist but face regulatory uncertainty over employment status, slowing scale-up.
Higher Return Rates in Fashion Raising Reverse-Logistics Expenses
Online fashion return rates routinely top 30%, driven by fit uncertainty and consumer habit of multi-size purchasing. Each return requires inspection, repackaging, and transport, often at the retailer’s expense. Inditex mitigates costs by channeling returns into stores, yet pure-play sellers lack this option and must swallow higher per-order logistics expenses. Elevated reverse costs compress margins in the Portugal E-commerce Market, particularly for cross-border merchants shipping from Spain or France.
*Our forecasts treat driver/restraint impacts as directional, not additive. The impact forecasts reflect baseline growth, mix effects, and variable interactions.
Segment Analysis
By Business Model: B2B Digitalization Extends Market Reach
B2B transactions accounted for 13.66% of the Portugal E-commerce Market in 2025, but the segment is forecast to outpace the headline CAGR at 11.27% through 2031. Mandatory e-invoicing across public procurement created shared data standards that enterprises now deploy in inter-company trade, slashing manual paperwork and accelerating cash conversion cycles. This compliance push, supported by EU grants, expands the Portugal E-commerce Market size for B2B platforms and encourages SMEs to join emerging vertical marketplaces. Cross-border exporters also benefit, as EN 16931 standards ease Spanish and French buyer onboarding.
The consumer side remains larger in absolute revenue, yet its growth moderates as penetration climbs. Marketing budgets continue to favor retail channels, but merchants increasingly allocate resources to B2B storefronts that deliver predictable order frequency. Procurement managers value the audit trail embedded in e-invoicing, driving loyalty despite lower promotional activity. Together, these patterns elevate overall digital maturity and diversify revenue sources.


By Device Type (B2C): Smartphones Cement Dominance in Checkout
Smartphones commanded 71.42% of transaction volume in 2025 and are forecast for a 10.31% CAGR to 2031, embedding mobile as the default storefront. Retailers center design roadmaps on app speed, biometric sign-in, and one-tap wallets, which together lift conversion among older first-time shoppers. The Portugal E-commerce Market share for desktops continues to slide as enterprise buyers migrate procurement tasks onto secure mobile VPN apps, closing the gap between home and office workflows.
Secondary device classes evolve in role rather than scale. Tablets remain favored by older cohorts who seek larger screens; voice-assistant reordering gains relevance in grocery and pet-care replenishment; connected-TV shopping links promotional video with scratch-proof QR codes for instant purchase. Payment Services Directive 2 compliance accelerated biometric adoption, reinforcing consumer trust in mobile security.
By Payment Method (B2C): Digital Wallets Overtake Card Reliance
Credit and debit cards still held a 43.68% share in 2025, yet digital wallets are on track for a 13.62% CAGR, steered by MB Way ubiquity and Klarna’s deferred-payment features. Strong peer-to-peer uptake acclimates users to funding wallets, while instant refund capability lowers perceived risk. The Portugal E-commerce Market size attached to wallet payments widens fastest in fashion, electronics, and travel, where flexible installments spur higher average order values.
Buy-now-pay-later tools remain niche in absolute volume but grow triple-digit on a small base. Banks respond with cobranded wallets that embed loyalty rewards, seeking to defend interchange revenue. Other instruments, bank transfers, and cash on delivery retain importance for rural shoppers wary of digital payments, but are steadily losing ground to wallet convenience.
By Product Category (B2C): Food Delivery Accelerates Beyond Fashion Leadership
Fashion and apparel generated 24.67% of revenue in 2025, yet its expansion rate is moderating due to near-saturation and elevated return costs. Food and beverages will post a 12.23% CAGR through 2031, spearheaded by quick-commerce players promising 30-minute fulfillment. Glovo operates more than 2,500 merchant partnerships and leverages dark stores stocked with high-velocity items, pushing rapid-delivery expectations into groceries and convenience goods.
Beauty, personal care, and consumer electronics expand mid-single to high-single digits as influencers and product innovation drive repeat purchasing. Furniture adoption accelerates as augmented-reality visualization in mobile apps shrinks the consideration window and reduces measurement errors. The evolving mix spreads risk across verticals and cushions the Portugal E-commerce Market from category-specific slowdowns.

Geography Analysis
Urban concentration defines demand patterns, with Lisbon and Porto jointly accounting for roughly 60% of 2025 order volume. High population density and transport connectivity support next-day standards and entice early rollouts of experimental models such as 30-minute grocery delivery. Demand surges in the Algarve each summer as tourism peaks, lifting gross merchandise value for local artisans and experience platforms but exposing seasonal labor shortages that stretch last-mile capacity.
The Azores and Madeira archipelagos present structural logistics headwinds. Longer ferry and air routes add cost and a two-day lag compared with mainland benchmarks, discouraging small merchants from offering flat-rate shipping. Interior municipalities, supported by Recovery and Resilience grants, digitize rapidly despite sparse physical retail, selling regional wine, olive oil, and crafts nationwide through online storefronts.
Cross-border flows skew toward Spain and China, reflecting land-border convenience and ultra-low-price imports, respectively. EU single-market rules eliminate customs paperwork for intra-EU trade, encouraging Portuguese buyers to source electronics and niche hobby items from Spanish sites. As quick-commerce networks mature, secondary cities such as Braga and Coimbra are next in line for dark-store investment, broadening the Portugal E-commerce Market beyond the coastal core.
Competitive Landscape
Competitive intensity is rising but remains moderately fragmented. Amazon’s Portuguese-language site and Prime bundle pressure domestic sellers to match two-day delivery, sparking logistics capex such as Worten’s 115,000-square-meter automated hub scheduled for 2028 completion. Zalando’s October 2025 entry pushed mid-market fashion prices lower and forced incumbents to widen assortment breadth to retain shoppers.
Domestic chains defend loyalty through omnichannel integration. Continente pairs grocery click-and-collect with same-day dispatch via Glovo, while Fnac Darty introduced the Darty appliance brand to cross-sell after-sales services. Smaller specialists such as PCDIGA and Radio Popular emphasize Portuguese-language customer support and curated electronics assortments.
Policy shifts also shape competition. The Digital Services Act raises compliance costs that smaller marketplaces struggle to absorb, potentially consolidating share into larger players. White-space opportunities persist in B2B verticals: industrial supplies, foodservice equipment, and construction materials, where supplier fragmentation and opaque pricing invite marketplace aggregation. Technology adoption, augmented reality, voice commerce, and AI recommendation emerge as a differentiator as return-cost pressure motivates investments in fit and color accuracy.
Portugal E-commerce Industry Leaders
Inditex Group (Zara Portugal)
Worten
Amazon Inc.
Apple Inc.
Zalando Inc.
- *Disclaimer: Major Players sorted in no particular order

Recent Industry Developments
- January 2026: Klarna released a merchant toolkit that automates integration of Pay in 3 and Tap to Pay within Shopify storefronts, expanding reach to micro-retailers.
- December 2025: Klarna launched Tap to Pay in Portugal, enabling contactless acceptance on iPhone for merchants without extra hardware.
- November 2025: Klarna rolled out the Klarna Card, extending buy-now-pay-later to physical stores across the country.
- October 2025: Zalando began Portuguese operations offering more than 200,000 SKUs, shipping from its Illescas, Spain, center.


Research Methodology Framework and Report Scope
Market Definitions and Key Coverage
Our analysts define the Portuguese e-commerce market as every paid digital transaction in which a resident buyer uses an internet-enabled device to purchase physical goods or fee-based services that are fulfilled within Portugal or shipped from abroad. According to Mordor Intelligence, values are expressed as gross merchandise value (GMV) in U.S. dollars after converting euro sales with the yearly average exchange rate.
Scope Exclusions: Second-hand peer-to-peer deals, in-app micro-payments for gaming, and purely business-to-government platforms are outside the study.
Segmentation Overview
- By Business Model
- B2C
- B2B
- By Device Type (B2C)
- Smartphone / Mobile
- Desktop and Laptop
- Other Device Types
- By Payment Method (B2C)
- Credit and Debit Cards
- Digital Wallets
- BNPL
- Other Payment Methods
- By Product Category (B2C)
- Beauty and Personal Care
- Consumer Electronics
- Fashion and Apparel
- Food and Beverages
- Furniture and Home
- Toys, DIY and Media
- Other Product Categories
Detailed Research Methodology and Data Validation
Primary Research
Our team interviewed marketplace operators, parcel integrators, payment processors, and SME web-shop owners across Lisbon, Porto, and Algarve. These conversations clarified cart-level return rates, cross-border order shares, and realistic adoption timelines for digital wallets, enabling us to stress-test the secondary data and refine elasticities.
Desk Research
We began with structured pulls from Statistics Portugal, Eurostat retail trade dashboards, and the European Central Bank's payment instrument files, which gave baseline sales, card volumes, and average ticket sizes. Trade association briefs from ACEPI and Ecommerce Europe added shipment counts and shopper penetration by age group. Company filings, public earnings calls, and customs import records enriched category splits, while subscription datasets such as D&B Hoovers and Dow Jones Factiva helped trace revenue flows of leading platforms. This mix established the factual spine.
Government white papers on the EU Recovery and Resilience Plan, patent abstracts on logistics automation from Questel, and press coverage on 5G roll-outs supplied trend variables that anchor our demand drivers. The sources listed illustrate our approach; many more publications and databases were reviewed for accuracy and context.
Market-Sizing & Forecasting
Mordor's model starts with a top-down reconstruction of national e-commerce receipts reported by Statistics Portugal, which are then split by product class using payment processor share data and ACEPI shopper surveys. Supplier roll-ups of major retailers, plus sampled average selling price times volume checks, act as a bottom-up sense-check of totals. Key inputs include smartphone penetration, parcel delivery density, disposable income per capita, digital wallet transaction counts, cross-border order share, and return-rate trends; each variable is projected through multivariate regression, feeding an ARIMA overlay to capture seasonality. Gaps in line-item estimates are bridged with expert-validated ratios and three-year moving averages before final consolidation.
Data Validation & Update Cycle
Outputs pass variance filters against independent indicators such as VAT receipts and postal parcel volumes. Senior analysts review anomalies, and findings are peer-reviewed before sign-off. The model refreshes annually, with interim updates when policy shifts or macro shocks materially alter inputs.
Why Our Portugal E-commerce Baseline Commands High Credibility
Published figures often differ because every firm sets its own service mix, currency treatment, and refresh rhythm. We acknowledge these variations up front so users can see how scope choices ripple through the math.
Key gap drivers include whether services like travel or streaming are counted, how cross-border flows are handled, and the cadence at which exchange rates and inflation adjustments are rolled forward; Mordor updates all three every year, whereas others may freeze assumptions for longer.
Benchmark comparison
| Market Size | Anonymized source | Primary gap driver |
|---|---|---|
| USD 10.12 B (2024) | Mordor Intelligence | |
| USD 8.66 B (2024) | Global Consultancy A | Excludes fee-based services and uses 2023 shopper mix without mid-year refresh |
| USD 4.69 B (2024) | Data Platform B | Counts retail goods only and relies on modeled baskets with limited cross-border capture |
| USD 6.67 B (2024) | Research House C | Applies average 2023 forex and a pure top-down GDP share ratio |
The comparison shows that when scope is narrower or input updates lag, estimates skew lower, while our disciplined variable tracking and annual recalibration give decision-makers a balanced, transparent baseline they can readily audit.


Key Questions Answered in the Report
What is the current value of the Portugal E-commerce Market?
The market stands at USD 7.12 billion in 2026 and is forecast to expand to USD 11.38 billion by 2031.
Which device drives most online orders in Portugal?
Smartphones account for 71.42% of 2025 order volume and will remain the dominant checkout channel.
How fast are digital wallets growing in Portugal?
Wallet payments are projected to rise at a 13.62% CAGR through 2031, overtaking card usage in several categories.
Which product segment will grow the quickest?
Food and beverages leads with a forecast 12.23% CAGR, enabled by quick-commerce platforms that promise 30-minute delivery.
Why is B2B e-commerce important for Portuguese SMEs?
Mandatory electronic invoicing frameworks and EU grants are driving SMEs to digitize procurement, supporting an 11.27% CAGR in B2B transactions.
How fragmented is the competitive landscape?
The top five platforms hold roughly 40-50% share, giving the sector a moderate concentration profile and space for niche players to thrive.
Page last updated on:


