Polyoxymethylene (POM) Market Size and Share
Market Overview
| Study Period | 2021 - 2031 |
|---|---|
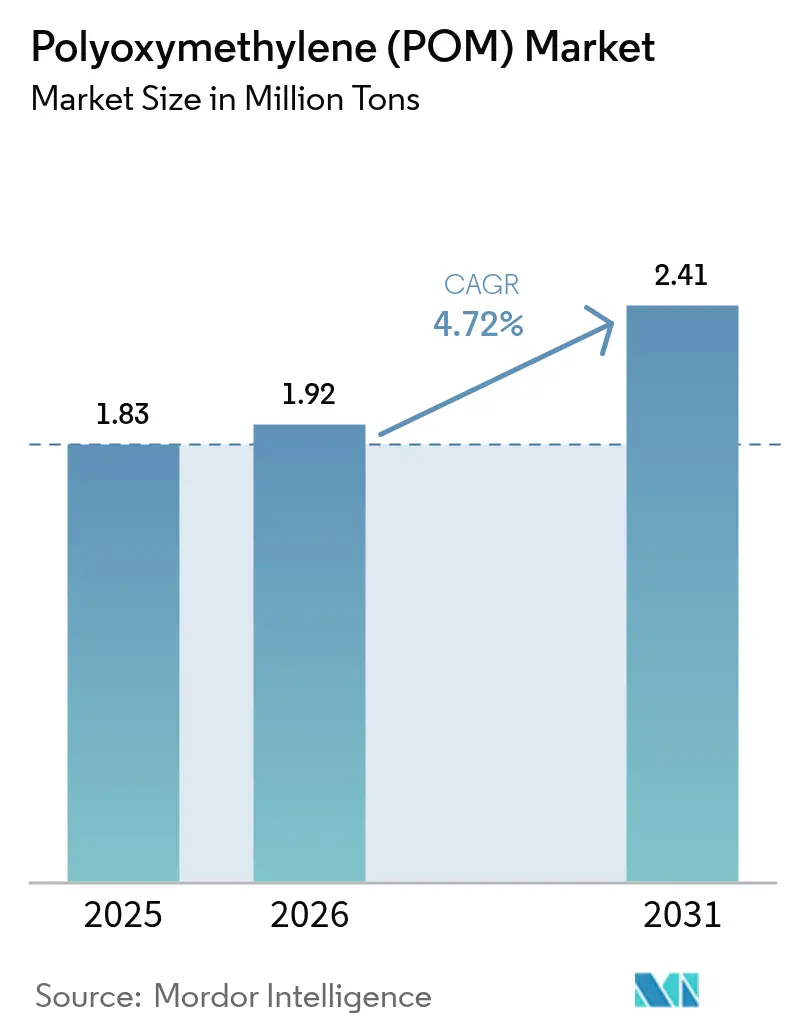
| Market Volume (2026) | 1.92 Million tons |
| Market Volume (2031) | 2.41 Million tons |
| Growth Rate (2026 - 2031) | 4.72% CAGR |
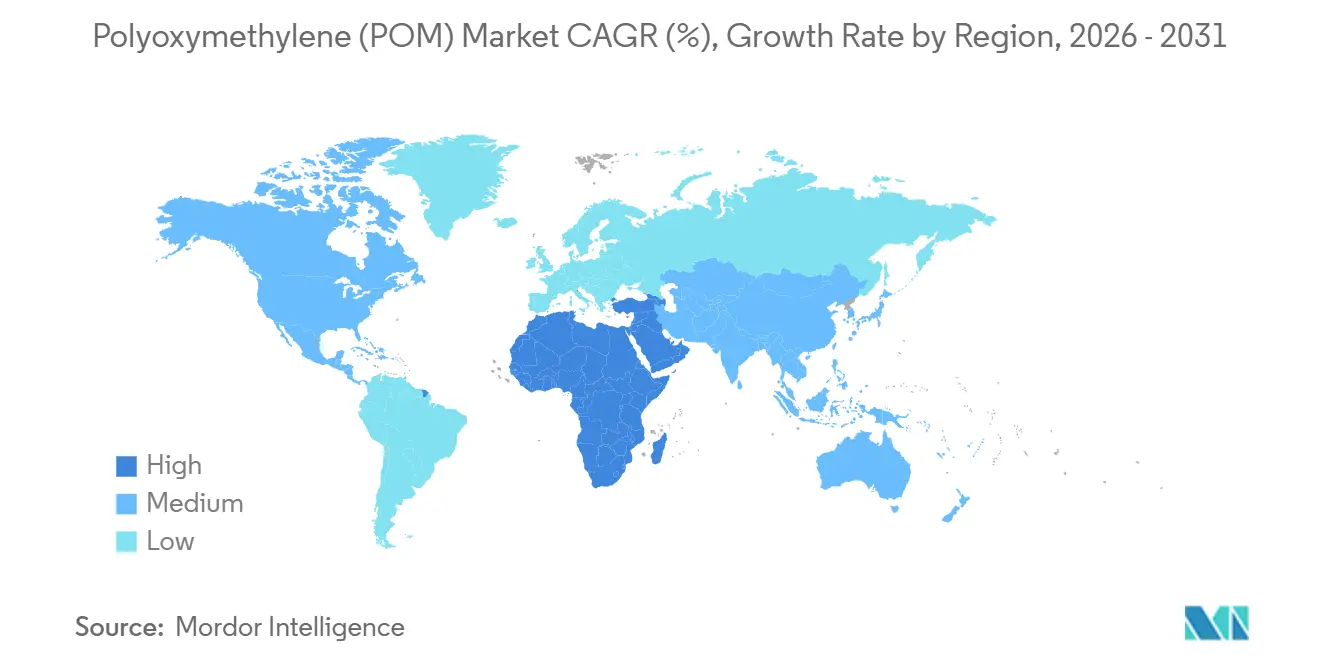
| Fastest Growing Market | Middle East and Africa |
| Largest Market | Asia Pacific |
| Market Concentration | Medium |
Major Players *Disclaimer: Major Players sorted in no particular order Image © Mordor Intelligence. Reuse requires attribution under CC BY 4.0. | |
Polyoxymethylene (POM) Market Analysis by Mordor Intelligence
The Polyoxymethylene Market size is projected to expand from 1.83 million tons in 2025 and 1.92 million tons in 2026 to 2.41 million tons by 2031, registering a CAGR of 4.72% between 2026 to 2031. Demand gains track three structural forces, namely vehicle lightweighting, electronics miniaturization, and regional manufacturing expansion. Automotive OEMs are substituting zinc and aluminum hardware with precision-molded POM parts to trim curb weight and comply with stringent fleet-average CO₂ caps. Connector makers in 5G infrastructure and wearable devices value POM’s superior creep resistance and 0.2% moisture absorption, attributes that keep tolerances tight as pitch widths shrink. Asia-Pacific dominates global volumes because integrated coal-to-POM complexes in China and cost-optimized logistics across ASEAN compress delivered resin costs compared with natural-gas routes in Europe and North America. Even so, the Middle East and Africa show the fastest regional climb, aided by Saudi and UAE automotive-assembly localization initiatives that pull new downstream polymers into the Gulf.
Key Report Takeaways
- By form type, sheet captured 64.88% of the polyoxymethylene market share in 2025. The sheet segment is projected to expand at a 5.15% CAGR through 2031.
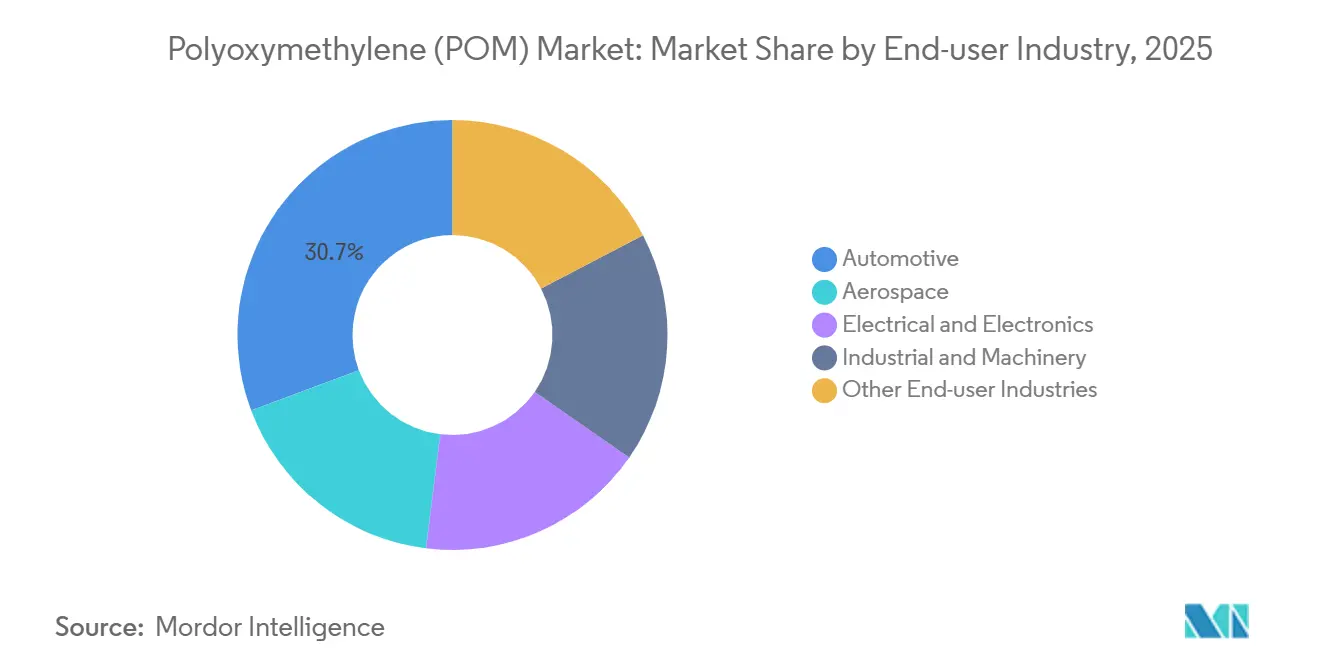
- By end-user industry, automotive held 30.71% of the polyoxymethylene market size in 2025. Aerospace is advancing at a 5.56% CAGR between 2026 and 2031.
- By geography, Asia-Pacific accounted for 66.72% of the polyoxymethylene market share in 2025. The Middle-East and Africa are forecast to register a 5.94% CAGR through 2031.
Note: Market size and forecast figures in this report are generated using Mordor Intelligence’s proprietary estimation framework, updated with the latest available data and insights as of 2026.
Global Polyoxymethylene (POM) Market Trends and Insights
Drivers Impact Analysis*
| Drivers | (~) % Impact on CAGR Forecast | Geographic Relevance | Impact Timeline |
|---|---|---|---|
| Automotive lightweighting boom | +1.2% | Global, with concentration in APAC and Europe | Medium term (2-4 years) |
| Miniaturisation in electrical and electronics | +0.9% | APAC core (China, Japan, South Korea), spill-over to North America | Short term (≤ 2 years) |
| Manufacturing expansion in Asia-Pacific | +1.0% | APAC (China, India, Vietnam, Malaysia) | Long term (≥ 4 years) |
| Tightening scrap-VOC limits for EV interiors | +0.7% | Europe, North America, China | Medium term (2-4 years) |
| Micro-gear demand in medical devices | +0.4% | North America, Europe, Japan | Long term (≥ 4 years) |
| Source: Mordor Intelligence | |||
Automotive Lightweighting Boom
Mass reduction stands out as the quickest and most cost-effective method to extend EV range. POM is now supplanting zinc die-cast gears and aluminum brackets, all while maintaining structural integrity[1]Celanese Corporation, “2025 Annual Filing,” celanese.com. In a bid to adhere to the bloc’s fleet CO₂ cap, European automakers are increasingly turning to POM for thin-wall seat-adjustment mechanisms. China's ambitious new-energy-vehicle mandate, aiming for increased EV sales, is driving a surge in demand for battery-tray covers, cooling-system housings, and window-regulator components. Thanks to POM’s creep resistance, manufacturers can achieve reductions in wall thickness compared to polyamide 6, shedding grams on every interior part. This edge ensures that the automotive sector remains the dominant end-use, even as aerospace experiences a quicker growth rate.
Miniaturization in Electrical and Electronics
Connector pitches keep shrinking to pack more signal paths per square millimeter in 5G base stations, wearables, and ADAS modules. POM’s moisture absorption and dimensional stability over 100 mm lengths satisfy those tight tolerances better than commodity polypropylenes. LEMO’s pitch series, released in 2024, relies on POM inserts for medical imaging and avionics, underscoring its role as the default choice where misalignment risks system failure. Japanese connector output is growing with POM inside micro-switches and IO ports expanding faster than overall electronics because each smaller device hosts more connectors.
Manufacturing Expansion in Asia-Pacific
China's coal-to-POM complexes achieve feedstock savings compared to traditional natural-gas methods. In 2025, India's automotive-component exports surged, prompting the establishment of new compounding lines and reducing the nation's reliance on imports from Japan and Germany. As electronics assembly shifts, both Vietnam and Malaysia benefit, with Malaysia's electronics revenue climbing. In a move to reduce lead times for regional OEMs, South Korea's Kolon-BASF inaugurated a plant in Ulsan.
Tightening Scrap-VOC Limits for EV Interiors
Starting January 2025, European Regulation 2024/1257 set a cap on cabin VOCs, compelling OEMs to switch to lower-emission resins[2]European Commission, “Regulation 2024/1257 on VOCs,” ec.europa.eu. Polyplastics’ DURACON LV, which reduces formaldehyde and acetaldehyde, has clinched design victories at Volkswagen and BMW for the interiors of the 2026 model year. China's updated GB/T 27630 is aligning with this trend, steering local compounders towards low-VOC chemistries. The rising compliance costs are creating hurdles for smaller suppliers, simultaneously bolstering the market share of larger integrated players.
Restraints Impact Analysis*
| Restraints | (~) % Impact on CAGR Forecast | Geographic Relevance | Impact Timeline |
|---|---|---|---|
| Competition from bio-based and high-performance plastics | -0.8% | Global, with higher intensity in Europe and North America | Medium term (2-4 years) |
| Raw-material price volatility and trade barriers | -0.6% | Global, with acute impact in import-dependent regions (North America, Europe) | Short term (≤ 2 years) |
| Methanol diversion to Sustainable Aviation Fuel value-chain | -0.3% | China, Europe | Long term (≥ 4 years) |
| Source: Mordor Intelligence | |||
Competition from Bio-Based and High-Performance Plastics
Arkema’s Rilsan PA11 gained traction in brake hoses and fuel lines in 2025, meeting renewable-carbon mandates while matching POM’s chemical resistance. Solvay’s glass-reinforced polyphthalamide displaced POM in turbocharger air ducts where continuous-use temperatures exceed 120 °C. Carbon pricing and single-use plastic directives narrow the historical cost premium, intensifying substitution pressure.
Raw-Material Price Volatility and Trade Barriers
Asian methanol spot prices surged, tightening the margins for non-integrated POM producers. U.S. antidumping duties on Chinese POM copolymer have further fragmented supply chains, compelling North American molders to opt for pricier European or Japanese resins. In India, similar tariffs and GST challenges inflate landed costs, dampening expansion efforts by smaller converters.
*Our forecasts treat driver/restraint impacts as directional, not additive. The impact forecasts reflect baseline growth, mix effects, and variable interactions.
Segment Analysis
By Form Type: Sheet Leads on Processing Efficiency
Sheet accounted for 64.88% of 2025 volume, reflecting its superior nesting efficiency for seat-recliner gears, conveyor guides, and FDA-compliant cutting boards. The polyoxymethylene market size for sheet applications is projected to rise at a 5.15% CAGR through 2031, outstripping rod and tube forms as automotive and food equipment specify wide plates that minimize scrap. Rod and tube remain essential for hydraulic pistons and medical-device shafts demanding ±0.02 mm roundness, yet CNC machining of billet stock tempers growth. Other forms—granules for injection molding and thin film—capture the residual share, with Mitsubishi Chemical’s thin-wall Iupital grades opening new cosmetic-package actuators in 2025.
Second-order tailwinds keep sheet in pole position: low-VOC chemistries debut first in high-throughput sheet extrusion, and automotive lightweighting favors large flat panels amenable to laser trimming. Even so, the influx of continuous-reactor capacity in China and South Korea is lowering rod and tube pricing, which could moderate sheet’s lead over the forecast horizon.


By End-User Industry: Aerospace Posts Quickest Climb
Automotive retained the largest tonnage at 30.71% in 2025 because every passenger EV contains dozens of POM gears and latches. Yet aerospace exhibits the strongest 5.56% CAGR, driven by micro-fuel pumps and cabin actuators that need POM’s dimensional stability and Skydrol resistance. The electrical and electronics sector is primarily driven by connector housings and switch bases used in 5G base stations. Industrial machinery also holds a significant share, although it's worth noting that ceramic and composite bearings are beginning to rival POM in applications requiring very high RPMs. While the aerospace allocation of the polyoxymethylene market may still lag behind automotive in sheer numbers, it's important to recognize that once a POM grade secures a type certificate, the FAA and EASA qualification cycles ensure revenue stability for decades.
Geography Analysis
Asia-Pacific consumed 66.72% of global volume in 2025. China's appetite, coupled with its coal-to-POM integration, allowed it to undercut Western cost structures. While Japan and South Korea, home to major domestic players, still import supplemental resin, underscoring the supply chain's flexibility concerning lead time and formulation niches. India is on a growth trajectory, driven by export-oriented component makers shifting towards local compounding. Southeast Asia is reaping the benefits of an ongoing relocation of electronics assembly into Vietnam, Malaysia, and Thailand.
North America is projected to lag, constrained by mature electronics and a lack of new resin capacity. U.S. auto part molders, facing tariffs on Chinese POM, are turning to sources in Delaware or Mexico. This shift, while adding logistics complexity, bolsters North American integration. Europe is advancing; however, this growth is tempered by REACH costs and impending carbon-border fees, which seem to favor bio-methanol POM sources.
In 2025, South America accounted for a modest share. While Brazil's agricultural machinery boom provided a boost, Argentina's import curbs tempered the region's overall consumption. The Middle-East and Africa polyoxymethylene market grows the quickest at 5.94%. This surge is largely driven by ambitions under Saudi and UAE's Vision 2030 and bolstered by SABIC's expansion of its Jubail line in 2025, which added significant regional capacity.

Competitive Landscape
The polyoxymethylene (POM) market is moderately consolidated. The gap between commodity and specialty grades is widening. Leaders invest in reinforced copolymers and bio-methanol pilots, while mid-tier processors rely on toll compounding and struggle with REACH and FDA dossiers. 3D-printing filaments and ultra-high-molecular-weight copolymers remain white-space niches, yet require process optimization to displace entrenched polyamide 12 powders. Balance-sheet strength, regulatory files, and research and development heft will likely dictate consolidation outcomes as feedstock turbulence and carbon costs keep eroding thin margins for non-integrated outfits.
Polyoxymethylene (POM) Industry Leaders
Celanese Corporation
Polyplastics Co., Ltd. (Daicel Group)
Korea Engineering Plastics Co., Ltd.
Mitsubishi Chemical Group Corporation
Kolon BASF innoPOM, Inc.
- *Disclaimer: Major Players sorted in no particular order

Recent Industry Developments
- November 2024: Polyplastics Co., Ltd. revealed that the inaugural phase of its indirectly invested polyacetal (POM) or polyoxymethylene (POM) manufacturing facility in China is operational. This move responds to customer needs by making improvements, including reductions in lead time and transportation costs.
- October 2024: Celanese introduced three new sustainable engineering thermoplastics at Fakuma 2024, including Hostaform POM ECO-C, derived from low-carbon methanol with an ISCC Carbon Footprint Certification, achieving the company's lowest product carbon footprint for acetal copolymer while maintaining drop-in replacement performance.


Global Polyoxymethylene (POM) Market Report Scope
Polyoxymethylene (POM), also known as acetal, polyacetal, or polyformaldehyde, is defined as a high-performance, semi-crystalline engineering thermoplastic characterized by exceptional stiffness, low friction, high strength, and superior dimensional stability. It is widely utilized as a metal replacement in precision components such as gears, bearings, and conveyor parts.
The market is segmented by form type, end-user industry, and geography. By form type, the market is segmented into sheet, rod and tube, and others. By end-user industry, the market is segmented into aerospace, automotive, electrical and electronics, industrial and machinery, and other end-user industries. The report also covers the market size and forecasts for the photoresist market in 20 countries across major regions. For each segment, the market sizing and forecasts have been done on the basis of volume (Tons).
| Sheet |
| Rod and Tube |
| Others |
| Aerospace |
| Automotive |
| Electrical and Electronics |
| Industrial and Machinery |
| Other End-user Industries |
| Asia-Pacific | China |
| Japan | |
| India | |
| South Korea | |
| Australia | |
| Malaysia | |
| Rest of Asia-Pacific | |
| North America | Canada |
| Mexico | |
| United States | |
| Europe | Germany |
| France | |
| Italy | |
| United Kingdom | |
| Russia | |
| Rest of Europe | |
| South America | Brazil |
| Argentina | |
| Rest of South America | |
| Middle-East and Africa | Saudi Arabia |
| United Arab Emirates | |
| Nigeria | |
| South Africa | |
| Rest of Middle-East and Africa |
| By Form Type | Sheet | |
| Rod and Tube | ||
| Others | ||
| By End-user Industry | Aerospace | |
| Automotive | ||
| Electrical and Electronics | ||
| Industrial and Machinery | ||
| Other End-user Industries | ||
| By Geography | Asia-Pacific | China |
| Japan | ||
| India | ||
| South Korea | ||
| Australia | ||
| Malaysia | ||
| Rest of Asia-Pacific | ||
| North America | Canada | |
| Mexico | ||
| United States | ||
| Europe | Germany | |
| France | ||
| Italy | ||
| United Kingdom | ||
| Russia | ||
| Rest of Europe | ||
| South America | Brazil | |
| Argentina | ||
| Rest of South America | ||
| Middle-East and Africa | Saudi Arabia | |
| United Arab Emirates | ||
| Nigeria | ||
| South Africa | ||
| Rest of Middle-East and Africa | ||


Market Definition
- End-user Industry - Automotive, Aerospace, Industrial Machinery, Electrical & Electronics, and Others are the end-user industries considered under the polyoxymethylene market.
- Resin - Under the scope of the study, virgin polyoxymethylene resin in primary forms such as powder, pellet, etc. are considered.
| Keyword | Definition |
|---|---|
| Acetal | This is a rigid material that has a slippery surface. It can easily withstand wear and tear in abusive work environments. This polymer is used for building applications such as gears, bearings, valve components, etc. |
| Acrylic | This synthetic resin is a derivative of acrylic acid. It forms a smooth surface and is mainly used for various indoor applications. The material can also be used for outdoor applications with a special formulation. |
| Cast film | A cast film is made by depositing a layer of plastic onto a surface then solidifying and removing the film from that surface. The plastic layer can be in molten form, in a solution, or in dispersion. |
| Colorants & Pigments | Colorants & Pigments are additives used to change the color of the plastic. They can be a powder or a resin/color premix. |
| Composite material | A composite material is a material that is produced from two or more constituent materials. These constituent materials have dissimilar chemical or physical properties and are merged to create a material with properties unlike the individual elements. |
| Degree of Polymerization (DP) | The number of monomeric units in a macromolecule, polymer, or oligomer molecule is referred to as the degree of polymerization or DP. Plastics with useful physical properties often have DPs in the thousands. |
| Dispersion | To create a suspension or solution of material in another substance, fine, agglomerated solid particles of one substance are dispersed in a liquid or another substance to form a dispersion. |
| Fiberglass | Fiberglass-reinforced plastic is a material made up of glass fibers embedded in a resin matrix. These materials have high tensile and impact strength. Handrails and platforms are two examples of lightweight structural applications that use standard fiberglass. |
| Fiber-reinforced polymer (FRP) | Fiber-reinforced polymer is a composite material made of a polymer matrix reinforced with fibers. The fibers are usually glass, carbon, aramid, or basalt. |
| Flake | This is a dry, peeled-off piece, usually with an uneven surface, and is the base of cellulosic plastics. |
| Fluoropolymers | This is a fluorocarbon-based polymer with multiple carbon-fluorine bonds. It is characterized by high resistance to solvents, acids, and bases. These materials are tough yet easy to machine. Some of the popular fluoropolymers are PTFE, ETFE, PVDF, PVF, etc. |
| Kevlar | Kevlar is the commonly referred name for aramid fiber, which was initially a Dupont brand for aramid fiber. Any group of lightweight, heat-resistant, solid, synthetic, aromatic polyamide materials that are fashioned into fibers, filaments, or sheets is called aramid fiber. They are classified into Para-aramid and Meta-aramid. |
| Laminate | A structure or surface composed of sequential layers of material bonded under pressure and heat to build up to the desired shape and width. |
| Nylon | They are synthetic fiber-forming polyamides formed into yarns and monofilaments. These fibers possess excellent tensile strength, durability, and elasticity. They have high melting points and can resist chemicals and various liquids. |
| PET preform | A preform is an intermediate product that is subsequently blown into a polyethylene terephthalate (PET) bottle or a container. |
| Plastic compounding | Compounding consists of preparing plastic formulations by mixing and/or blending polymers and additives in a molten state to achieve the desired characteristics. These blends are automatically dosed with fixed setpoints usually through feeders/hoppers. |
| Plastic pellets | Plastic pellets, also known as pre-production pellets or nurdles, are the building blocks for nearly every product made of plastic. |
| Polymerization | It is a chemical reaction of several monomer molecules to form polymer chains that form stable covalent bonds. |
| Styrene Copolymers | A copolymer is a polymer derived from more than one species of monomer, and a styrene copolymer is a chain of polymers consisting of styrene and acrylate. |
| Thermoplastics | Thermoplastics are defined as polymers that become soft material when it is heated and becomes hard when it is cooled. Thermoplastics have wide-ranging properties and can be remolded and recycled without affecting their physical properties. |
| Virgin Plastic | It is a basic form of plastic that has never been used, processed, or developed. It may be considered more valuable than recycled or already used materials. |


Research Methodology
Mordor Intelligence follows a four-step methodology in all our reports.
- Step-1: Identify Key Variables: The quantifiable key variables (industry and extraneous) pertaining to the specific product segment and country are selected from a group of relevant variables & factors based on desk research & literature review; along with primary expert inputs. These variables are further confirmed through regression modeling (wherever required).
- Step-2: Build a Market Model: In order to build a robust forecasting methodology, the variables and factors identified in Step-1 are tested against available historical market numbers. Through an iterative process, the variables required for market forecast are set and the model is built on the basis of these variables.
- Step-3: Validate and Finalize: In this important step, all market numbers, variables and analyst calls are validated through an extensive network of primary research experts from the market studied. The respondents are selected across levels and functions to generate a holistic picture of the market studied.
- Step-4: Research Outputs: Syndicated Reports, Custom Consulting Assignments, Databases & Subscription Platforms


