
Plastic Pressure Pipes Market Size and Share
Market Overview
| Study Period | 2021 - 2031 |
|---|---|
| Market Size (2026) | USD 18.28 Billion |
| Market Size (2031) | USD 23.81 Billion |
| Growth Rate (2026 - 2031) | 5.43 % |
| Fastest Growing Market | Asia-Pacific |
| Largest Market | Asia-Pacific |
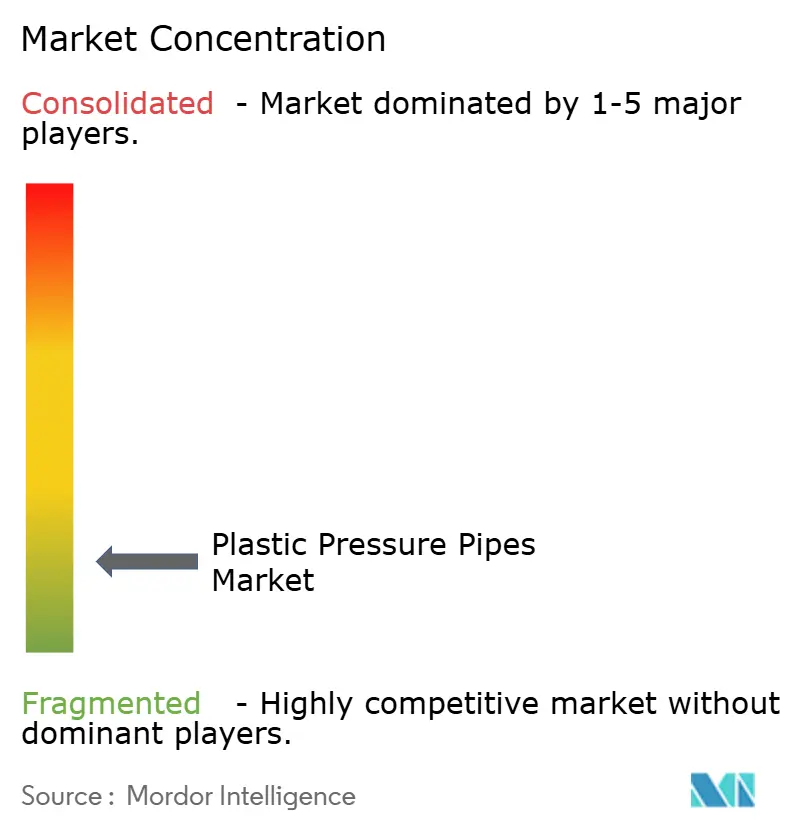
| Market Concentration | Low |
Major Players *Disclaimer: Major Players sorted in no particular order Image © Mordor Intelligence. Reuse requires attribution under CC BY 4.0. | |
Plastic Pressure Pipes Market Analysis by Mordor Intelligence
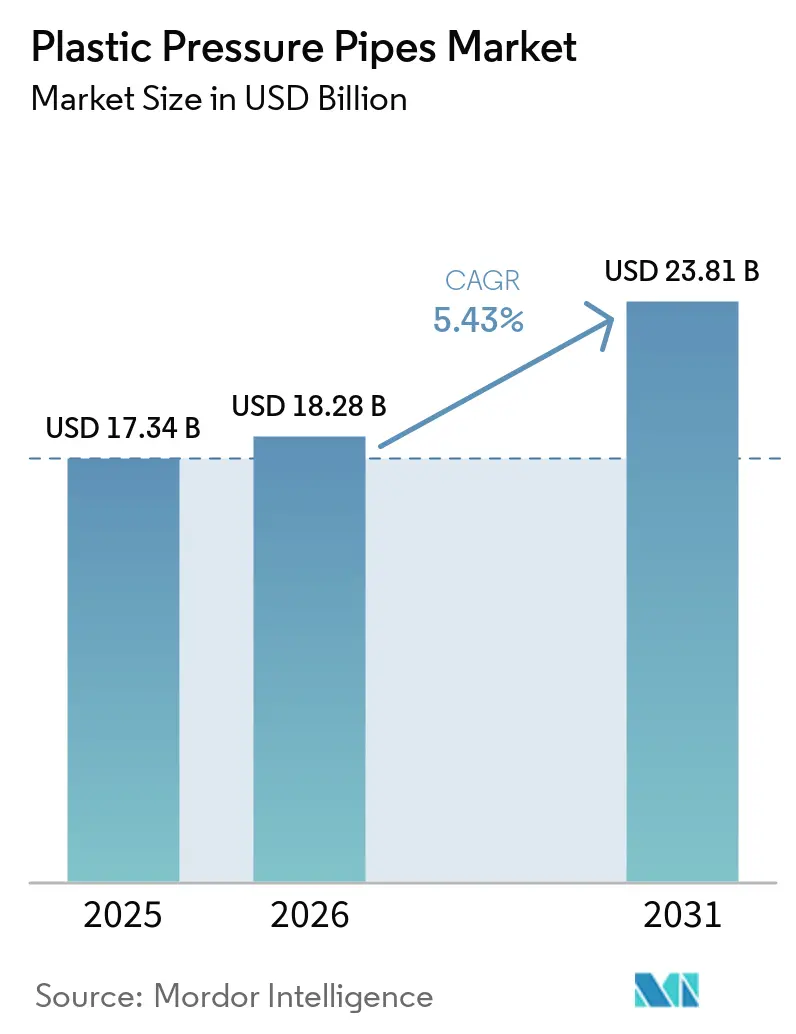
The Plastic Pressure Pipes Market size was valued at USD 17.34 billion in 2025 and is estimated to grow from USD 18.28 billion in 2026 to reach USD 23.81 billion by 2031, at a CAGR of 5.43% during the forecast period (2026-2031). Replacement of aging iron and concrete water mains in developed economies and first-generation network construction in emerging economies support demand from separate investment cycles. India approved Jal Jeevan Mission 2.0 with a total outlay of INR 8.69 lakh crore (approximately USD 104 billion) and extended the program to December 2028 to achieve universal rural piped water access. The FY2026–27 allocation of INR 67,670 crore (approximately USD 8.1 billion) creates a sustained procurement pipeline for polyvinyl chloride (PVC) pressure pipes used in rural water-supply networks. Product strategy increasingly combines pipe systems with valves, metering, and monitoring equipment, while feedstock volatility and certification differences continue to limit cross-border supply. The plastic pressure pipes market, therefore, has demand across new construction, renewal, agricultural water delivery, and industrial applications.
Key Report Takeaways
- By material, PVC held 48.67% of the plastic pressure pipes market share in 2025, while polyethylene (PE) is projected to advance at a 6.24% CAGR through 2031.
- By end-user industry, water and wastewater treatment held 33.82% of the plastic pressure pipes market share in 2025, while agriculture is projected to advance at a 6.53% CAGR through 2031.
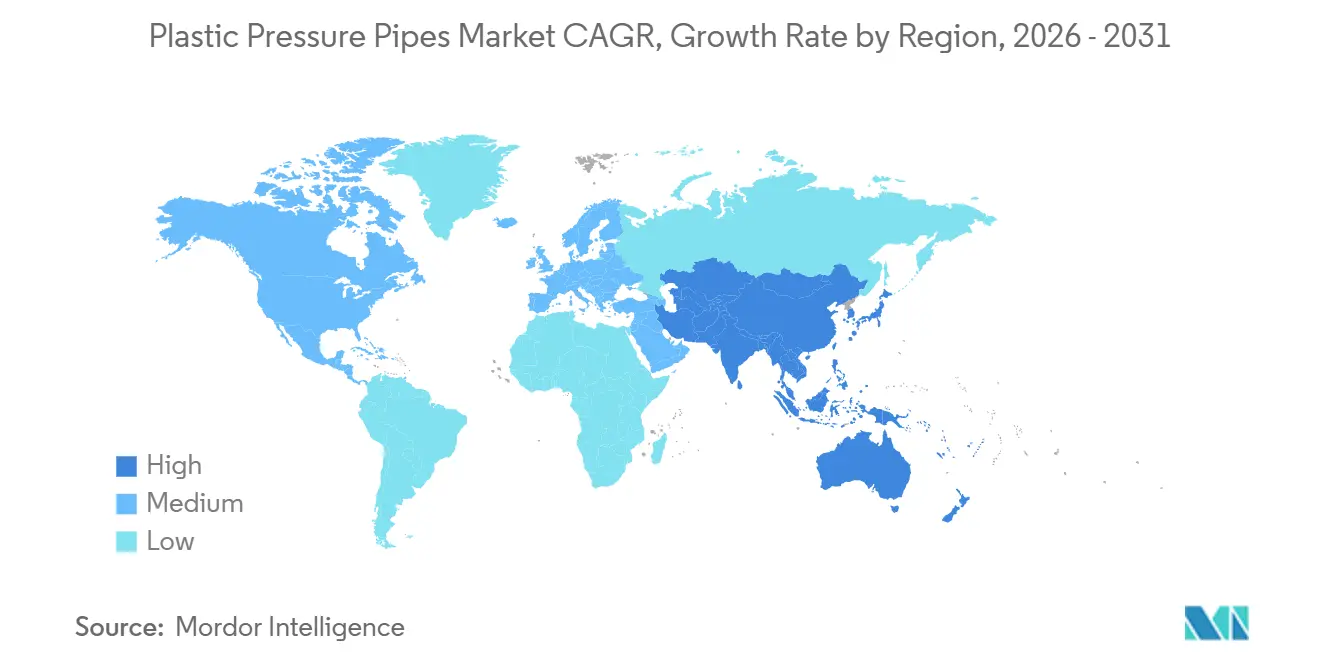
- By geography, Asia-Pacific held 45.06% of the plastic pressure pipes market share in 2025 and is projected to advance at a 6.39% CAGR through 2031.
Note: Market size and forecast figures in this report are generated using Mordor Intelligence’s proprietary estimation framework, updated with the latest available data and insights as of January 2026.
Global Plastic Pressure Pipes Market Trends and Insights
Drivers Impact Analysis*
| Driver | (~) % Impact on CAGR Forecast | Geographic Relevance | Impact Timeline |
|---|---|---|---|
| Aging Water and Wastewater Networks Requiring Pressure-Pipe Replacement | +1.5% | North America, Europe, South America | Short term (≤ 2 years) |
| Corrosion Resistance and Lower Installed Cost Versus Metallic Alternatives | +1.2% | Global | Long term (≥ 4 years) |
| Expansion of Efficient Irrigation and Water-Conservation Infrastructure | +1.0% | Asia-Pacific, MEA, South America | Medium term (2-4 years) |
| Trenchless Rehabilitation Enabled by Flexible PE and Fusion-Jointed Systems | +0.7% | North America & Europe | Short term (≤ 2 years) |
| Digital Leak Detection and Asset-Monitoring Compatibility of New Pipe Networks | +0.4% | North America & Europe; APAC emerging | Long term (≥ 4 years) |
| Source: Mordor Intelligence | |||
Aging Water and Wastewater Networks Requiring Pressure-Pipe Replacement
The plastic pressure pipes market benefits when utilities replace aging water and wastewater infrastructure. The U.S. Environmental Protection Agency finalized requirements in October 2024 for drinking water systems to identify and replace lead service lines within 10 years[1]U.S. Environmental Protection Agency, “Lead and Copper Rule Improvements,” U.S. Environmental Protection Agency, epa.gov. Federal funding of USD 15 billion supports the lead service line transition under the Bipartisan Infrastructure Law. This turns a portion of deferred maintenance into a compliance-led procurement cycle for High-Density Polyethylene (HDPE) and PVC-O pipe producers. Rehabilitation specifications also increasingly favor trenchless-compatible grades such as PE100-RC, which can increase revenue per installed meter. American Water Works Association (AWWA) and ISO standards, the 2024 U.S. EPA Lead and Copper Rule revision, and the EU Urban Wastewater Treatment Directive influence public-project specifications and material selection.
Expansion of Efficient Irrigation and Water-Conservation Infrastructure
Efficient irrigation is widening the addressable demand base for the plastic pressure pipes market in water-scarce regions. China issued Guobiao (GB/T) 19796.1-2025 for polyethylene pressure-pipe agricultural irrigation saddles, with implementation effective in May 2026. India’s PM Krishi Sinchayee Yojana operates alongside Jal Jeevan Mission 2.0 and supports certified uPVC pipe procurement for farm distribution[2]Press Information Bureau, “Cabinet Approves Extension of Jal Jeevan Mission,” Government of India, pib.gov.in. The Vinyl Institute reported PVC delivery efficiency of 89%-99%, compared with 60%-65% for earthen canals, which supports the use of pressurized systems in irrigation projects. Molecor’s TR6 is a PN6-oriented PVC irrigation pipe certified under UNE-EN 17176 and ISO 16422, with 15% higher stiffness than conventional PVC-U PN6. These requirements support products that use less material while meeting farm-water distribution needs.
Corrosion Resistance and Lower Installed Cost Versus Metallic Alternatives
Corrosion resistance supports long-term material substitution in the plastic pressure pipes market. PVC-O pipes have lower environmental impacts than ductile iron over a 100-year service period under the EN 15804 life-cycle assessment methodology. AWWA specifications and National Sanitation Foundation/American National Standards Institute (NSF/ANSI) 61 listings cover PE4710 and PVC-O pipe for potable water uses in public tenders. AWWA and Plastics Pipe Institute material cited by JM EAGLE, INC. states that PVC and PE pipes can exceed 100 years of service life. PE pipe also avoids the cathodic-protection systems required by steel in produced water, slurry, and selected industrial services. The lower maintenance burden can outweigh pressure-rating limits for smaller-diameter applications, helping plastic pipes compete beyond municipal water distribution.
Trenchless Rehabilitation Enabled by Flexible PE and Fusion-Jointed Systems
Trenchless installation is expanding the use of PE systems in the plastic pressure pipes market. ISO 11300-1:2026 specifies requirements for PE pipes and fittings used in trenchless renovation and replacement of underground water, sewer, and drain networks. ISO 11301-1:2026 updates requirements for PE systems used in trenchless rehabilitation of underground gas supply networks. Horizontal directional drilling, pipe bursting, and sliplining reduce disruption in dense urban corridors where open-cut construction is difficult. PE100-RC is preferred for pipe-bursting pullbacks because fusion joints remove the need for thrust blocks and reduce gasket-related maintenance. As civil excavation costs rise, PE’s higher unit cost can represent a smaller part of the total installed cost than the savings from trenchless work.
Restraints Impact Analysis*
| Restraint | (~) % Impact on CAGR Forecast | Geographic Relevance | Impact Timeline |
|---|---|---|---|
| Polymer and Additive Price Volatility | -0.6% | Global | Short term (≤ 2 years) |
| Fragmented Certification and Pressure-Rating Requirements Across Countries | -0.4% | Global, particularly cross-border procurement markets | Medium term (2-4 years) |
| Limited Availability of Verified Recycled Resin for Pressure Applications | -0.3% | Europe, Asia-Pacific (sustainability-driven markets) | Long term (≥ 4 years) |
| Source: Mordor Intelligence | |||
Polymer and Additive Price Volatility
Polymer and additive price changes restrain the plastic pressure pipes market because resin is a major input cost. The U.S. Producer Price Index for plastics pipe and pipe fitting manufacturing stood at 418.1 in July 2026. The index reflects continued exposure to ethylene and PVC monomer cost cycles. Price movements affect manufacturers, contractors, and public-project budgets at the same time. A stable resin environment allows producers to plan capacity and bid on longer infrastructure programs with greater certainty. India imposed a minimum import price on PVC resin in July 2026, showing that resin price instability can also prompt policy action.
Fragmented Certification and Pressure-Rating Requirements Across Countries
Certification differences limit the ability of suppliers to serve the plastic pressure pipes market across regulatory blocs. EN 12201 governs PE water mains in the European Union, while AWWA C900 and C906 with NSF/ANSI 61 apply in North America. India uses Bureau of Indian Standards (BIS) IS 4984:2016 for HDPE mains under Jal Jeevan Mission, while China applies its GB/T standards for PE and PVC compounds. A Jal Jeevan Mission PVC-O tender issued in August 2026 required the empanelment of indigenous manufacturers, which restricted foreign producers despite product quality. Polyfab maintains certification to BS EN 1452, Deutsches Institut für Normung (DIN) 8062, BS 3505, BS 3506, and American Society for Testing and Materials (ASTM) standards for its export activity. Smaller producers may find this testing and documentation burden difficult to replicate, particularly in projects that source materials from several countries.
*Our forecasts treat driver/restraint impacts as directional, not additive. The impact forecasts reflect baseline growth, mix effects, and variable interactions.
Segment Analysis
By Material: PVC Anchors Revenue While PE Claims the Higher-Performance Tier
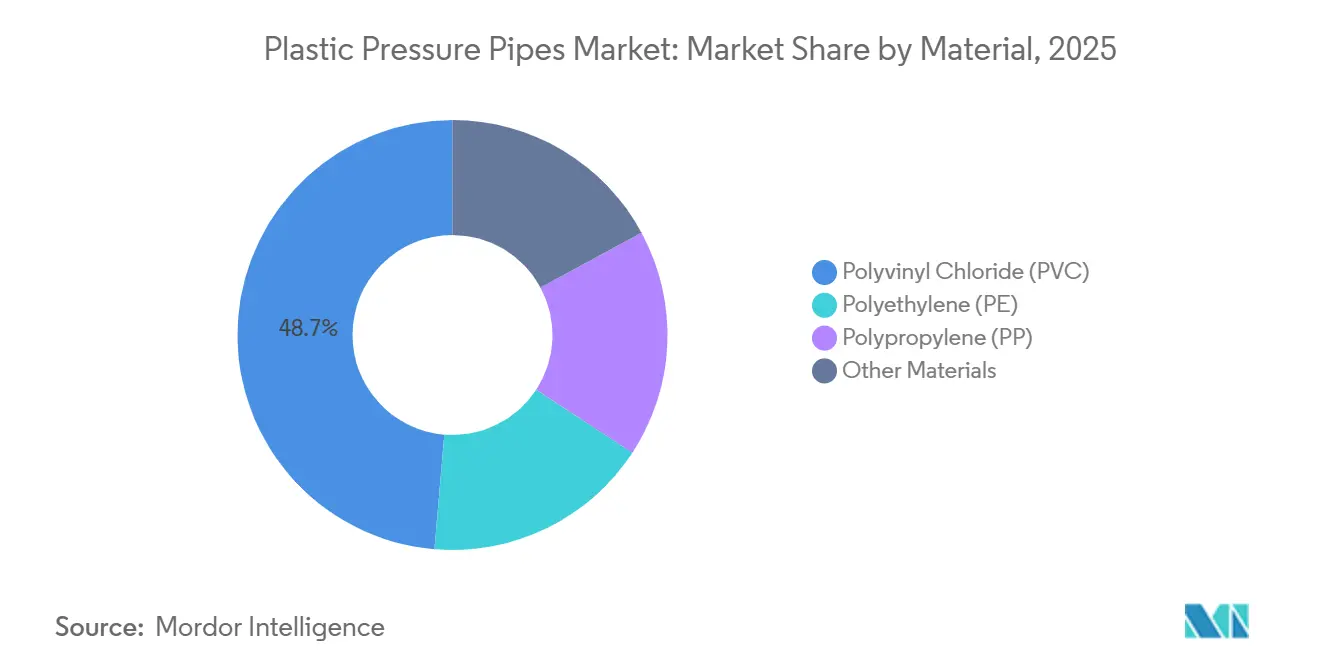
PVC held 48.67% of the plastic pressure pipes market in 2025. Its position reflects lower resin cost, an established contractor skill base, and compatibility with existing fittings used in water distribution and agricultural systems. PVC-O is gaining use in large-diameter municipal mains because its hydrostatic design basis is 7,100 psi, compared with 4,000 psi for conventional PVC. The higher rating permits thinner walls at comparable pressure levels and can reduce material use and installation weight. Polypropylene (PP) and other materials serve specialized higher-temperature industrial and chemical applications where PVC has operating limitations.
PE is projected to advance at a 6.24% CAGR through 2031. It supports trenchless rehabilitation, large-diameter fusion-welded water transmission, and agricultural drip systems. CHINA LESSO reported expanded specialized agricultural piping into Africa and Southeast Asia in the first half of 2026. The company also reported high-performance composite piping research and several associated patents during that period. Material selection, therefore, reflects the required pressure performance, installation method, temperature exposure, and expected service conditions.



By End-User Industry: Water and Wastewater Treatment Underpins Revenue While Agriculture Defines the Growth Frontier
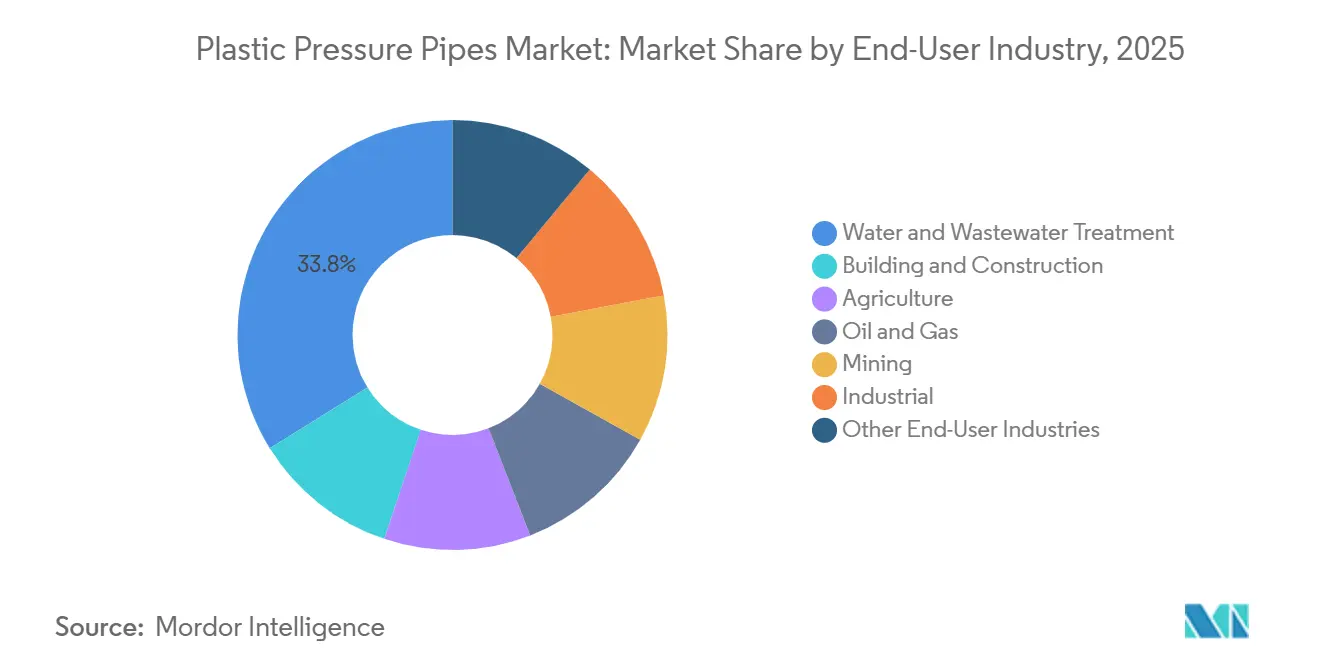
Water and wastewater treatment held 33.82% of the plastic pressure pipes market share in 2025. The category includes potable water distribution, wastewater conveyance, and desalination-linked transmission applications. Building and construction provides recurring demand for hot- and cold-water plumbing and fire-fighting risers in urban settings. Oil and gas, industrial, and mining uses are technically demanding applications where PE and PP are selected for produced water, chemical dosing, process fluids, and slurry lines. These uses are smaller in volume but can have higher value because corrosion resistance and abrasion performance are critical.
Agriculture is projected to advance at a 6.53% CAGR through 2031. Pressurized irrigation responds to government water-efficiency programs in China, India, the Middle East, and Sub-Saharan Africa. CHINA LESSO expanded agricultural piping sales into Africa and Southeast Asia during the first half of 2026. APL Apollo presented a plan in May 2026 to reach INR 5,000 crore (approximately USD 585 million) revenue by FY31 through plant expansions and a planned greenfield plant in South India. This highlights the role of plumbing, irrigation, and infrastructure applications in India’s multi-year pipe demand.
Geography Analysis
Asia-Pacific held 45.06% of the plastic pressure pipes market in 2025 and is projected to advance at a 6.39% CAGR through 2031. China and India are supported by municipal water, rural distribution, and agricultural-irrigation programs. JJM 2.0 gives India a long-term rural water procurement program through December 2028. China’s GB/T 19796.1-2025 standard has applied to PE agricultural irrigation saddles since May 2026. Japan and South Korea provide replacement demand shaped by mature networks and high-quality requirements. Southeast Asia and South Asia add demand through urban expansion and water-network development.
In North America and Europe, demand is weighted toward rehabilitation, including PE100-RC and PVC-O grades that meet municipal and industrial specifications. The U.S. lead service line rule creates a defined replacement obligation over 10 years. ISO 11300-1:2026 provides a technical basis for PE use in trenchless renewal of underground water networks. European regulatory requirements influence the selection of EN 12201 PE and PVC-O in urban renewal projects. The United Kingdom also has a sustained water infrastructure investment program, which supports domestic demand for pressure pipe producers.
South America and the Middle East and Africa are emerging growth areas in the plastic pressure pipes market. GF Industry and Infrastructure Flow Solutions signed a CHF 100 million (approximately USD 126.5 million) contract with SABESP in April 2026 to modernize water distribution networks in 375 municipalities in São Paulo state. Saudi Arabia’s water strategy targets more than 10,000 km of new water transmission infrastructure by 2030 and includes USD 30 billion of investment. CHINA LESSO inaugurated an Ethiopian production base in May 2025, while Polyfab Plastic Middle East FZC supplies several African markets through its export network. These regions combine water scarcity, infrastructure needs, and export-oriented supplier activity.

Competitive Landscape
The plastic pressure pipes market is highly fragmented, with the top five players including JM EAGLE, INC., Aliaxis Holdings SA, CHINA LESSO, Finolex Industries Limited, and GF Industry and Infrastructure Flow Solutions. ASTRAL PIPES, APL Apollo, Finolex Industries Limited, Supreme, and TRUFLO are important Indian participants. CHINA LESSO is a major Asian supplier, while Molecor, Martoni Group, and LUNA PLAST a.s. na EDB operates in Europe. KPT Piping System, P&F Global, and Polyfab Plastic Middle East FZC address price-sensitive and export-oriented demand in emerging regions.
Local content requirements, trade certifications, and established tender relationships can protect domestic positions in the plastic pressure pipes market. GF Industry and Infrastructure Flow Solutions completed its acquisition of VAG Group in October 2025. The company integrated VAG into its Infrastructure business and introduced the Flowise DMA chamber, which combines GF, Uponor, and VAG technologies. Aliaxis Holdings SA set out its Horizon 2030 strategy in 2025 with structural cost reduction and disciplined capital allocation ahead of an expected market recovery in the second half of 2026. These moves shift competition toward bundled infrastructure solutions and disciplined capacity decisions.
Technology differentiation is becoming more important in the plastic pressure pipes market. Gutermann’s ZONESCAN HYDRO provides monitoring designed specifically for plastic pipe distribution systems. Molecor’s TR6 adds a molecularly oriented PVC option for irrigation systems. CHINA LESSO reported progress in high-performance composite piping research during the first half of 2026. Suppliers that pair pipe systems with valves, metering, fittings, and monitoring products can differentiate beyond unit price. Global consolidation remains limited because standards and procurement rules segment the addressable opportunity across jurisdictions.
Plastic Pressure Pipes Industry Leaders
JM EAGLE, INC.
Aliaxis Holdings SA
CHINA LESSO
Finolex Industries Limited
GF Industry and Infrastructure Flow Solutions
- *Disclaimer: Major Players sorted in no particular order

Recent Industry Developments
- April 2026: GF Industry and Infrastructure Flow Solutions signed a contract worth CHF 100 million (approximately USD 126.5 million) with SABESP to supply polyethylene pipes and solutions for modernizing water distribution networks across 375 municipalities in São Paulo state. The order supports demand for plastic pressure pipes used in municipal water distribution and network modernization projects.
- October 2025: ASTRAL PIPES commenced operations at its Kanpur facility, adding 19,037 metric tons per year to its production network. The additional capacity strengthens the company’s ability to supply plastic pressure pipes for plumbing, water distribution, irrigation, and infrastructure applications.


Global Plastic Pressure Pipes Market Report Scope
Plastic pressure pipes are polymer-based piping systems designed to transport fluids under controlled internal pressure. They offer lightweight construction, corrosion resistance, durability, and ease of installation across fluid-handling systems.
The Plastic Pressure Pipes Market is segmented by material, end-user industry, and geography. By material, the market is segmented into polyvinyl chloride (PVC), polyethylene (PE), polypropylene (PP), and other materials. By end-user industry, the market is segmented into water and wastewater treatment, building and construction, agriculture, oil and gas, mining, industrial, and other end-user industries. The report also covers the market size and forecasts for plastic pressure pipes in 15 countries across major regions. For each segment, the market sizing and forecasts have been done on the basis of value (USD).
| Polyvinyl Chloride (PVC) |
| Polyethylene (PE) |
| Polypropylene (PP) |
| Other Materials |
| Water and Wastewater Treatment |
| Building and Construction |
| Agriculture |
| Oil and Gas |
| Mining |
| Industrial |
| Other End-User Industries |
| Asia-Pacific | China |
| India | |
| Japan | |
| South Korea | |
| Rest of Asia-Pacific | |
| North America | United States |
| Canada | |
| Mexico | |
| Europe | Germany |
| United Kingdom | |
| France | |
| Italy | |
| Rest of Europe | |
| South America | Brazil |
| Argentina | |
| Rest of South America | |
| Middle East and Africa | Saudi Arabia |
| South Africa | |
| Rest of Middle East and Africa |
| By Material | Polyvinyl Chloride (PVC) | |
| Polyethylene (PE) | ||
| Polypropylene (PP) | ||
| Other Materials | ||
| By End-User Industry | Water and Wastewater Treatment | |
| Building and Construction | ||
| Agriculture | ||
| Oil and Gas | ||
| Mining | ||
| Industrial | ||
| Other End-User Industries | ||
| By Geography | Asia-Pacific | China |
| India | ||
| Japan | ||
| South Korea | ||
| Rest of Asia-Pacific | ||
| North America | United States | |
| Canada | ||
| Mexico | ||
| Europe | Germany | |
| United Kingdom | ||
| France | ||
| Italy | ||
| Rest of Europe | ||
| South America | Brazil | |
| Argentina | ||
| Rest of South America | ||
| Middle East and Africa | Saudi Arabia | |
| South Africa | ||
| Rest of Middle East and Africa | ||


Key Questions Answered in the Report
What is the size of the plastic pressure pipes market?
The plastic pressure pipes market stands at USD 18.28 billion in 2026 and is projected to reach USD 23.81 billion by 2031.
What is driving demand for plastic pressure pipes?
Aging water networks, rural water programs, efficient irrigation, corrosion resistance, and trenchless installation support demand.
Which material held the largest share in 2025?
PVC held 48.67% of the market in 2025, supported by cost, contractor familiarity, and established fittings infrastructure.
Which end-user industry is projected to advance fastest through 2031?
Agriculture is projected to advance at a 6.53% CAGR through 2031 as irrigation projects favor pressurized water delivery.
Page last updated on:





