
Physical Therapy Rehabilitation Solutions Market Size and Share
Market Overview
| Study Period | 2021 - 2032 |
|---|---|
| Market Size (2027) | USD 34.12 Billion |
| Market Size (2032) | USD 49.52 Billion |
| Growth Rate (2027 - 2032) | 7.73 % |
| Fastest Growing Market | Asia-Pacific |
| Largest Market | North America |
| Market Concentration | Medium |
Major Players *Disclaimer: Major Players sorted in no particular order Image © Mordor Intelligence. Reuse requires attribution under CC BY 4.0. | |
Physical Therapy Rehabilitation Solutions Market Analysis by Mordor Intelligence
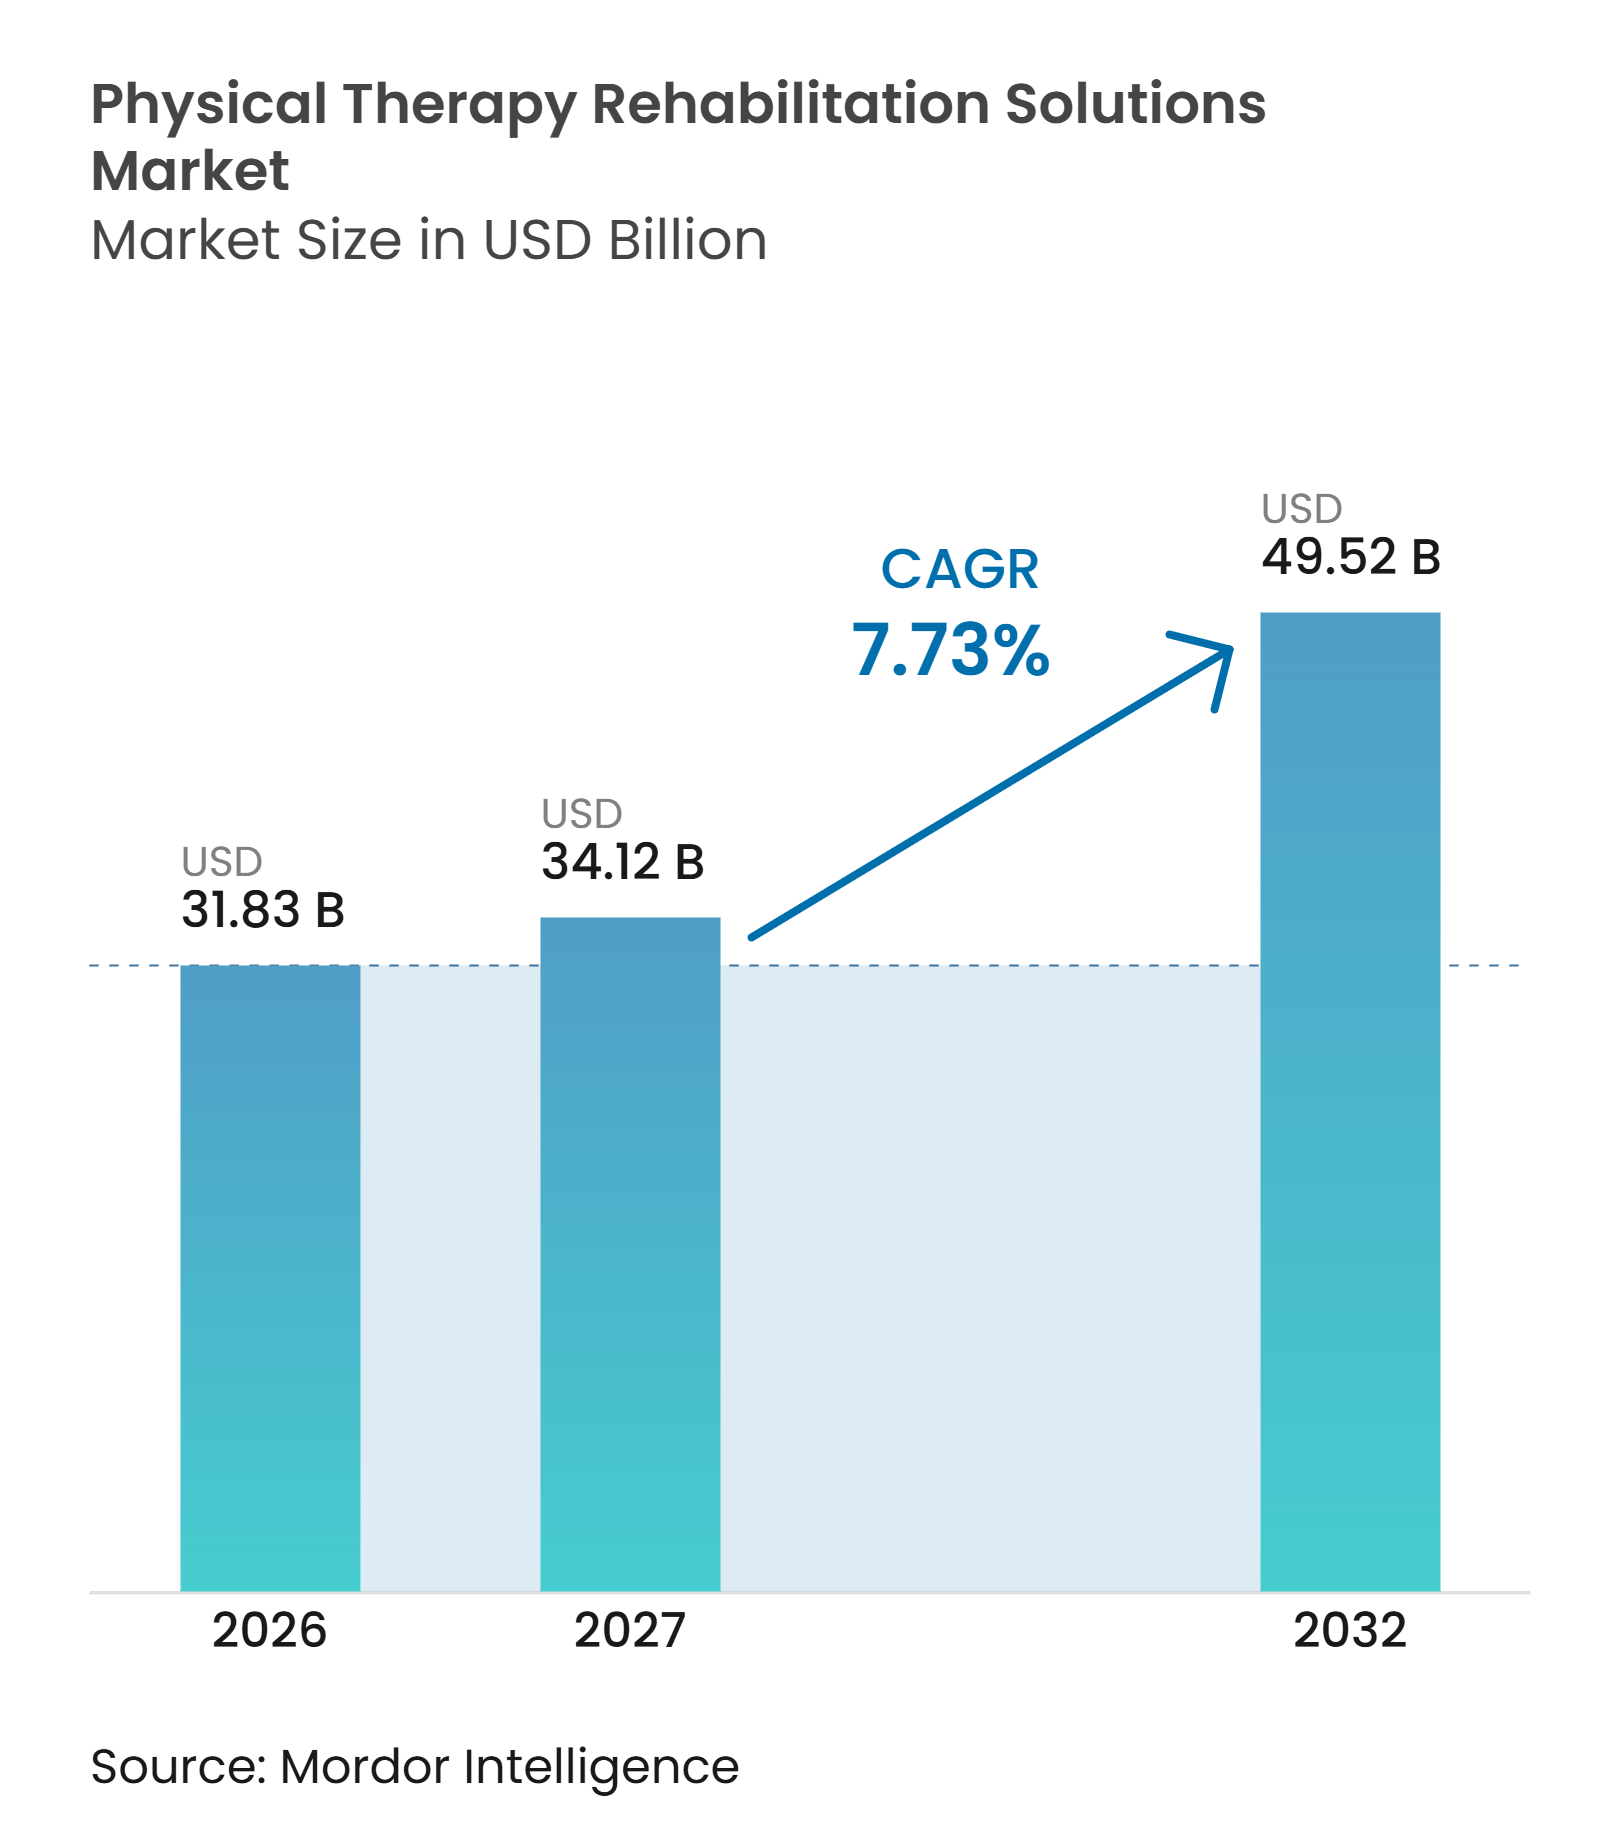
The Physical Therapy Rehabilitation Solutions Market size is projected to be USD 31.83 billion in 2026, USD 34.12 billion in 2027, and reach USD 49.52 billion by 2032, growing at a CAGR of 7.73% from 2027 to 2032.
The physical therapy rehabilitation solutions market is supported by a growing need for rehabilitation services and by broader use of digital care delivery. The World Health Organization reported that 2.41 billion people required rehabilitation services in 2019, following a 63% increase from 1990. Aging populations, long-term musculoskeletal conditions, and workforce shortages are increasing the need for models that extend care beyond traditional facilities. Providers are therefore combining clinical equipment, software, and home-based services to improve access and manage clinical workloads. The physical therapy rehabilitation solutions market also faces practical limits from uneven reimbursement, high equipment costs, and requirements for clinical validation and data protection.
Key Report Takeaways
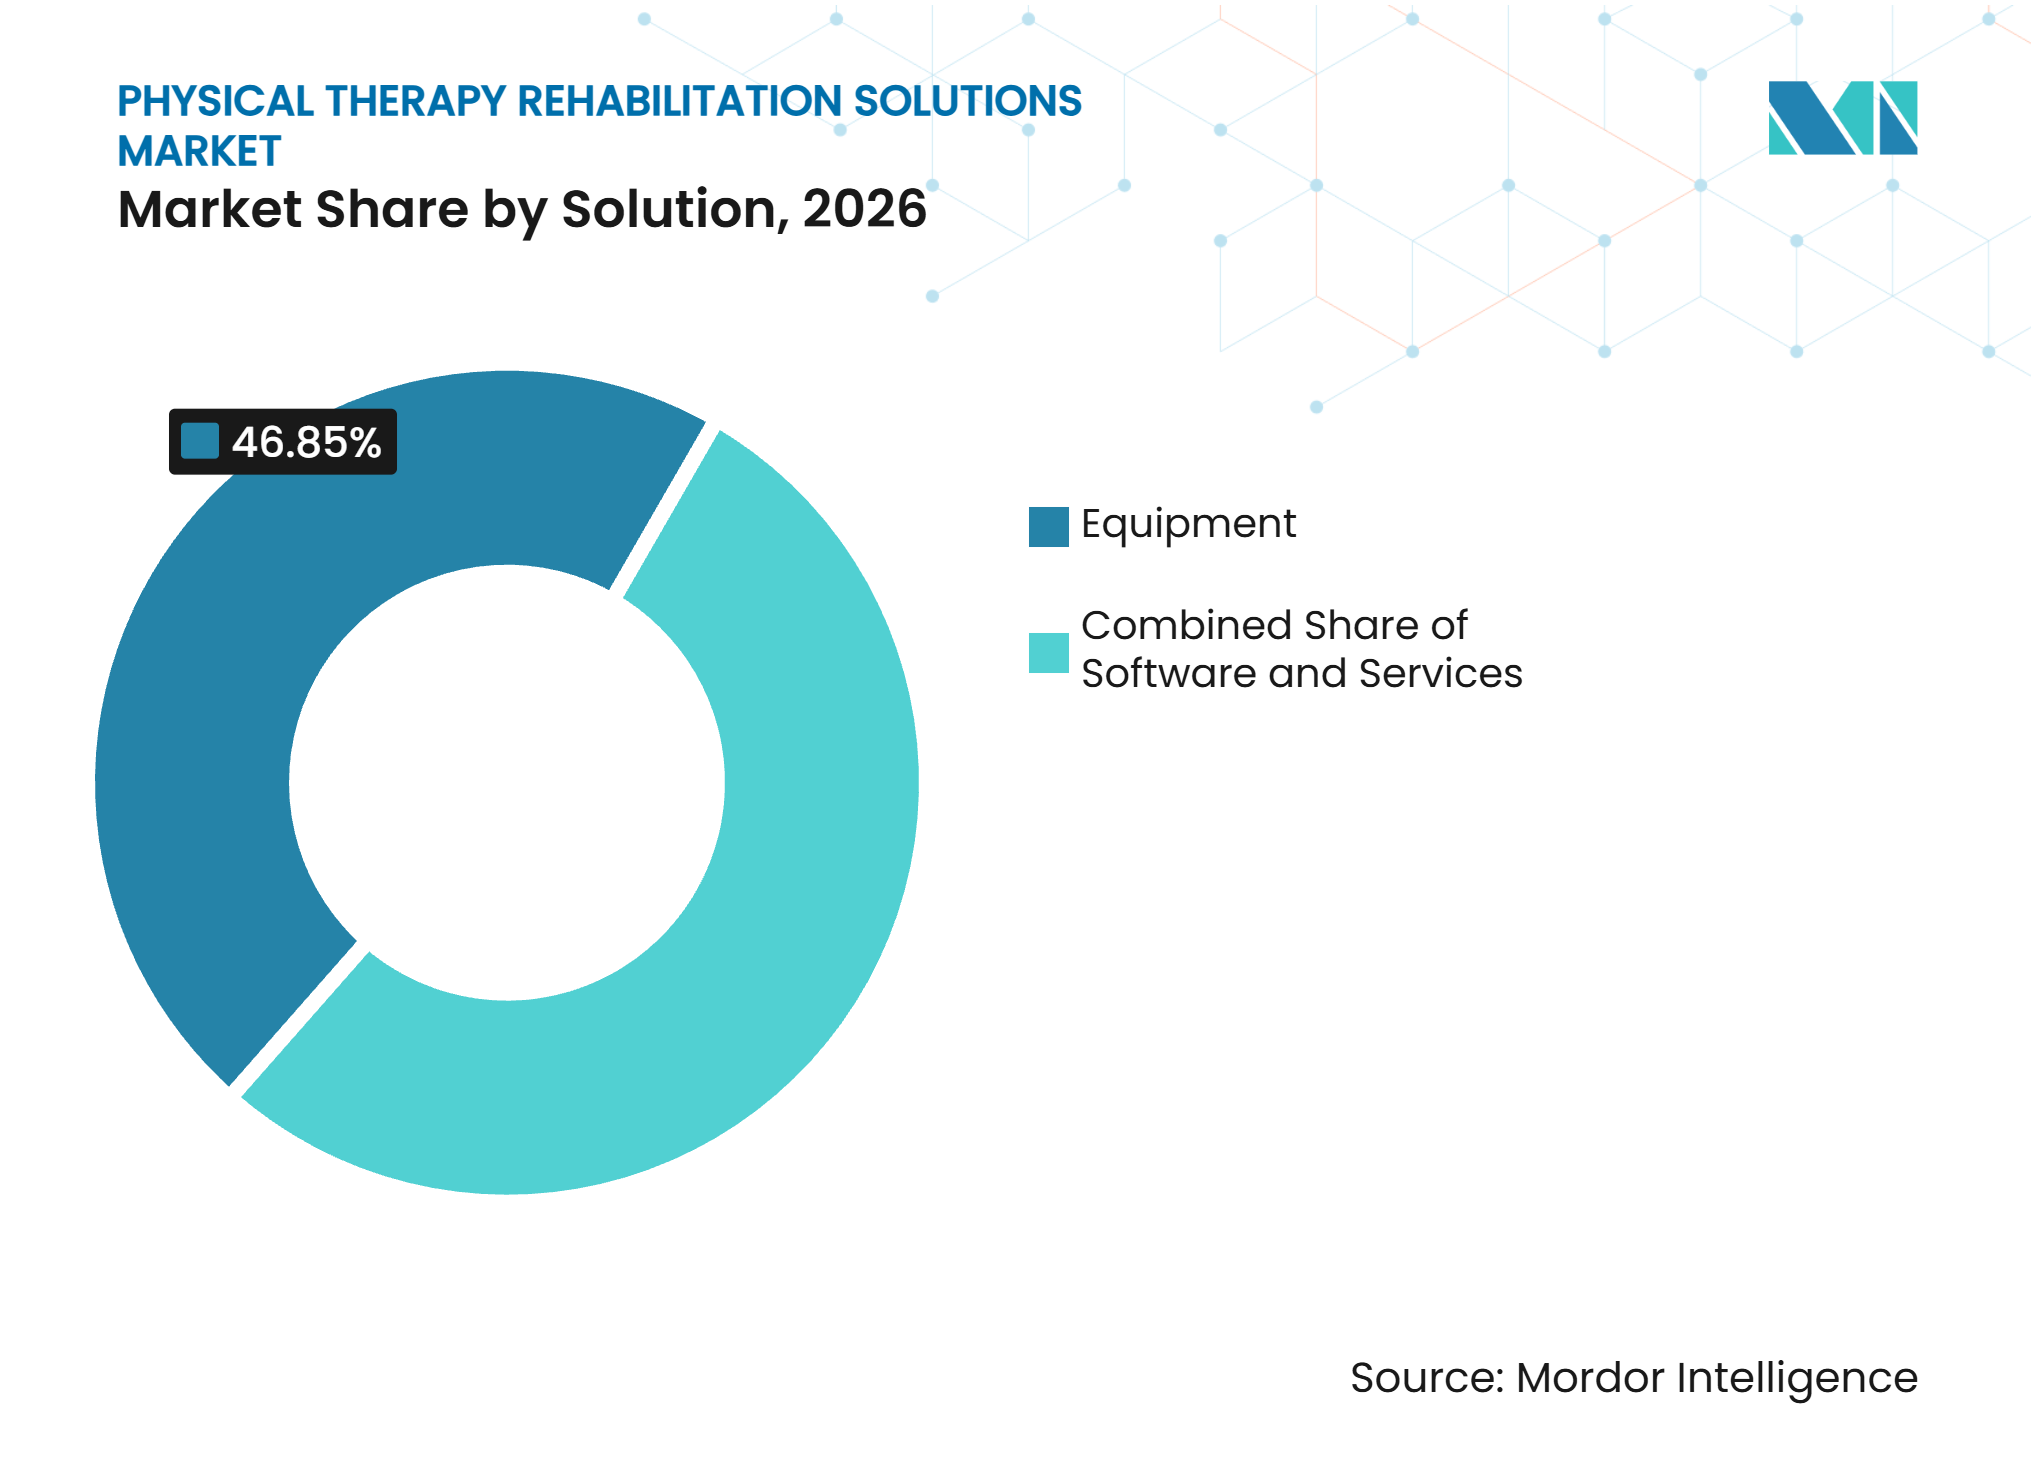
- By solution, Equipment held a 46.85% share in 2026, while Software is forecast to expand at an 8.94% CAGR through 2032.
- By application, Musculoskeletal Rehabilitation held a 38.42% share in 2026, while Neurological Rehabilitation is forecast to expand at an 8.37% CAGR through 2032.
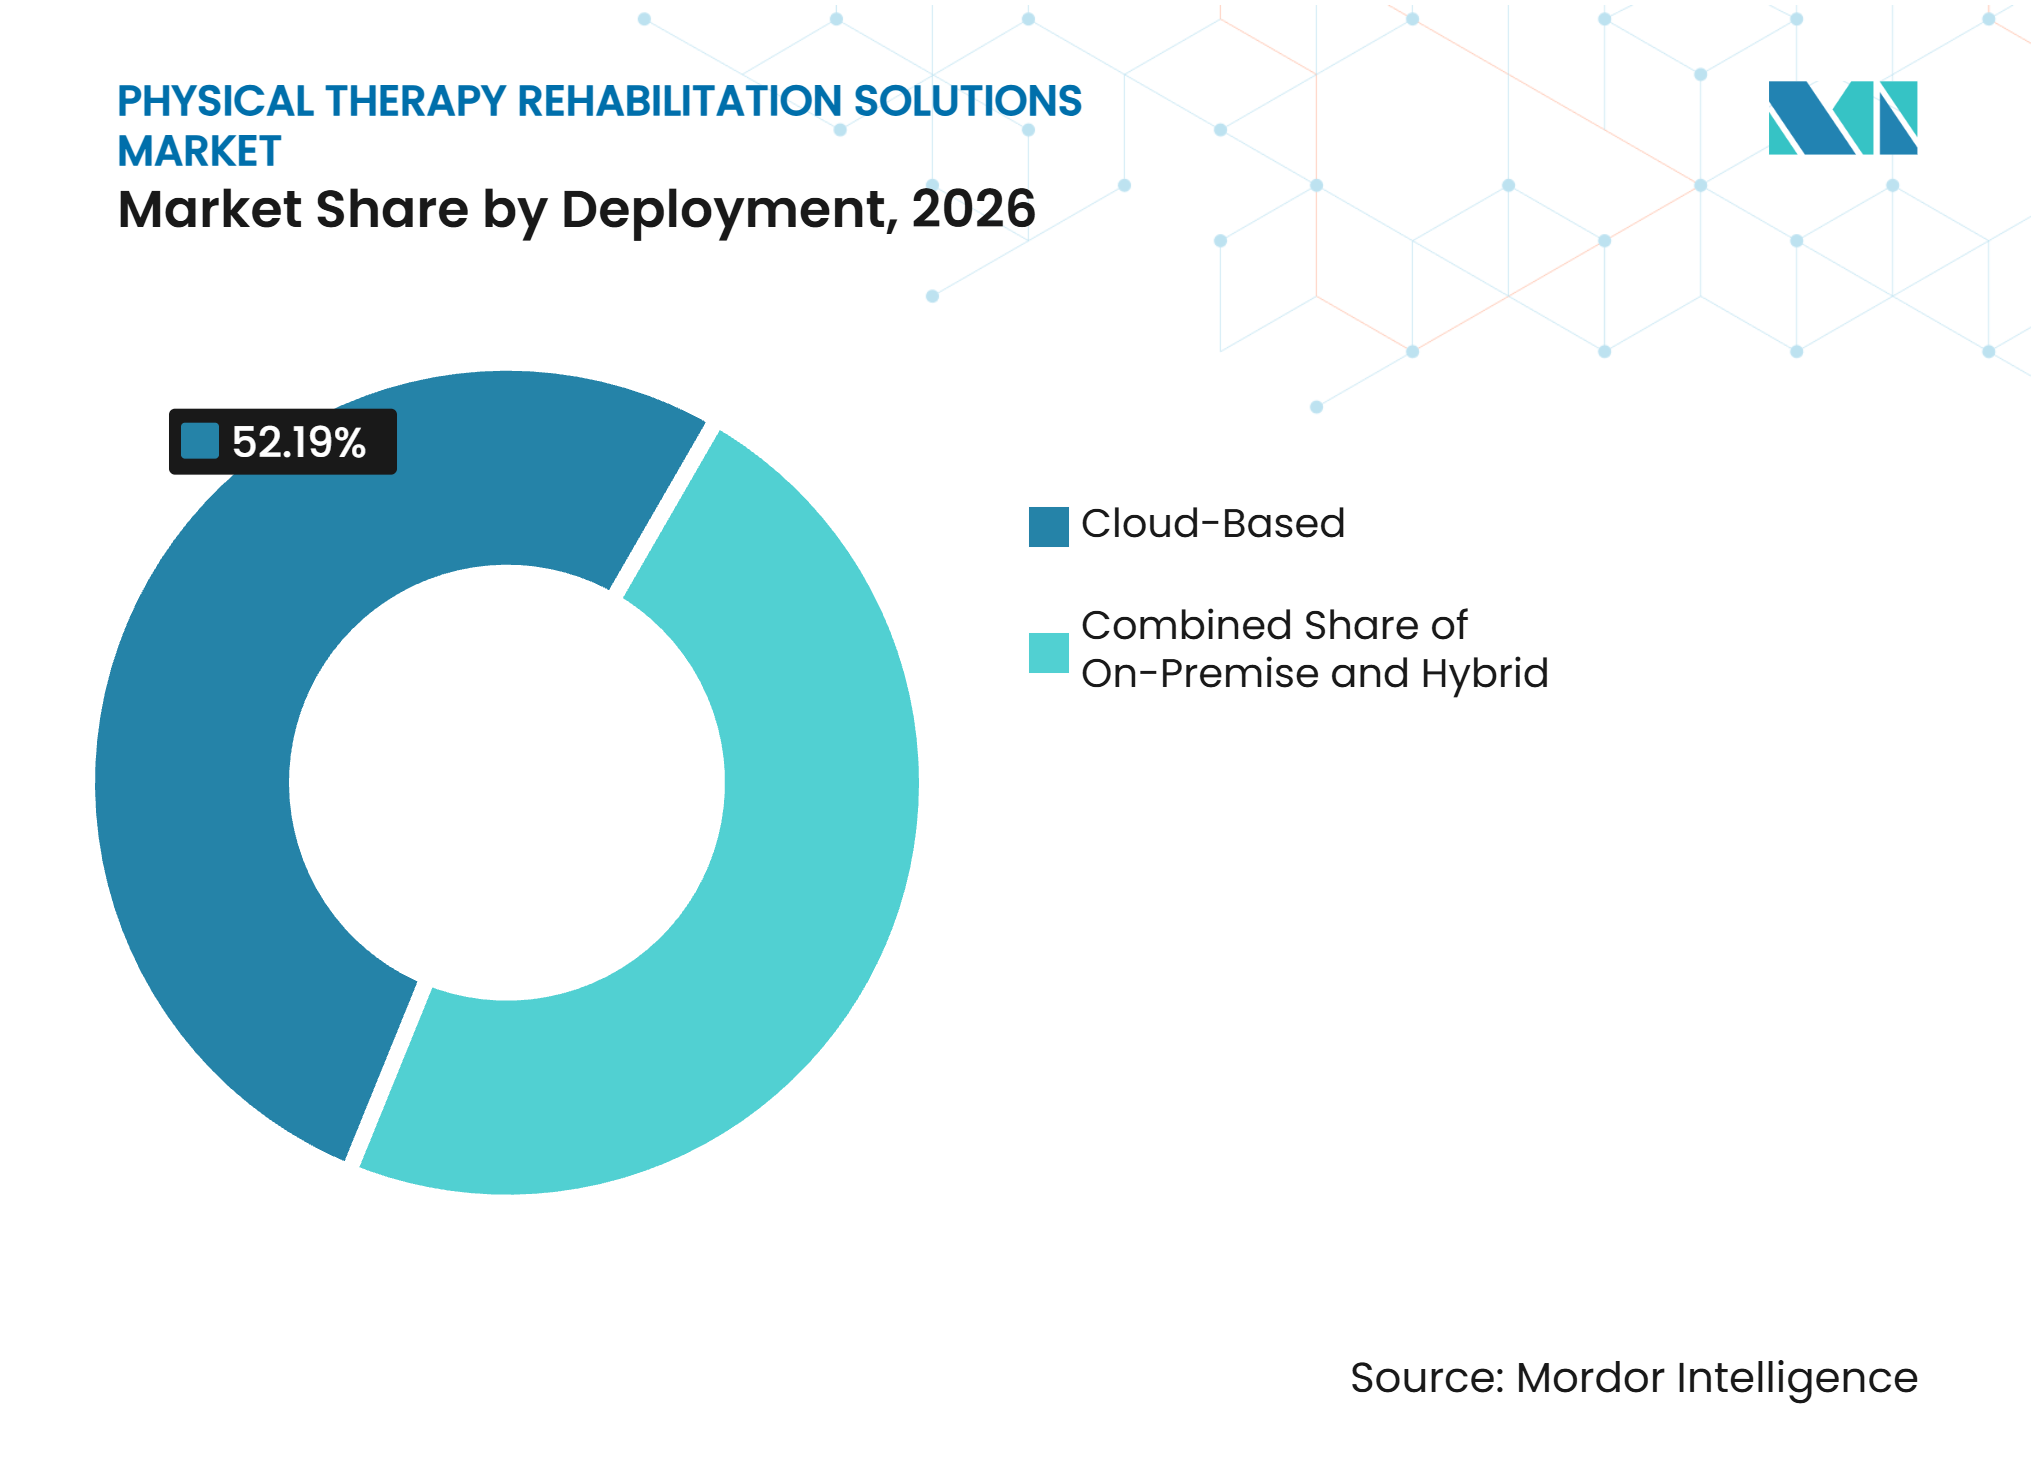
- By deployment, Cloud-Based deployment held a 52.19% share in 2026, while Hybrid deployment is forecast to expand at an 8.12% CAGR through 2032.
- By end user, Hospitals and Outpatient Departments held a 42.76% share in 2026, while Home Care Settings are forecast to expand at an 8.65% CAGR through 2032.
- By geography, North America held a 40.83% share in 2026, while Asia-Pacific is forecast to expand at a 9.24% CAGR through 2032.
Note: Market numbers in this report are based on Mordor Intelligence's proprietary estimation framework, which combines nine months of actuals with Q4 projections for base year 2026.
Market Trends and Insights
Drivers Impact Analysis of Physical Therapy Rehabilitation Solutions Market*
| Driver | (~) % Impact on CAGR Forecast | Geographic Relevance | Impact Timeline |
|---|---|---|---|
| Rising Prevalence of Musculoskeletal Disorders | +2.5% | Global | Long term (≥ 4 years) |
| Growing Geriatric and Disability-Affected Population | +2.0% | Global, highest concentration in Asia-Pacific and Europe | Long term (≥ 4 years) |
| Expansion of Home-Based and Virtual Rehabilitation | +1.5% | North America and Asia-Pacific core, spillover to Europe | Medium term (2-4 years) |
| Shift Toward Outcome-Based Rehabilitation and Value-Based Care | +1.0% | North America, spillover to Europe | Medium term (2-4 years) |
| Shortage of Rehabilitation Professionals Driving Automation | +0.8% | North America, Europe, and India | Short term (≤ 2 years) |
| Embedded Motion Data Creating New Revenue Models | +0.5% | North America and Asia-Pacific core | Medium term (2-4 years) |
| Source: Mordor Intelligence | |||
Rising Prevalence of Musculoskeletal Disorders Sustains Structural Demand
Musculoskeletal conditions give the physical therapy rehabilitation solutions market a broad and persistent base of demand. A 2025 Global Burden of Disease analysis reported 1.69 billion prevalent musculoskeletal disorder cases in 2021 and projected 2.16 billion cases by 2035.[1] The same study described a 95% increase in cases from 1990 to 2021, which indicates that rehabilitation demand is linked to long-term population health needs. Adults with musculoskeletal conditions can also require more complex care when other chronic conditions are present. England’s 2024 GP Patient Survey found that 13.4% of adults reported a musculoskeletal condition with at least 1 other chronic condition. This care complexity favors providers that can combine physical rehabilitation with coordinated recovery support.
Growing Geriatric and Disability-Affected Population Accelerates Service Demand
Population aging is raising demand for geriatric rehabilitation and testing service capacity in mature health systems. Austrian reporting in 2026 placed average rehabilitation wait times at 9.6 weeks, demonstrating the pressure on available care capacity. Germany’s statutory health insurers spent EUR 14.7 billion on remedial therapies by the end of 2025, a 10.4% increase year over year.[2] Spending increased a further 8.7% in the first quarter of 2026. The 2024 Blankoverordnung reform allows physiotherapists to determine treatment modality and frequency for specified musculoskeletal conditions, which supports more flexible care pathways. These conditions encourage providers in the physical therapy rehabilitation solutions market to invest in equipment and workflows that help clinicians serve more patients. They also reinforce the need for capacity-building solutions across the physical therapy rehabilitation solutions market.
Expansion of Home-Based and Virtual Rehabilitation Redraws Care Delivery
Home-based and virtual services are changing how the physical therapy rehabilitation solutions market reaches patients who cannot easily attend clinics. An NHS trial in Cambridgeshire and Peterborough found that an AI-supported physiotherapy application for back pain reduced waiting lists by 55% and freed 856 clinician hours each month. In the trial, 80% of patients rated digital care as equivalent to or better than in-person treatment. The 2026 Medicare Physician Fee Schedule expanded remote therapeutic monitoring billing codes, including CPT codes 98985, 98984, and 98979, strengthening the reimbursement path for digital care. Smartphone-based motion capture can reduce hardware needs while allowing clinicians to monitor home exercise programs. This model gives providers a way to extend supervised rehabilitation while easing facility and workforce constraints.
Shift Toward Outcome-Based Rehabilitation and Value-Based Care Restructures Software Demand
Outcome-based payment models are increasing the importance of software in the physical therapy rehabilitation solutions market. CMS quality programs such as MIPS and Qualified Clinical Data Registry reporting encourage providers to document measurable recovery outcomes. Patient-reported outcome tools, analytics platforms, and documentation systems are becoming part of clinical and reimbursement workflows. In May 2026, Medbridge launched its Outcomes platform to collect patient-reported outcomes and support reporting aligned with CMS programs. Providers increasingly need integrated systems rather than standalone therapy management tools. Vendors that combine outcome measurement, reporting, and operational workflows have a clearer route to enterprise adoption, raising the practical threshold for smaller software vendors that lack the resources to build compliant reporting functions.
Restraints Impact Analysis of Physical Therapy Rehabilitation Solutions Market*
| Restraint | (~) % Impact on CAGR Forecast | Geographic Relevance | Impact Timeline |
|---|---|---|---|
| High Acquisition Cost of Advanced Rehabilitation Systems | -2.0% | Global, highest in Asia-Pacific and Middle East and Africa | Long term (≥ 4 years) |
| Limited Reimbursement for Rehabilitation Services | -1.8% | Global, most acute in Asia-Pacific and South America | Medium term (2-4 years) |
| Clinical Validation and Workflow Integration Burden | -1.0% | Global, most acute in North America and Europe | Medium term (2-4 years) |
| Cybersecurity and Patient-Data Governance Risks | -0.8% | Global | Short term (≤ 2 years) |
| Source: Mordor Intelligence | |||
High Acquisition Cost of Advanced Rehabilitation Systems Limits Equitable Access
High acquisition costs constrain adoption of robotics, exoskeletons, and AI-integrated rehabilitation systems, especially outside large tertiary centers. A 2026 scoping review found that the financial viability of technology-assisted stroke rehabilitation depends strongly on the therapist-to-patient supervision ratio. Savings were realized when 1 clinician could supervise multiple patients, so equipment purchase decisions also require workflow redesign. Independent physiotherapy clinics may find this combination difficult to finance. Equipment-as-a-service and outcome-linked leasing are emerging responses in cost-sensitive Asia-Pacific and Middle East and Africa settings. These approaches remain early in adoption, and standardized frameworks for outcome-linked leasing are not yet established by the FDA or national health technology assessment agencies.
Limited Reimbursement for Rehabilitation Services Constrains Demand Conversion
Reimbursement differences limit the conversion of clinical need into paid rehabilitation services. A 2026 study of Dutch experience reported that basic health insurance does not cover physiotherapy, requiring patients to purchase supplementary insurance for coverage. This can reduce use below the level indicated by clinical need. A November 2026 report found that 6.4% of stroke survivors in England, Wales, and Northern Ireland received 3 hours of rehabilitation therapy per day.[3] Funding and staffing pressure contributed to this gap. CARF and Joint Commission standards support quality assurance, but they do not close the reimbursement gap faced by the physical therapy rehabilitation solutions market when technology-enabled care costs exceed coverage.
*Our forecasts treat driver/restraint impacts as directional, not additive. The impact forecasts reflect baseline growth, mix effects, and variable interactions.
Physical Therapy Rehabilitation Solutions Market Segment Analysis
By Solution:
Equipment Anchors Revenue, Software Accelerates FastestEquipment accounted for 46.85% of 2026 revenue, supported by capital purchases in hospitals, long-term care facilities, and established physiotherapy clinics. These buyers use electrotherapy, ultrasound, traction, and robotic training systems across varied treatment needs. BTL Industries reported global revenue above USD 850 million in 2025 and indicated continued double-digit growth in North America for 2026. Services remain the third solution category and include telerehabilitation platforms, managed rehabilitation programs, and clinical outsourcing. Their recurring revenue structure can appeal to institutional buyers. Equipment will remain important where complex cases require direct clinical intervention and dedicated devices.
Software is forecast to grow at an 8.94% CAGR through 2032, the fastest rate among solution types in the physical therapy rehabilitation solutions market. AI-assisted documentation, revenue cycle management, remote therapeutic monitoring, and outcome analytics are driving this adoption. In November 2026, WebPT introduced Aera, a platform designed to manage a rehabilitation practice from referral through paid claim using its Rehab Therapy Knowledge Graph.



By Application:
MSK Dominates, Neurology Is the Technology FrontierMusculoskeletal rehabilitation accounted for 38.42% of 2026 revenue, reflecting the extensive burden of orthopedic and work-related conditions. Digital musculoskeletal platforms are extending this demand into employer-sponsored care models. In January 2026, Sword Health acquired Kaia Health for USD 285 million. Pain management, cardiovascular and pulmonary rehabilitation, and other applications account for the balance of demand and reflect a wider shift toward non-pharmacological rehabilitation pathways.
Neurological Rehabilitation is forecast to expand at an 8.37% CAGR through 2032, positioning it as the technology-led application in the physical therapy rehabilitation solutions market. AI-supported robotics and exoskeletons support high-dose, repetitive motor training intended to promote neuroplasticity. MindMaze Therapeutics and Vibra Healthcare reported in March 2026 that a 210-patient program increased daily supplemental therapy time by 60% and showed statistically significant functional recovery gains against standard care. A 2025 meta-analysis of 37 studies found that robot-assisted rehabilitation significantly improved mobility scores and provided modest balance benefits for stroke patients. Insurers and providers are likely to require this type of clinical evidence before supporting broader adoption. The evidence burden differentiates neurological platforms from general rehabilitation equipment.
By Deployment:
Cloud Leadership Reflects Enterprise Scaling, Hybrid Grows FastestCloud-Based deployment held 52.19% of 2026 revenue, as health systems seek systems that can support multiple sites and integrate with electronic health records. Raintree’s 2025 agreement with Ascension illustrates the demand for cloud-native rehabilitation software in post-acute outpatient care. Cloud platforms can standardize workflows, consolidate data, and support network-level management. On-Premises deployment remains relevant where data residency requirements are strict, or connectivity is limited. Its relative use is declining as infrastructure improves. The physical therapy rehabilitation solutions industry is consequently moving toward platforms that can connect facility care with remote patient engagement.
Hybrid deployment is forecast to grow at an 8.12% CAGR through 2032. This model blends intensive clinic sessions with AI-monitored home exercise and provides a practical structure for care continuity. A 2025 scoping review found that hybrid delivery represented 40% of evaluated postsurgical orthopedic rehabilitation study designs, while home-based models represented 37%. Germany’s DiGA reimbursement framework supports this care design. A 2025 JMIR study found that 36.3% of DiGA users with musculoskeletal conditions also received analog physiotherapy.[4] The Digital Act, or DigiG, supports reimbursable digital pathways and gives providers a framework for combining digital and in-person care.

By End User:
Hospitals Lead Volume, Home Care Leads GrowthHospitals and Outpatient Departments held 42.76% of 2026 revenue. Their position reflects high-acuity patient volumes, capital budgets, and the need for integrated workflows in neurological and post-surgical care. In September 2026, Athletico Physical Therapy selected Raintree Systems as its enterprise EHR partner for a network of nearly 900 clinics across 24 U.S. states. The agreement covered practice management, digital intake, analytics, revenue cycle management, and AI-native note generation. Independent physiotherapy and rehabilitation clinics remain fragmented, while long-term care, nursing facilities, and ambulatory surgical centers are expanding as post-acute care shifts outside inpatient settings.
Home Care Settings are forecast to grow at an 8.65% CAGR through 2032, the fastest end-user rate in the physical therapy rehabilitation solutions market. Lower-cost settings, remote monitoring, and patient demand for recovery at home support this shift. The American Physical Therapy Association identified home-based digital tools as a way to expand access and reduce clinician workload. The association also noted that digital literacy and broadband gaps must be addressed to avoid widening inequities. Computer-vision motion capture through standard smartphone cameras can allow supervised home exercise without specialized hardware. Clinic-based providers will need hybrid pathways if they are to retain patient relationships as home-based delivery becomes more practical.
Geography Analysis
North America
North America held 40.83% of the physical therapy rehabilitation solutions market share in 2026. Mature outpatient infrastructure, commercial and government coverage, and growing digital therapy adoption support the region’s position. The United States remains central to regional demand, while fragmented provider ownership continues to create consolidation opportunities. U.S. Physical Therapy described a national rehabilitation market above USD 40 billion in its 2025 investor materials and noted that no company held more than 10% of the market. The 2026 Medicare Physician Fee Schedule increased the conversion factor by 3.3% for non-APM participants and expanded remote therapeutic monitoring codes. Canada is directing provincial investment toward community and home-based rehabilitation, while private rehabilitation networks and insurance penetration support development in Mexico.
Asia-Pacific
Asia-Pacific is forecast to grow at a 9.24% CAGR through 2032, the fastest geographic rate in the physical therapy rehabilitation solutions market. The region combines demographic scale, health infrastructure investment, and a developing digital health policy base. Japan is developing hybrid models for a population in which around 29.3% of people are aged 65 or older. In India, a 2025 national survey reported musculoskeletal pain prevalence of 16.14% across 12 survey sites and a supply of 0.36 physiotherapists per 10,000 people. The National Digital Health Mission supports integration of digital records across providers, which favors interoperable rehabilitation software. Lifeward’s December 2025 partnership with Singapore-based Verita Neuro to deploy ReWalk exoskeletons in Thailand, the United Arab Emirates, and Mexico shows how rehabilitation robotics distribution is broadening.
Europe Leads in Regulation, MEA and South America Build Capacity
Europe benefits from established reimbursement systems and a growing digitization of clinical workflows. Germany’s statutory insurers reported a 10.4% rise in remedial therapy spending to EUR 14.7 billion by the end of 2025. The 2024 Blankoverordnung reform expanded physiotherapist autonomy in Germany, while DiGA and the NHS Digital Technology Assessment Criteria shape compliance factors for digital rehabilitation. These frameworks influence how the physical therapy rehabilitation solutions market can bring digital care into established treatment pathways. The Middle East and Africa are building capacity through dedicated rehabilitation investments and national plans. The WHO Regional Office for Africa adopted a 2025 strategy that targets national rehabilitation plans with dedicated budgets in 60% of countries.
Competitive Landscape
Market Concentration
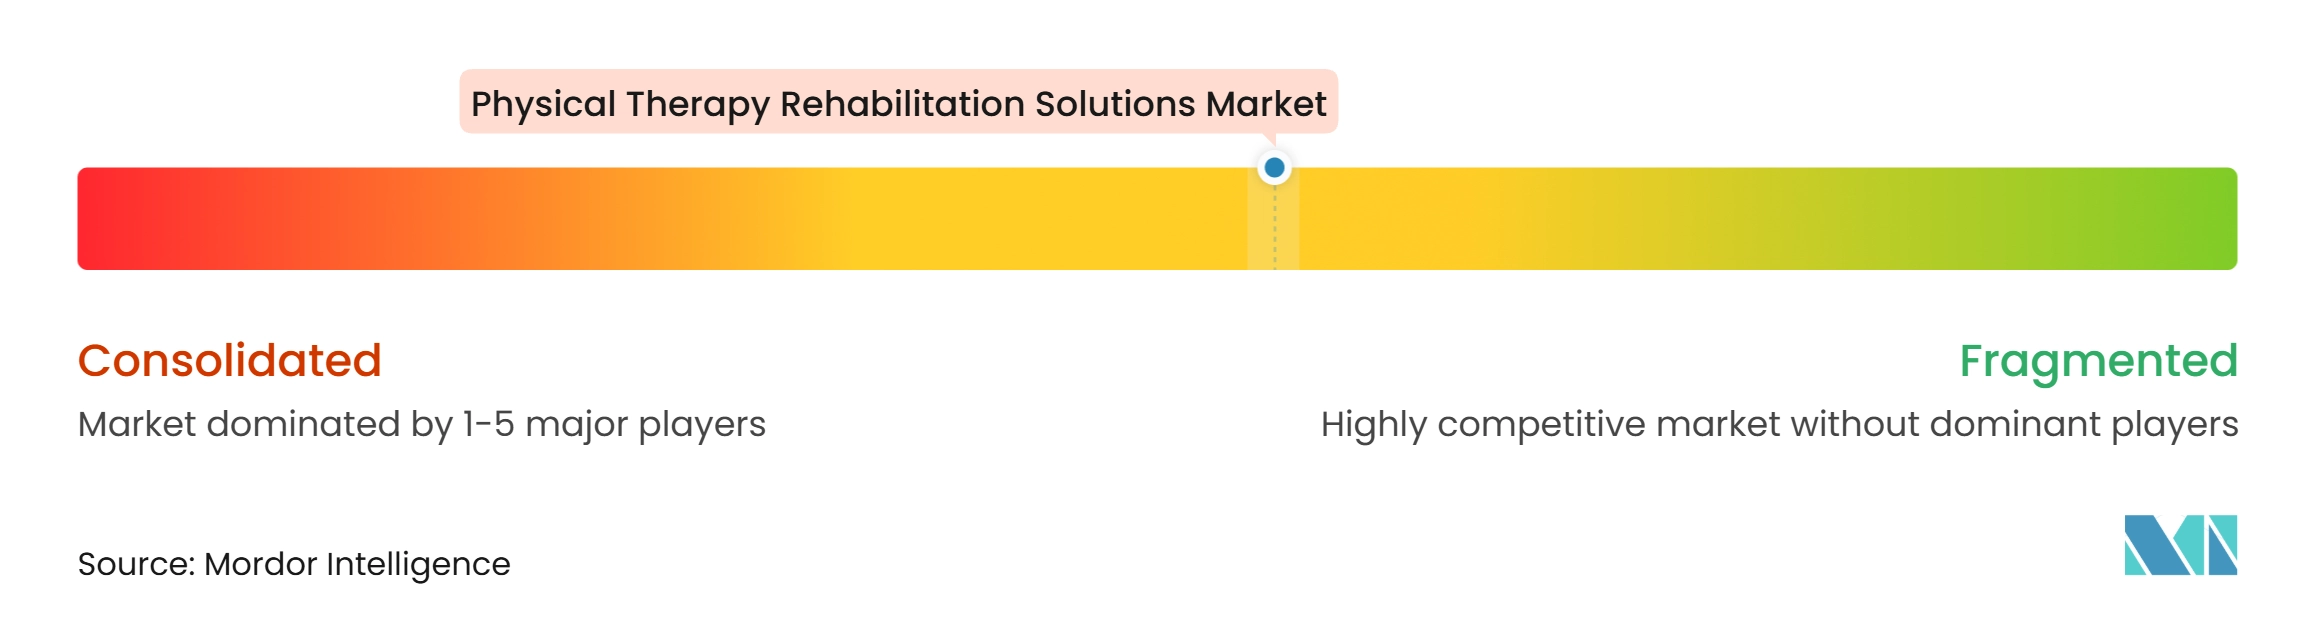
The physical therapy rehabilitation solutions market is moderately fragmented and divided between established medical technology suppliers and digital-first platforms. BTL Industries, Lifeward, Wandercraft, and Tyromotion compete through clinical evidence, regulatory clearances, and long-standing institutional relationships. Digital providers including Hinge Health and Sword Health use employer-sponsored contracts to scale services. Sword Health’s January 2026 acquisition of Kaia Health for USD 285 million strengthened its European digital physical therapy presence. Sword Health also received 3 U.S. patents for personalized communications, recommendations, and computer-vision full-body motion tracking. Intellectual property and acquisitions are becoming closely linked competitive tools in the physical therapy rehabilitation solutions market.
Practice management vendors such as WebPT, Raintree, Net Health, and Physitrack are focusing on AI-enabled workflows. WebPT’s November 2026 Aera launch moved beyond single administrative tools toward a platform that connects referrals, care delivery, and claims processes. Physitrack introduced an agentic AI electronic medical record that attracted more than 7,000 clinicians to early access. These moves show that providers are competing on the ability to reduce operational workload as well as on clinical functionality. Large clinic networks are seeking standardized platforms that can support multi-site growth. The physical therapy rehabilitation solutions market is likely to favor vendors that can meet clinical, operational, and reporting requirements within a single workflow.
Home care, long-term care, and community rehabilitation offer room for new providers in Asia-Pacific and the Middle East and Africa, where large digital platforms remain less established. Startups using low-cost camera-based motion tracking aim to reduce dependence on specialized hardware. Wandercraft’s November 2025 FDA extension for Atalante X covered spinal cord injury from C4 to L5 and multiple sclerosis. This clearance expanded the addressable clinical population through an evidence-led regulatory strategy. IEC 62304 and ISO 13485 remain important benchmarks for scaled platforms in regulated settings.
Physical Therapy Rehabilitation Solutions Industry Leaders
-
BTL Industries
-
Lifeward Ltd
-
Tyromotion GmbH
-
Wandercraft SAS
- *Disclaimer: Major Players sorted in no particular order
Physical Therapy Rehabilitation Solutions Market Companies Covered in this Report
- Altivera Medical Holdings LLC
- BTL
- DIH Holding US Inc.
- Enovis Corporation
- Hinge Health Inc.
- ITO Co. Ltd
- KINVENT
- Lifeward Ltd
- Medical Depot, Inc. (Drive Medical)
- Medline Industries
- Mettler Electronics
- MindMaze Therapeutics Holding SA
- Net Health Systems Inc.
- NuStep LLC
- Performance Health
- Physitrack PLC
- Raintree Systems Inc.
- RECK-Technik GmbH & Co. KG
- Sword Health Inc.
- Tyromotion GmbH
- Wandercraft SAS
- WebPT Inc.
- Zimmer MedizinSysteme
Recent Industry Developments in Physical Therapy Rehabilitation Solutions Market
- November 2026: WebPT introduced Aera, described as the first full-practice AI platform for rehabilitation therapy, capable of managing patient care from referral to paid claim via a Rehab Therapy Knowledge Graph. The launch signals a shift from point-solution automation to integrated practice orchestration, with the potential to materially reduce administrative overhead for multi-site clinic networks.
- September 2026: Athletico Physical Therapy, operating nearly 900 clinics across 24 U.S. states, selected Raintree Systems as its long-term enterprise EHR partner. The contract covers practice management, digital intake, analytics, revenue cycle management, and AI-native note generation organization-wide, representing 1 of the largest clinic-network software standardization agreements of the year.
- September 2026: Lifeward reported Q3 2026 results with AlterG anti-gravity treadmill revenue increasing 18% year over year to USD 3.6 million, the second consecutive quarter of double-digit growth, while simultaneously expanding ReWalk's distribution reach through a new channel-partner program with Ottobock Care, marking a strategic shift from direct sales to scaled network distribution.
- June 2026: MindMaze Therapeutics enrolled the first patients in the SwissNeuroRehab study across 6 major Swiss centers, targeting 300 minutes of active training per week across inpatient, outpatient, and home phases, concurrent with launching the REACT-AVC stroke rehabilitation study at Hospices Civils de Lyon to build health-economic evidence supporting French reimbursement of at-home neurorehabilitation.
Global Physical Therapy Rehabilitation Solutions Market Report Scope
According to the report's scope, the physical therapy rehabilitation solutions market comprises equipment, software, and services designed to support the assessment, treatment, and recovery of patients with physical impairments, injuries, and functional limitations.
The physical therapy rehabilitation solutions market is segmented by solution, application, deployment, end user, and geography. By solution, the market is segmented into Equipment, Software, and Services. By application, the segmentation includes Musculoskeletal Rehabilitation, Neurological Rehabilitation, Pain Management and Functional Restoration, Cardiovascular and Pulmonary Rehabilitation, and Other Applications. By deployment, the market is segmented into On-Premise, Cloud-Based, and Hybrid. By end user, the segmentation includes Hospitals and Outpatient Departments, Independent Physiotherapy and Rehabilitation Clinics, Ambulatory Surgical Centers (ASCs), Long-Term Care and Nursing Facilities, Home Care Settings, and Other End Users. Geographically, the market is analyzed across North America, Europe, the Asia-Pacific region, the Middle East and Africa, and South America. The market report also covers the estimated market sizes and trends for 17 countries across major regions globally. For each segment, the market size and forecast are provided in terms of value (USD).
Segmentation Overview
| Equipment |
| Software |
| Services |
| Musculoskeletal Rehabilitation |
| Neurological Rehabilitation |
| Pain Management and Functional Restoration |
| Cardiovascular and Pulmonary Rehabilitation |
| Other Applications |
| On-Premise |
| Cloud-Based |
| Hybrid |
| Hospitals and Outpatient Departments |
| Independent Physiotherapy and Rehabilitation Clinics |
| Ambulatory Surgical Centers (ASCs) |
| Long-Term Care and Nursing Facilities |
| Home Care Settings |
| Other End Users |
| North America | United States |
| Canada | |
| Mexico | |
| Europe | Germany |
| United Kingdom | |
| France | |
| Italy | |
| Spain | |
| Rest of Europe | |
| Asia-Pacific | China |
| Japan | |
| India | |
| Australia | |
| South Korea | |
| Rest of Asia-Pacific | |
| Middle East and Africa | GCC |
| South Africa | |
| Rest of Middle East and Africa | |
| South America | Brazil |
| Argentina | |
| Rest of South America |
| By Solution | Equipment | |
| Software | ||
| Services | ||
| By Application | Musculoskeletal Rehabilitation | |
| Neurological Rehabilitation | ||
| Pain Management and Functional Restoration | ||
| Cardiovascular and Pulmonary Rehabilitation | ||
| Other Applications | ||
| By Deployment | On-Premise | |
| Cloud-Based | ||
| Hybrid | ||
| By End User | Hospitals and Outpatient Departments | |
| Independent Physiotherapy and Rehabilitation Clinics | ||
| Ambulatory Surgical Centers (ASCs) | ||
| Long-Term Care and Nursing Facilities | ||
| Home Care Settings | ||
| Other End Users | ||
| By Geography | North America | United States |
| Canada | ||
| Mexico | ||
| Europe | Germany | |
| United Kingdom | ||
| France | ||
| Italy | ||
| Spain | ||
| Rest of Europe | ||
| Asia-Pacific | China | |
| Japan | ||
| India | ||
| Australia | ||
| South Korea | ||
| Rest of Asia-Pacific | ||
| Middle East and Africa | GCC | |
| South Africa | ||
| Rest of Middle East and Africa | ||
| South America | Brazil | |
| Argentina | ||
| Rest of South America | ||
Key Questions Answered in the Report
What is the projected size of the physical therapy rehabilitation solutions market?
The sector is valued at USD 31.83 billion in 2026 and is forecast to reach USD 49.52 billion by 2032, at a 7.73% CAGR during 2027-2032.
Which solution type holds the largest revenue position?
Equipment leads with a 46.85% share in 2026, supported by purchases from hospitals, long-term care facilities, and established physiotherapy clinics.
Which rehabilitation application is expanding the fastest?
Neurological Rehabilitation is forecast to grow at an 8.37% CAGR through 2032 as AI-enabled robotics and exoskeletons gain clinical support.
Why is home-based rehabilitation gaining adoption?
Home Care Settings are forecast to grow at an 8.65% CAGR through 2032 because remote monitoring, lower-cost delivery, and patient preferences support care at home.
Which region has the strongest growth outlook?
Asia-Pacific is forecast to grow at a 9.24% CAGR through 2032, supported by demographic needs, infrastructure investment, and digital health programs.