
Physical AI Ecosystem Market Size and Share
Market Overview
| Study Period | 2020 - 2031 |
|---|---|
| Market Size (2026) | USD 26.06 Billion |
| Market Size (2031) | USD 51.47 Billion |
| Growth Rate (2026 - 2031) | 14.58 % |
| Fastest Growing Market | Asia-Pacific |
| Largest Market | North America |
| Market Concentration | Medium |
Major Players *Disclaimer: Major Players sorted in no particular order Image © Mordor Intelligence. Reuse requires attribution under CC BY 4.0. | |
Physical AI Ecosystem Market Analysis by Mordor Intelligence
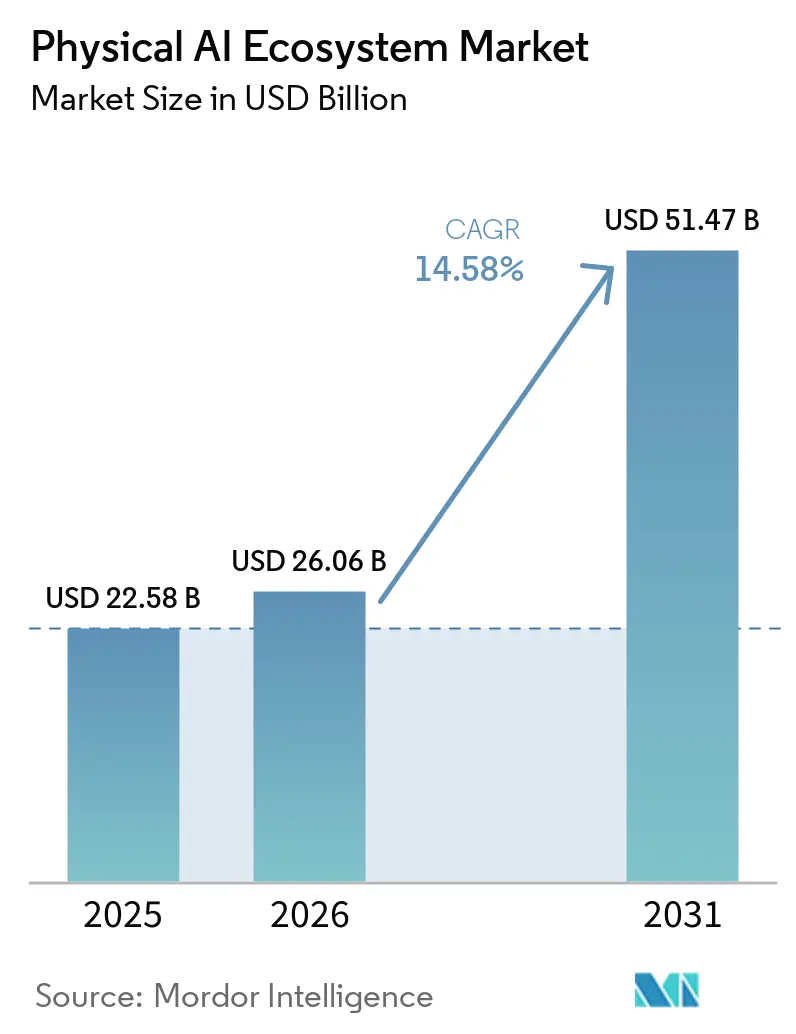
The physical AI ecosystem market size is projected to expand from USD 22.58 billion in 2025 to USD 26.06 billion in 2026, and to USD 51.47 billion by 2031, registering a CAGR of 14.58% from 2026 to 2031. The physical AI ecosystem market is moving from systems that support decisions remotely toward machines that perceive, reason, and act at the point of work. Vision-language-action models, lower hardware costs, and persistent labor gaps are widening the practical use of these systems. Buyers are placing more emphasis on measured payback, integration readiness, and operating reliability than in earlier automation cycles. This favors deployments that can move from a defined pilot to wider use without extensive redesign. The physical AI ecosystem market also depends on suppliers that can combine robot hardware, edge computing, simulation, safety practices, and ongoing site support.
Key Report Takeaways
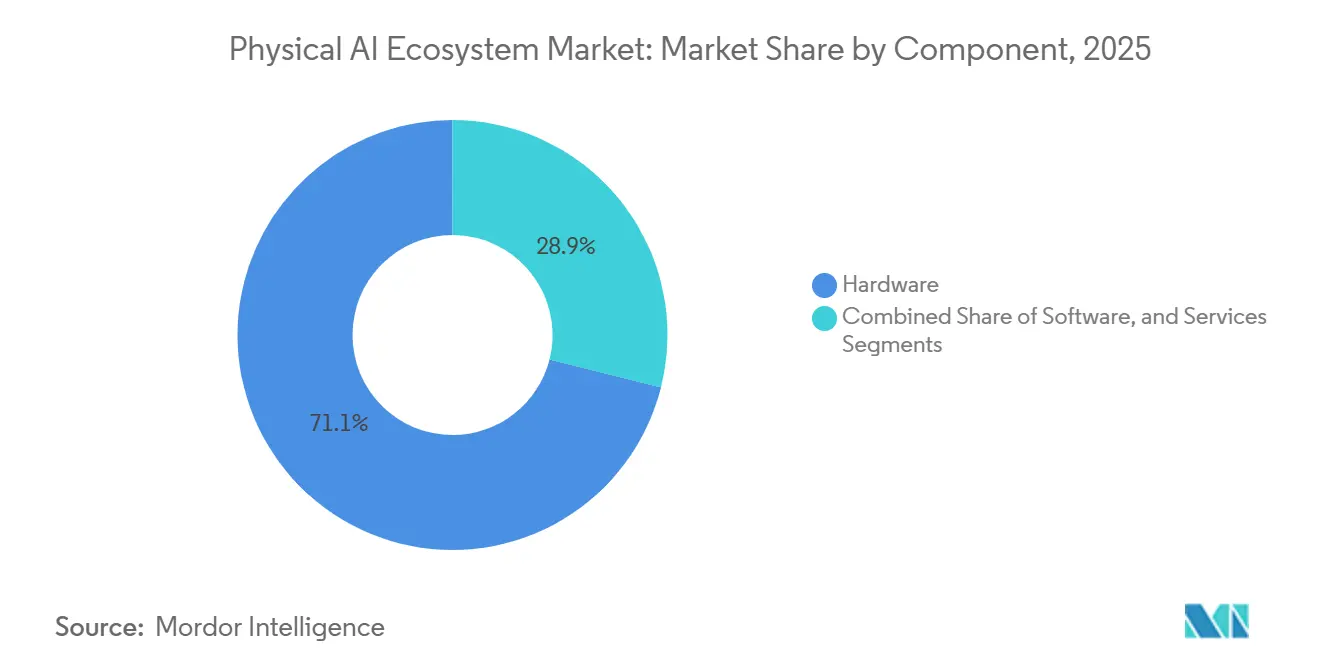
- By component, hardware held 71.08% of the physical AI ecosystem market share in 2025, while software is projected to expand at a 16.32% CAGR through 2031.
- By robot type, industrial robots accounted for 44.59% of the physical AI ecosystem market share in 2025, while personal and household service robots are expected to grow at a 17.04% CAGR through 2031.
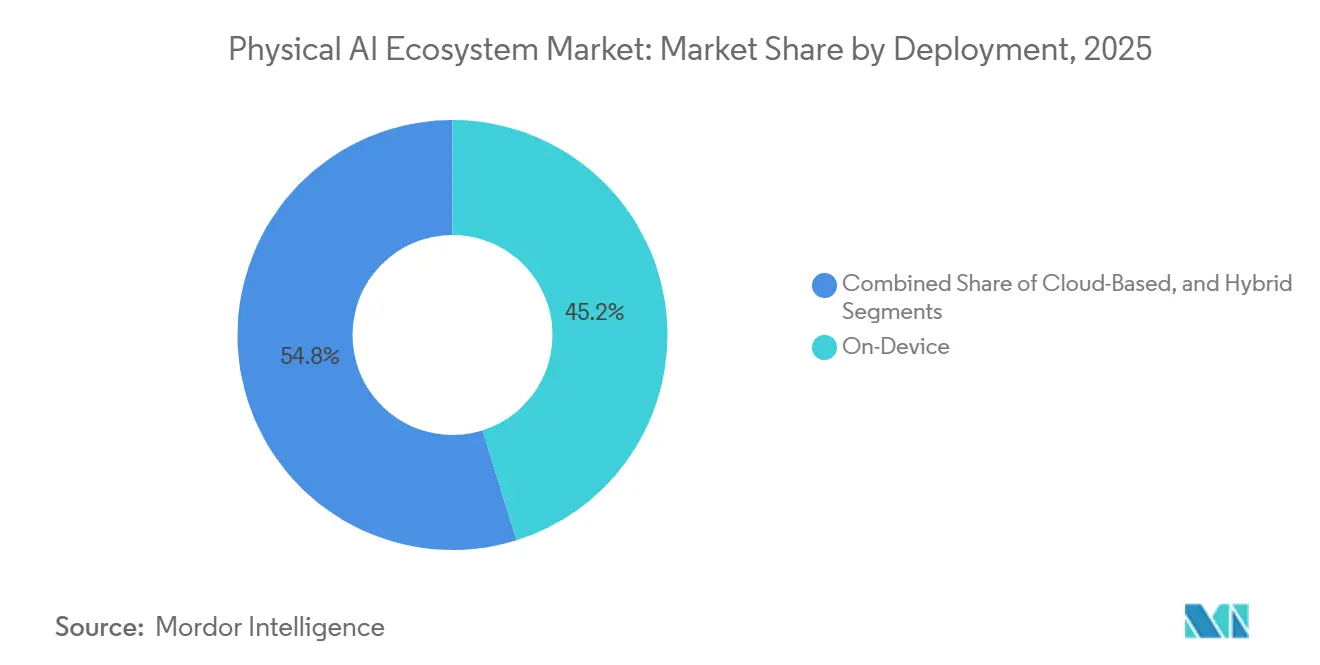
- By deployment, on-device systems held 45.17% of the physical AI ecosystem market share in 2025, while hybrid deployment is projected to grow at a 15.41% CAGR through 2031.
- By end-user vertical, manufacturing accounted for 30.21% of the physical AI ecosystem market share in 2025, while the logistics and supply chain industry is expected to advance at a 18.27% CAGR through 2031.
- By geography, North America held 35.47% of the physical AI ecosystem market share in 2025, while Asia-Pacific is projected to expand at a 18.76% CAGR through 2031.
Note: Market size and forecast figures in this report are generated using Mordor Intelligence’s proprietary estimation framework, updated with the latest available data and insights as of January 2026.
Market Trends and Insights
Drivers Impact Analysis of Physical AI Ecosystem Market*
| Driver | (~) % Impact on CAGR Forecast | Geographic Relevance | Impact Timeline |
|---|---|---|---|
| Low-Latency Edge Inference for Real-Time Autonomy | +2.8% | Global, with concentration in North America, Europe, and Asia-Pacific advanced manufacturing clusters | Medium term (2-4 years) |
| Labor Scarcity in Unstructured Physical Work | +3.2% | Global, most acute in North America, Western Europe, Japan, and South Korea | Short term (≤ 2 years) |
| Flexible Automation in Logistics and Manufacturing | +2.5% | North America and Asia-Pacific core, with spillover to Europe | Medium term (2-4 years) |
| Sim-to-Real Digital Twin Pipelines | +2.1% | Global, with earliest commercial gains in Japan, Germany, and the United States | Long term (≥ 4 years) |
| Proprietary Real-World Action Data Compounding | +1.6% | North America, with early spillover to Asia-Pacific | Long term (≥ 4 years) |
| Sovereign and Safety-Critical Autonomy Programs | +1.4% | Japan, South Korea, Canada, United Kingdom, and the Middle East | Medium term (2-4 years) |
| Source: Mordor Intelligence | |||
Low-Latency Edge Inference for Real-Time Autonomy
The physical AI ecosystem market requires fast local decisions when robots operate near people, equipment, or moving materials. A remote cloud connection can introduce delays that are unsuitable for an automotive line, a hospital corridor, or a mobile machine in a busy warehouse. NVIDIA made its Blackwell-powered Jetson Thor generally available in August 2025, with up to 2,070 FP4 teraflops of AI compute in a 130-watt power envelope and a USD 3,499 developer kit price.[1] The company reported 7.5 times higher AI compute and 3.5 times greater energy efficiency than its predecessor. These specifications make edge inference a core design choice for equipment that must respond within a tight operational window. Suppliers without robot-focused inference stacks may therefore face a narrower opportunity to remain relevant in physical AI deployments.
Labor Scarcity in Unstructured Physical Work
Labor constraints support demand in the physical AI ecosystem market because many difficult jobs take place in settings that conventional automation does not handle well. The remaining gaps include picking nonuniform parcels, managing variation across mixed-product lines, and working in wet, confined, or unpredictable spaces. These tasks combine commercial urgency with the type of operating data needed to improve physical AI models. The shortage is not limited to factory roles, as logistics, healthcare support, construction, and field operations also depend on workers to perform varied physical tasks. A system that can adjust to changing layouts or objects can be more useful than fixed automation in these settings. This alignment between unmet labor needs and technical progress increases the value of practical deployments that can be operated safely at the site level.
Flexible Automation in Logistics and Manufacturing
The physical AI ecosystem market benefits when manufacturers and logistics operators replace fixed layouts with systems that can adapt to changing product mixes and throughput targets. The International Federation of Robotics reported that material-handling robots represented 60% of North American industrial robot orders in the first quarter of 2026.[2] This pattern reflects a move toward mobile and AI-capable fleets rather than equipment that only serves one fixed route or task. Flexible systems can also produce a wider range of operating examples than single-task cells. Those examples can strengthen model training and improve the value of early deployments over time. Operators still need disciplined integration work, since flexibility does not remove the need for safety validation, workflow design, or staff preparation.
Sim-to-Real Digital Twin Pipelines
Simulation is an important part of the physical AI ecosystem market because training on real machines can be slow and expensive. NVIDIA stated that its Cosmos 3 Edge model can provide on-device vision reasoning and robot action generation at 15 Hz on Jetson Thor. The company also said the open Cosmos framework can adapt to a new robot embodiment in 1 day. Digital models allow developers to test many operating conditions before a robot is placed in a production environment. However, transfer from simulation to a live setting remains dependent on each robot's sensors, kinematics, and working conditions. This can give vertically integrated suppliers an advantage while limiting the ease with which software moves across different OEM platforms.
Restraints Impact Analysis of Physical AI Ecosystem Market*
| Restraint | (~) % Impact on CAGR Forecast | Geographic Relevance | Impact Timeline |
|---|---|---|---|
| High Integration Cost and Long Commissioning Cycles | -2.2% | Global, most acute for SMEs in Europe and South and Southeast Asia | Short term (≤ 2 years) |
| Certification, Liability, and Functional Safety Complexity | -1.5% | North America and the European Union, with spillover to Japan and South Korea | Medium term (2-4 years) |
| Scarcity of Long-Tail Physical Interaction Data | -1.1% | Global | Long term (≥ 4 years) |
| Energy, Thermal, and Battery Constraints in Mobile Embodiments | -0.9% | Global, most visible in mobile and humanoid deployments across all regions | Long term (≥ 4 years) |
| Source: Mordor Intelligence | |||
High Integration Cost and Long Commissioning Cycles
The physical AI ecosystem market faces a near-term constraint because deployment costs extend beyond the robot purchase. Integration services, software customization, safety checks, operator training, and workflow changes can add materially to the initial budget. Complex manufacturing projects can require 12 to 18 months beyond original timelines when systems must be tuned to operating conditions not reflected in simulation. Small and midsize enterprises are particularly exposed because they may lack the integration experience and financial capacity to absorb project overruns. Long commissioning cycles also delay the availability of the operating data that vendors need to refine robot behavior. Commercial models that simplify setup, improve service coverage, or reduce site-specific engineering can therefore have a meaningful advantage.
Certification, Liability, and Functional Safety Complexity
Safety requirements can delay adoption in the physical AI ecosystem market, particularly when systems operate in proximity to employees or perform regulated tasks. ISO 10218:2025 updated the industrial robot safety standard to cover functional safety, collaborative operation, and cybersecurity. Existing approval pathways were developed for more deterministic systems, while adaptive AI models can change their behavior as operating data expands. ISO/IEC TR 5469:2024 addresses functional safety and AI systems, which supports a more consistent basis for evaluating these risks. NVIDIA stated that its Halos AI Systems Inspection Lab is an ANAB-accredited ISO/IEC 17020 inspection body for AI and functional safety in autonomous vehicles and robotics. Healthcare and defense projects may face especially long approval cycles, even when the underlying technology is mature.
*Our forecasts treat driver/restraint impacts as directional, not additive. The impact forecasts reflect baseline growth, mix effects, and variable interactions.
Physical AI Ecosystem Market Segment Analysis
By Component:
Software Value Stacks Reshape Hardware-Dominated RevenueHardware accounted for 71.08% of the physical AI ecosystem market share in 2025 because every embodied system requires sensors, actuators, manipulators, processors, and power equipment. Industrial robots and mobile platforms remain capital-intensive, so the hardware bill of materials accounts for a large share of project spending. Reliability, payload, motion precision, operating duration, and environmental fit remain hardware-led considerations. These requirements make platform selection central to deployment decisions and sustain relationships between OEMs, integrators, and end users. The physical AI ecosystem market remains anchored in equipment that can be serviced, supported, and adapted over its operating life.
Software is projected to grow at a 16.32% CAGR through 2031, the highest rate among components. World foundation models, fleet orchestration tools, simulation environments, and digital twin platforms can be sold as separate revenue layers rather than embedded robot features. NVIDIA introduced GR00T N1.7 in early commercial access at GTC 2026, indicating a move toward model software as a distinct commercial layer. Services also remain important because multi-OEM fleets need commissioning, training, optimization, and continuing support. ISO/IEC TR 5469:2024 creates an additional need for AI functional safety evaluation and related specialist services.

By Robot Type and Embodiment:
Industrial Scale Meets Humanoid DevelopmentIndustrial robots accounted for 44.59% of the physical AI ecosystem market size in 2025. Their lead reflects proven use in automotive, electronics, and metals production, where reliability and repeatable motion have been demonstrated over time. The International Federation of Robotics recorded 542,000 global industrial robot installations in 2024, more than twice the level of 10 years earlier. Asia accounted for 74% of new installations, with China installing 295,000 units, and the global operational stock reached 4,664,000 units. This installed base gives industrial platforms a practical foundation for adding AI capabilities.[3]
Personal and household service robots are expected to grow at a 17.04% CAGR through 2031. Consumer settings create varied interactions with people, objects, layouts, and changing conditions that can provide broad data for model development. Professional service robots also support surgery, inspection, logistics, and field applications, where AI can extend task flexibility. 1X Technologies began production at its NEO Factory in Hayward, California, with an initial annual capacity of 10,000 units, intended for home users, starting in 2026. FANUC reported that it had shipped more than 1,000 robots for physical AI-related applications after its December 2025 product launch.
By Deployment:
On-Device Systems Support a Hybrid PathOn-device deployment held 45.17% of the physical AI ecosystem market share in 2025. The lead reflects the need for latency, safety, and data residency in manufacturing, defense, and surgical work. Local inference enables machines to respond without a constant cloud round-trip and can protect sensitive operational data. This architecture is most relevant for safety-critical actions and tasks requiring predictable response times. The physical AI ecosystem market is closely tied to edge processors and local software stacks that match each robot's power and thermal limits.
Hybrid deployment is projected to grow at a 15.41% CAGR through 2031. It combines local execution for urgent functions with cloud resources for telemetry analysis, fleet oversight, model improvement, and digital twin simulation. This permits continuing data flows without assigning safety-critical actions to remote computing. Siemens and NVIDIA expanded their partnership at CES 2026 to develop an AI-driven adaptive manufacturing site at the Siemens Electronics Factory in Erlangen, Germany. The initiative integrates edge inference with cloud-based digital twin simulation, while cloud deployment remains useful for training and monitoring workloads.[4]
By End-User Vertical:
Manufacturing Scale and Logistics DemandManufacturing accounted for 30.21% of the physical AI ecosystem market in 2025. The sector has the deepest installed base of robotic equipment and established uses in assembly, welding, painting, and quality inspection. Automotive remains the largest global manufacturing customer group for industrial robots, although demand from general industry is now outpacing automotive in several markets. Electronics and consumer goods production provide a wider base for systems that manage more variation than earlier programmed equipment. This range of applications gives physical AI suppliers several established routes into factory operations.
The logistics and supply chain industry is projected to grow at a 18.27% CAGR through 2031, the fastest rate across end-user verticals. E-commerce volume and warehouse labor shortages are increasing demand for flexible mobile systems and handling equipment. Material-handling robots accounted for 60% of North American industrial robot orders in the first quarter of 2026. Healthcare, defense and security, construction, mining, and energy are also important areas of use. Boston Dynamics and FieldAI partnered in March 2026 to apply the Spot platform and Field Foundation Models to dynamic construction and mining environments.
Geography Analysis
North America Physical AI Ecosystem Market
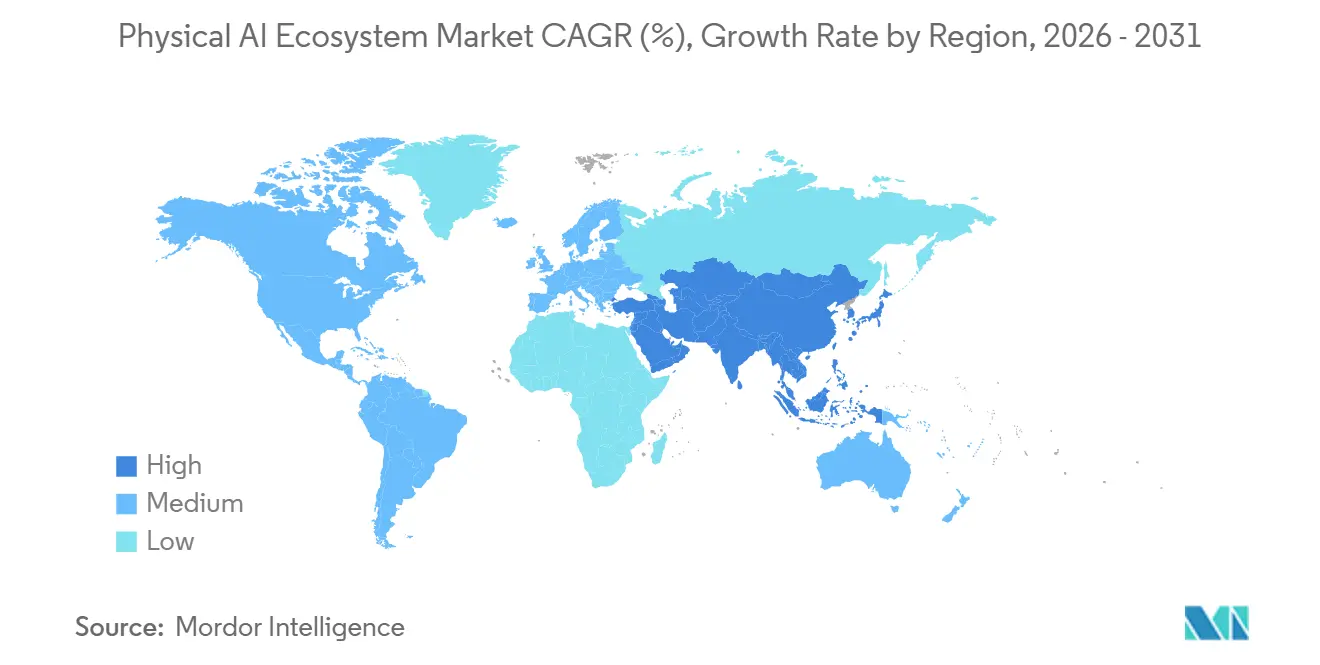
North America accounted for 35.47% of the physical AI ecosystem market share in 2025. The region combines AI-native robotics firms, substantial corporate investment capacity, and reshoring activity that is increasing the need for flexible production equipment. U.S. robot installations rebounded in 2025 after 2 years of declines, with food production, warehousing, and logistics supporting the recovery. North America had 204 robots per 10,000 manufacturing employees in 2024. This was below Western Europe's 267 and South Korea's 1,220, leaving scope for higher automation density.
APAC Physical AI Ecosystem Market
Asia-Pacific is projected to expand at an 18.76% CAGR through 2031, the fastest geographic rate in the physical AI ecosystem market. China is the region's central industrial robot base, with 295,000 installations in 2024 and domestic manufacturers holding 57% of its domestic robot market.[5] Japan and South Korea are extending this strength through domestic physical AI programs, and South Korea designated physical AI as a key K-Moonshot mission in February 2026. South Korea deployed a domestic Physical AI Integrated Platform at KAIST for automobiles, precision manufacturing, and shipbuilding. India complements China in the regional industrial robot landscape, recording 9,100 installations in 2024 and drawing manufacturing automation investment linked to production incentive programs.
EMEA and South America Physical AI Ecosystem Market
Europe held the second-largest regional position in 2025, supported by a deep installed base, established automation suppliers, and Western European robot density of 267 per 10,000 manufacturing employees. Germany accounted for 32% of Europe's annual robot installations in 2024, although regional installations declined by 8% that year amid weakening automotive conditions. The European Union's Machinery Regulation and Cyber Resilience Act are shaping procurement requirements for connected robots. The Middle East is advancing robotics in construction, energy, and logistics, while Africa and South America remain early-stage regions focused on mining and agriculture.
Competitive Landscape
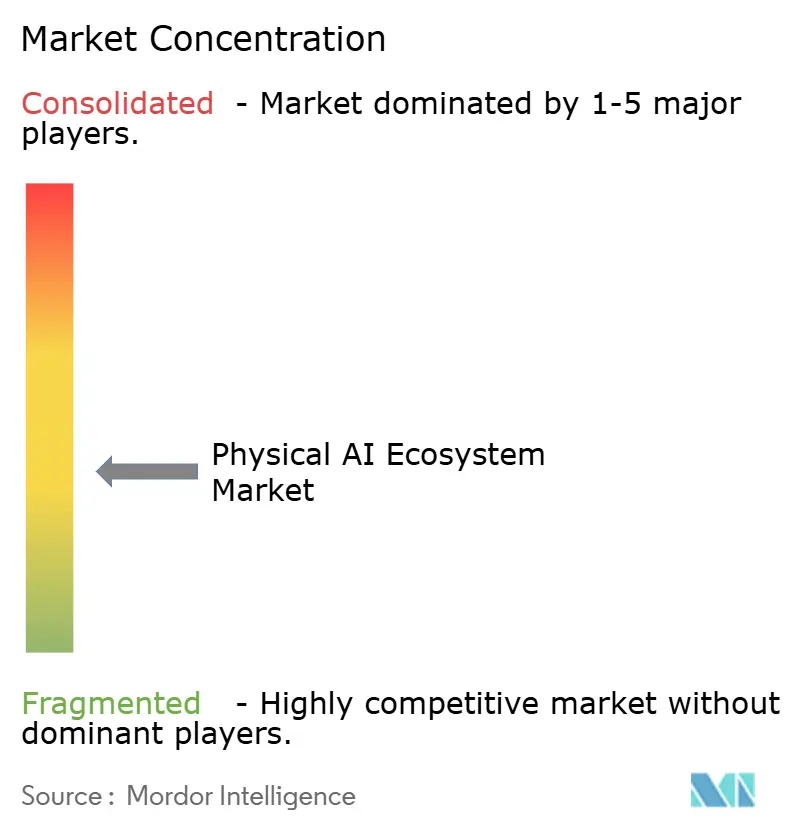
The physical AI ecosystem market remained moderately fragmented, with two broad groups of competitors. Established industrial automation OEMs are adding AI layers to hardware platforms supported by long-established customer relationships. AI-native firms are developing offerings that combine models, simulation tools, and robot hardware. Hardware remains relatively concentrated among a limited group of global suppliers, while software and model development are more fragmented. Service networks, operating data, model quality, and functional safety capability are important sources of advantage.
Skild AI expanded collaborations with ABB Robotics, Universal Robots, and NVIDIA in March 2026 to deploy its omni-bodied brain on Foxconn's Blackwell assembly lines. This shows how AI software companies can work with incumbent hardware providers rather than seek to replace them. Multi-robot orchestration across different OEM fleets remains an important opportunity because it has not been solved at scale. Healthcare and construction also need sector-specific models that can handle specialized conditions. Certified physical AI platforms remain limited, especially for applications governed by ISO 10218:2025 and ISO/IEC TR 5469:2024.
Google DeepMind introduced Gemini Robotics 2 in July 2026, with whole-body humanoid control, advanced dexterity, and multi-robot collaboration across multiple embodiments. The company made the reasoning model available on Google AI Studio and in private preview on Gemini Enterprise Agent Platform. The physical AI ecosystem market can reward companies that protect model capabilities through intellectual property and exclusive data access. Companies that connect training data, simulation, real equipment, and field service may be better positioned to build durable customer relationships.
Physical AI Ecosystem Industry Leaders
-
NVIDIA Corporation
-
ABB Ltd
-
KUKA AG
-
Boston Dynamics, Inc.
-
Tesla, Inc.
- *Disclaimer: Major Players sorted in no particular order
Physical AI Ecosystem Market Companies Covered in this Report
- NVIDIA Corporation
- ABB Ltd
- KUKA AG
- Boston Dynamics, Inc.
- Tesla, Inc.
- FANUC Corporation
- YASKAWA Electric Corporation
- Agility Robotics, Inc.
- Figure AI, Inc.
- NEURA Robotics GmbH
- Universal Robots A/S
- Teradyne, Inc.
- OMRON Corporation
- Siemens AG
- Hyundai Motor Company
- SoftBank Robotics Group Corp.
- Physical Intelligence, Inc.
- Covariant, Inc.
- Dexterity, Inc.
- Apptronik, Inc.
- 1X Technologies AS
- Sanctuary Cognitive Systems Corporation
- Skild AI, Inc.
- Google DeepMind
Recent Industry Developments in Physical AI Ecosystem Market
- July 2026: Komatsu and AIM Intelligent Machines entered a strategic partnership to deliver autonomous construction solutions using bulldozers and hydraulic excavators in Japan and the United States, entering the commercial deployment phase for sites already operating in the U.S. market.
- July 2026: Mitsubishi Motors and Highlanders signed an MOU to develop and mass-produce humanoid robots for Mitsubishi Motors' manufacturing facilities at the Kyoto Plant, with production expected to commence in early 2027.
- July 2026: Google DeepMind introduced Gemini Robotics 2, enabling whole-body humanoid control, advanced dexterity, and multi-robot collaboration across multiple embodiments, with the reasoning model made available on Google AI Studio and in private preview on Gemini Enterprise Agent Platform.
- May 2026: FANUC announced a strategic collaboration with Google, incorporating Gemini Enterprise into FANUC's Physical AI Robot System, enabling natural-language-driven autonomous robot operation. FANUC reported shipping more than 1,000 robots for physical AI applications since its December 2025 launch.
- April 2026: Siemens and Humanoid successfully tested the HMND 01 wheeled Alpha humanoid robot at Siemens' Erlangen electronics factory, performing autonomous logistics tasks using NVIDIA Jetson Thor for edge compute and Isaac Sim for simulation-first training, a live production milestone for the Siemens-NVIDIA Industrial AI Operating System partnership.
Global Physical AI Ecosystem Market Report Scope
The Physical AI Ecosystem Market comprises the network of technologies, hardware, software, AI models, sensors, edge computing platforms, robotics systems, and supporting services that enable artificial intelligence to function in physical environments. This market supports applications such as autonomous robots, smart factories, intelligent vehicles, digital twins, and human-machine collaboration, enabling AI systems to perceive, analyze, and act in real-world settings.
Physical AI Ecosystem Market Report is Segmented by Component (Hardware, Software, and Services), Robot Type and Embodiment (Industrial Robots, Professional Service Robots, Personal and Household Service Robots, and Other Robot Type and Embodiments), Deployment (On-Device, Cloud-Based, and Hybrid), End-User Vertical (Logistics and Supply Chain, Manufacturing, Healthcare, Automotive and Mobility, Defense and Security, Construction, Mining, and Energy, and Other End-User Verticals), and Geography (North America, South America, Europe, Asia-Pacific, Middle East, and Africa). The Market Forecasts are Provided in Terms of Value (USD).
Segmentation Overview
| Hardware |
| Software |
| Services |
| Industrial Robots |
| Professional Service Robots |
| Personal and Household Service Robots |
| Other Robot Type and Embodiments |
| On-Device |
| Cloud-Based |
| Hybrid |
| Logistics and Supply Chain |
| Manufacturing |
| Healthcare and Life Sciences |
| Automotive and Mobility |
| Defense and Security |
| Construction, Mining, and Energy |
| Other End-User Verticals |
| North America | United States |
| Canada | |
| South America | Brazil |
| Mexico | |
| Rest of South America | |
| Europe | Germany |
| United Kingdom | |
| France | |
| Italy | |
| Spain | |
| Russia | |
| Rest of Europe | |
| Asia-Pacific | China |
| Japan | |
| South Korea | |
| India | |
| Australia | |
| Rest of Asia-Pacific | |
| Middle East | Saudi Arabia |
| United Arab Emirates | |
| Turkey | |
| Israel | |
| Rest of Middle East | |
| Africa | South Africa |
| Egypt | |
| Rest of Africa |
| By Component | Hardware | |
| Software | ||
| Services | ||
| By Robot Type and Embodiment | Industrial Robots | |
| Professional Service Robots | ||
| Personal and Household Service Robots | ||
| Other Robot Type and Embodiments | ||
| By Deployment | On-Device | |
| Cloud-Based | ||
| Hybrid | ||
| By End-User Vertical | Logistics and Supply Chain | |
| Manufacturing | ||
| Healthcare and Life Sciences | ||
| Automotive and Mobility | ||
| Defense and Security | ||
| Construction, Mining, and Energy | ||
| Other End-User Verticals | ||
| By Geography | North America | United States |
| Canada | ||
| South America | Brazil | |
| Mexico | ||
| Rest of South America | ||
| Europe | Germany | |
| United Kingdom | ||
| France | ||
| Italy | ||
| Spain | ||
| Russia | ||
| Rest of Europe | ||
| Asia-Pacific | China | |
| Japan | ||
| South Korea | ||
| India | ||
| Australia | ||
| Rest of Asia-Pacific | ||
| Middle East | Saudi Arabia | |
| United Arab Emirates | ||
| Turkey | ||
| Israel | ||
| Rest of Middle East | ||
| Africa | South Africa | |
| Egypt | ||
| Rest of Africa | ||
Key Questions Answered in the Report
What is the size of the physical AI ecosystem market?
The physical AI ecosystem market size is projected to expand from USD 22.58 billion in 2025 to USD 26.06 billion in 2026, and to USD 51.47 billion by 2031, registering a CAGR of 14.58% from 2026 to 2031.
What is driving adoption of physical AI systems?
Edge inference, labor shortages in varied physical tasks, flexible automation needs, and simulation tools support adoption.
Which component leads physical AI spending?
Hardware led with a 71.08% share in 2025 because systems require sensors, actuators, processors, manipulators, and power equipment.
Which robot type is growing fastest?
Personal and household service robots are expected to expand at a 17.04% CAGR through 2031.
Which end-user area is expanding fastest?
Logistics and supply chain is projected to grow at an 18.27% CAGR through 2031 as operators add flexible automation.
Which region is expected to grow fastest?
Asia-Pacific is projected to expand at an 18.76% CAGR through 2031, supported by China, Japan, South Korea, and India.