Market Overview
| Study Period | 2020 - 2031 |
|---|---|
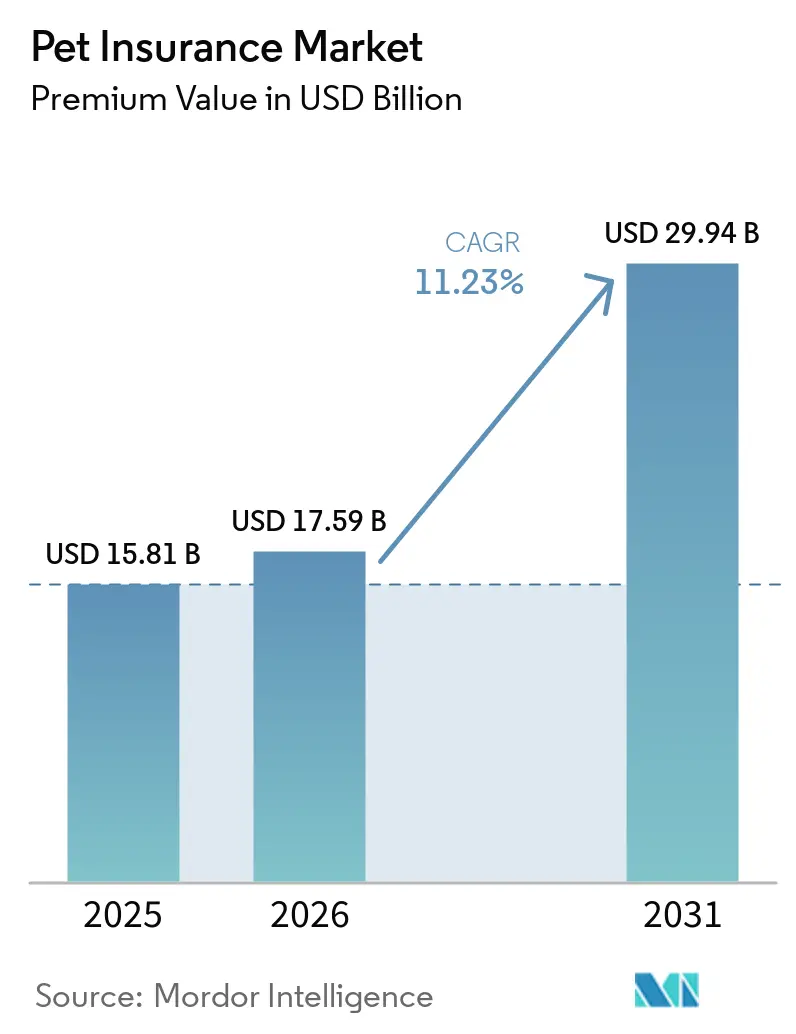
| Market Size (2026) | USD 17.59 Billion |
| Market Size (2031) | USD 29.94 Billion |
| Growth Rate (2026 - 2031) | 11.23% CAGR |
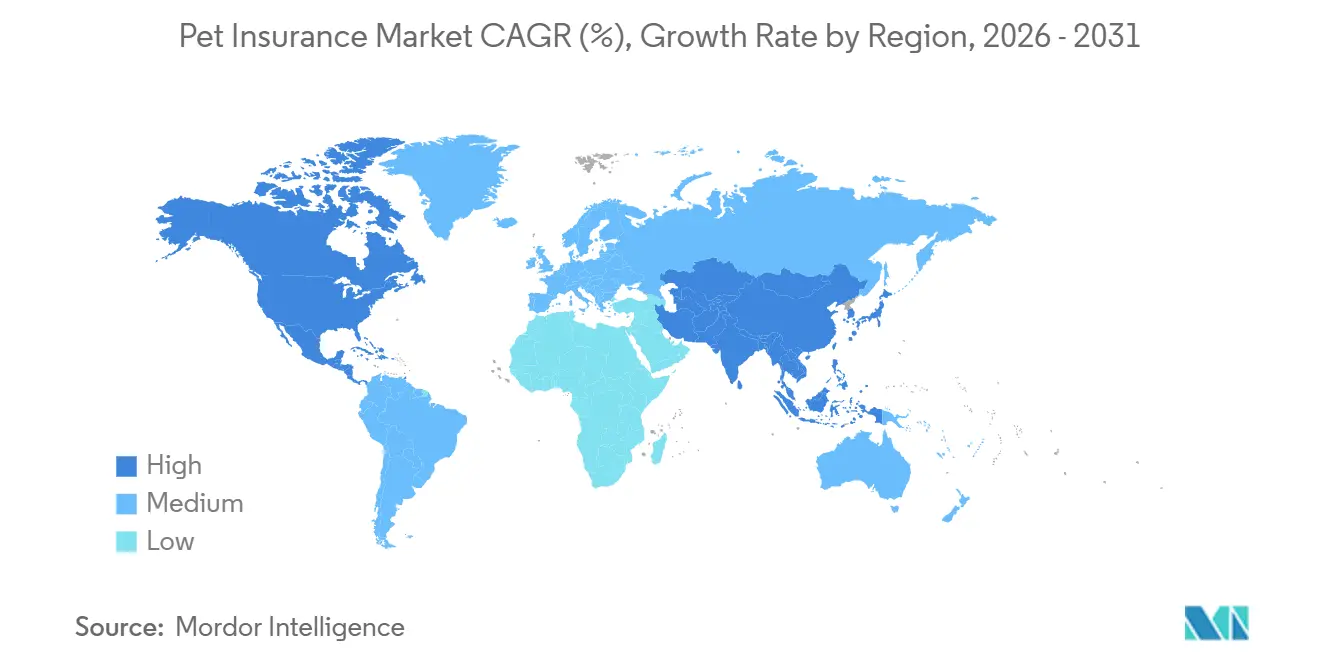
| Fastest Growing Market | Asia Pacific |
| Largest Market | Europe |
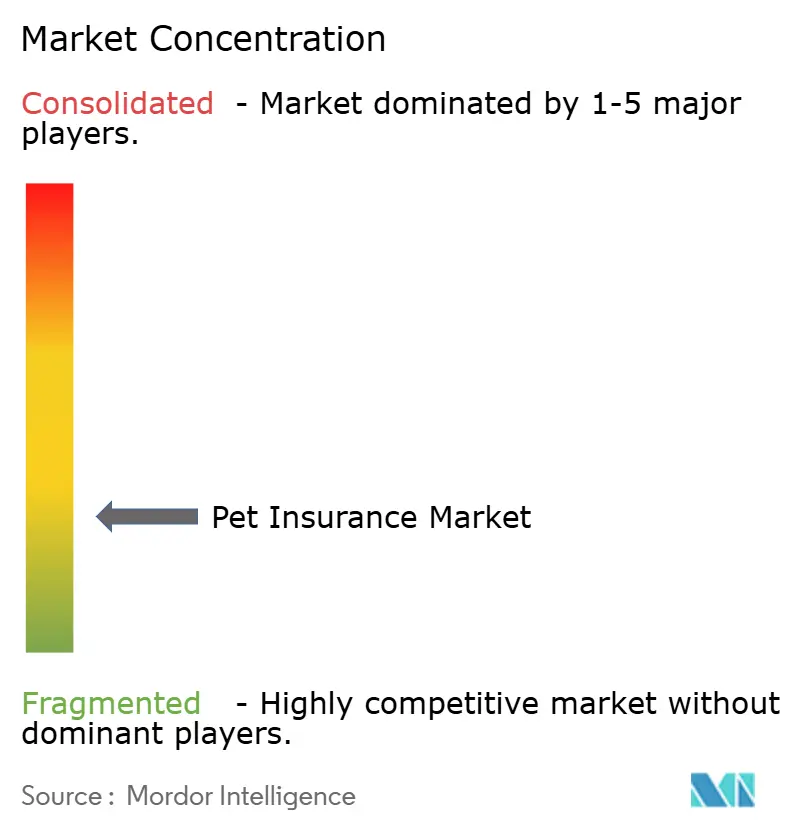
| Market Concentration | Low |
Major Players *Disclaimer: Major Players sorted in no particular order Image © Mordor Intelligence. Reuse requires attribution under CC BY 4.0. | |
Pet Insurance Market Analysis by Mordor Intelligence
The Pet Insurance Market size in terms of premium value is projected to expand from USD 15.81 billion in 2025 and USD 17.59 billion in 2026 to USD 29.94 billion by 2031, registering a CAGR of 11.23% between 2026 to 2031.
Penetration diverges widely across markets, with Sweden having near universal coverage among dogs, while the United States remains in the low single digits for companion animals, yet the gap in veterinary cost inflation versus general inflation keeps demand resilient as owners seek predictable budgeting for care. Pet owners spend a large share of their budgets on veterinary care, but cost sensitivity leads some to delay or skip visits. This creates opportunities for pet insurance, as many pets remain uninsured and owners seek ways to manage unexpected expenses. Veterinary services account for about 32% of household pet spending, and rising costs are influencing care utilization and preventive care engagement[1]Veterinary Analytics, “Veterinary Industry Summary: October 12 18, 2025,” Vetsource Veterinary Analytics, veterinaryanalytics.com. Embedded distribution at the point of care and retail checkout reduces friction by presenting coverage offers at moments of high intent, while employer-sponsored voluntary benefits broaden access without adding cost to benefit budgets. Insurers and insurtechs deploy automation to compress underwriting and adjudication cycles, with large language models and straight-through processing lowering loss-adjustment expenses and improving customer experience at scale.
Key Report Takeaways
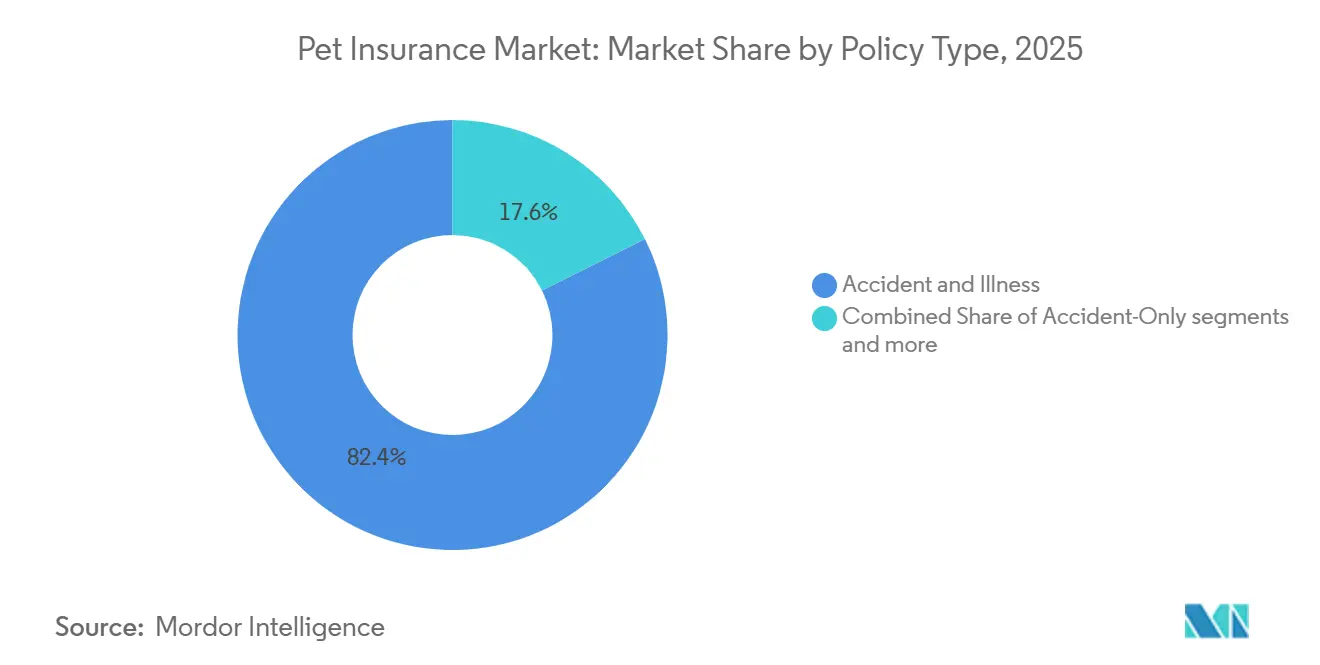
- By policy type, accident & illness led with 82.36% of the pet insurance market share in 2025, while wellness and preventive-care add-ons are forecasted to expand at a 15.39% CAGR through 2031.
- By animal type, dogs captured 74.82% of the pet insurance market share in 2025, and other pets recorded the fastest momentum with a 13.95% CAGR projected to 2031; dogs remain the anchor of the pet insurance market.
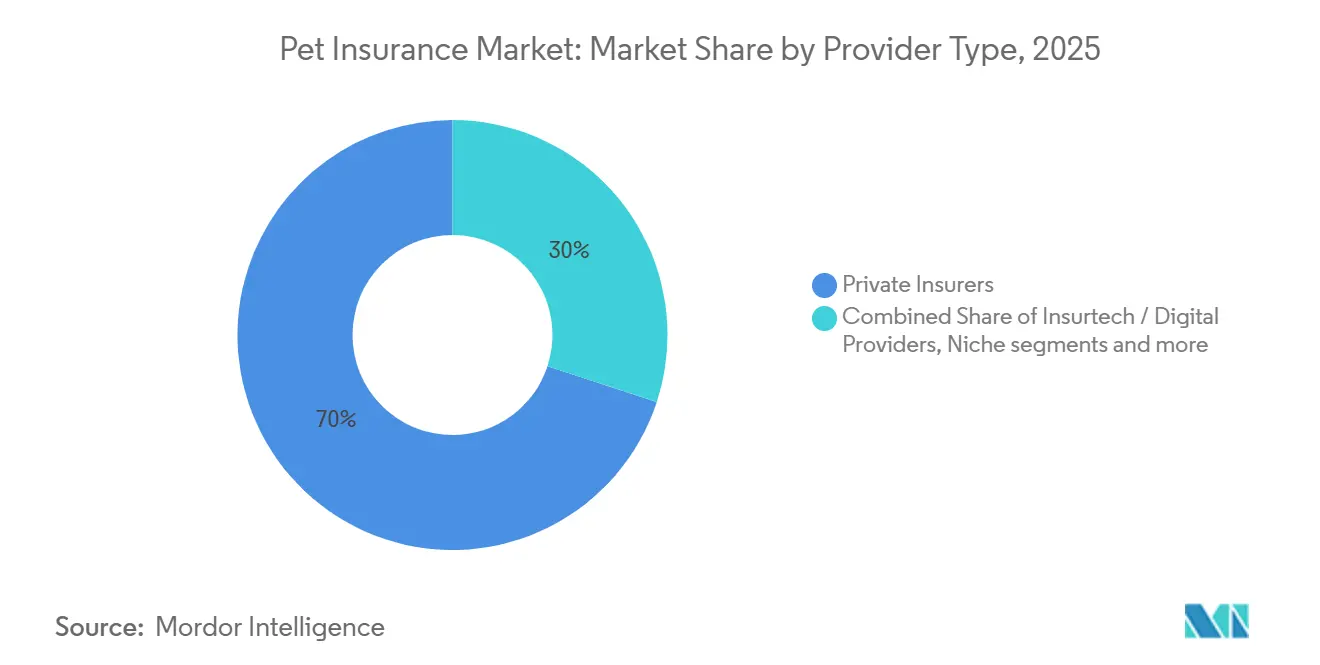
- By provider type, traditional carriers held 69.96% of the pet insurance market share in 2025, while insurtech and digital providers are set to grow at a 16.45% CAGR through 2031.
- By sales channel, the intermediated model accounted for 48.66% of the pet insurance market share in 2025, and embedded models are expected to expand at an 18.66% CAGR through 2031.
- By geography, Europe held 45.23% of the pet insurance market share in 2025, while Asia-Pacific is projected to grow at a 14.89% CAGR through 2031.
Note: Market size and forecast figures in this report are generated using Mordor Intelligence’s proprietary estimation framework, updated with the latest available data and insights as of January 2026.
Market Trends and Insights
Drivers Impact Analysis of Pet Insurance Market*
| Driver | (~) % Impact on CAGR Forecast | Geographic Relevance | Impact Timeline |
|---|---|---|---|
| Rising pet adoption and pet humanization | +3.2% | Global, concentrated in North America, Western Europe | Medium term (2-4 years) |
| Escalating veterinary costs outpacing CPI | +2.8% | Global, acute in the United States, the United Kingdom, and Australia | Short term (≤ 2 years) |
| NAIC Model Act rollout and regulatory advancements | +1.1% | United States, spillover to Canada | Long term (≥ 4 years) |
| Embedded insurance in pet-care ecosystems | +2.4% | Europe leads, North America acceleration, APAC emerges | Medium term (2-4 years) |
| Employer-sponsored pet-benefit programs | +1.3% | North America, early Western Europe | Medium term (2-4 years) |
| AI-driven dynamic underwriting and real-time claims automation | +1.5% | Developed markets with cloud infrastructure | Medium term (2-4 years) |
| Source: Mordor Intelligence | |||


Rising Pet Adoption and Pet Humanization Trend
United States pet ownership remains elevated and continues to expand in 2026, with approximately 94 million households owning at least one pet, as younger households add dogs and cats at a faster rate and sustain higher per-pet spending than older cohorts. The dog population reached about 87.3 million and the cat population about 76.3 million in 2025, reflecting both growth and the narrowing gap between species. Pet owners increasingly treat pets as family members, spending an average of USD 1,700 per household annually on pet-related expenses, with veterinary services accounting for about 32% of these expenditures [2]PetfoodIndustry, “Chart: Cats and dogs lead US pet ownership growth 2023 2025,” petfoodindustry.com. This mindset drives prioritization of premium foods, preventive care, and timely specialist interventions, supporting consistent veterinary utilization even when budgets tighten, which preserves demand for insurance coverage that caps exposure to surprise bills and smooths cash flows across a pet’s lifespan. While insurance adoption in the United States still trails sentiment, steady gains in awareness and digital purchase journeys are narrowing the gap with more mature European markets. Insights from Japan further demonstrate that higher penetration and convenient direct-settlement options can accelerate uptake when owners perceive clear value at the point of care.
Escalating Veterinary Costs Outpacing CPI
Veterinary prices have risen faster than general inflation, putting pressure on household budgets and intensifying the need to manage the volatility of medical bills for pets. Practices face wage inflation and higher costs for advanced diagnostics, which raises fee schedules at large chains and independent clinics alike. The result is a measurable decline in routine wellness visits among some segments as owners defer care, coupled with a rise in emergency episodes that carry higher costs and create stress for uninsured households. Insurers absorb these pressures through pricing and product design, while households with constrained liquidity report rising anxiety around unexpected invoices and increasing difficulty meeting pet-related expenses. Select carriers have adjusted portfolios to address high-cost segments and rebalance risk exposure, which aligns underwriting with observed cost trends as veterinary services expand their share of total pet spending.
NAIC Model Act Rollout and Regulatory Advancements
The Pet Insurance Model Act provides standardized definitions and consumer disclosures in the United States, including clarity on pre-existing conditions, waiting periods, and wellness programs. By 2025, multiple states enacted similar statutes, reducing variability across jurisdictions and encouraging carriers to streamline policy terms to a model that is easier for consumers to understand and compare. Key consumer safeguards include a defined free-look period, rules for waiting periods, and obligations on insurers to demonstrate proof when applying exclusions, which collectively support trust and policy retention[3]NAIC, “Pet Insurance Model Act,” National Association of Insurance Commissioners, content.naic.org. Early adopters who align product and disclosure with the model have seen durable retention benefits as transparency lowers the frequency of coverage disputes. Standardized regulatory frameworks also aid data interoperability and benchmarking, which strengthens actuarial tools and speeds iteration for new product features.
Embedded Insurance in Pet-Care Ecosystems
Embedded distribution integrates enrollment within retail, e-commerce, and veterinary workflows, which lifts conversion by presenting coverage when health decisions are top of mind. Retailers and clinic networks that control frequent touchpoints can bundle coverage into service subscriptions and checkout experiences, making enrollment a simple and timely step rather than a separate task. The model aligns incentives to keep pets healthier and to reduce friction in claims through direct connections with care providers and pharmacy services. Carriers prioritize these integrations because they reduce customer acquisition costs and extend channel reach beyond traditional intermediated sales. Embedded strategies also complement mobile-first claims and telehealth offerings, creating a unified experience from enrollment to reimbursement.
Restraints Impact Analysis of Pet Insurance Market*
| Restraint | (~) % Impact on CAGR Forecast | Geographic Relevance | Impact Timeline |
|---|---|---|---|
| High premium inflation versus disposable income | -2.1% | Emerging markets, lower-income segments in developed markets | Short term (≤ 2 years) |
| Lack of unified global veterinary procedure coding | -0.7% | Global, acute in markets lacking EHR adoption | Long term (≥ 4 years) |
| Insurer policy adjustments for adverse breed loss ratios | -1.3% | Developed markets with mature underwriting data | Medium term (2-4 years) |
| Low awareness and cultural barriers in emerging markets | -1.5% | Asia-Pacific ex-Japan, Latin America, the Middle East, and Africa | Long term (≥ 4 years) |
| Source: Mordor Intelligence | |||
High Premium Inflation Versus Disposable Income
Premium adjustments respond to rising veterinary costs, and some consumers face affordability constraints that lead to policy lapses and delayed care decisions. Select carriers disclosed price increases to keep pace with claim severity, while monitoring retention and new business quality to avoid adverse selection that erodes risk pools. Demand elasticity emerges in lower-income segments as owners ration wellness visits, which in turn can increase emergency episodes and worsen health outcomes for uninsured pets. Households report higher financial stress tied to pet care, including balances carried for veterinary bills and constraints that limit the ability to pay premiums regularly. Carriers continue to refine product design and discounts to cushion the impact on price-sensitive segments while preserving coverage breadth in the pet insurance market.
Lack of Unified Global Veterinary Procedure Coding
Claims automation and pricing sophistication depend on structured clinical data, yet veterinary medicine often relies on free-text notes and heterogeneous descriptors that resist aggregation. The absence of widely adopted coding norms complicates benchmarking outcomes, estimating costs by condition, and calibrating deductibles to reflect breed and age risk across geographies. Integrations with practice software and labs remain fragmented, adding cost and delay to insurer data pipelines that support adjudication and risk analytics. Without consistent codes and interoperability, carriers fall back on manual review and conservative pricing assumptions that can blunt competitiveness. Markets that advance EHR adoption and common taxonomies will enable better automation, fairer ratings, and faster claims in the pet insurance market.
*Our forecasts treat driver/restraint impacts as directional, not additive. The impact forecasts reflect baseline growth, mix effects, and variable interactions.
Pet Insurance Market Segment Analysis
By Policy Type:
Comprehensive Plans Drive Adoption, Wellness Add-Ons Build StickinessAccident & Illness led with 82.36% of the pet insurance market share in 2025, while Wellness and Preventive-Care add-ons are forecast to expand at a 15.39% CAGR through 2031. Accident & Illness coverage accounted for the largest policy-type share in 2025, reflecting owner preference for broad protection against injuries and diseases, and Wellness and Preventive-Care add-ons are projected to grow the fastest through 2031 as routine care gets bundled with catastrophic coverage. This pattern supports higher retention as reimbursement for exams, and vaccines sustain frequent touchpoints and normalize filing claims during the policy year. Clear separation between insurance and wellness plans under the United States model reforms improves disclosure and avoids confusion when customers compare products with similar names but different coverage scopes. The pet insurance market benefits when wellness riders lift perceived value for monthly premiums, especially for younger pets that file routine claims even if major incidents are rare in early years. As embedded retail and clinic channels expand, packaging wellness at checkout or intake increases conversion in the pet insurance market by aligning financial protection with immediate care needs.
Accident-only policies remain a niche for price-sensitive owners and older pets that no longer qualify for comprehensive underwriting, yet the momentum resides with combined Accident & Illness plus wellness bundles that meet both preventive and unexpected needs. Direct links with veterinary information systems shorten reimbursement cycles and improve customer satisfaction, which in turn raises renewal rates for plans that deliver visible value at each visit. Carriers also refine deductibles and annual limits to better match expected spend by age and breed, making core packages more competitive at the point of comparison. Embedded partnerships with major retailers and clinics provide marketing scale and trusted environments for upsell to wellness-enhanced options, where engagement is higher, and cancellations are lower. With these trends, the pet insurance industry continues to shift from standalone catastrophic policies toward integrated health and wellness propositions that strengthen lifetime value for both customers and carriers.


By Animal Type:
Dogs Anchor Revenue, Exotics Unlock Targeted NichesDogs captured 74.82% of the pet insurance market share in 2025, and other pets recorded the fastest momentum with a 13.95% CAGR projected to 2031. Dogs represent the majority of insured pets and policy revenue in 2025 and remain the primary focus for product design given their higher clinical complexity and per-policy premiums relative to cats. Feline penetration is rising as cat ownership grows among younger urban households, though per-policy economics differ due to lower visit frequency and claim severity. Exotics and other pets are projected to expand from a smaller base as select carriers extend underwriting to avian and small-mammal species, which requires specialized clinical knowledge and tailored coverage language. The pet insurance market experiences steady growth in canine policies as breed-specific risks shape pricing ladders and as owners prioritize comprehensive protection for orthopedic and hereditary conditions. Over time, better data on feline chronic conditions and indoor-lifestyle risk will support more precise segmentation and messaging that raise take-up among cat owners.
Dog-heavy books of business tend to scale faster, and investments in claims automation and direct payment at clinics can remove friction and boost satisfaction metrics for canine and feline owners alike. Product education remains important for exotics since coverage features need to reflect species-specific conditions, and underwriting must account for different morbidity profiles. The pet insurance market responds to these dynamics by adjusting distribution, content, and plan builders to match the expectations and budgets of each owner segment. Partnerships with specialty clinics and associations in exotics can improve product credibility and accelerate adoption among enthusiasts who know their species’ care requirements well. As data on cross-species outcomes improves, carriers can refine benefits and price points that align risk and value across dogs, cats, and other pets in the pet insurance market.
By Provider Type:
Traditional Carriers Lead, Digital Players Scale Through AutomationTraditional carriers held 69.96% of the pet insurance market share in 2025, while insurtech and digital providers are set to grow at a 16.45% CAGR through 2031. Traditional carriers hold the largest provider-type share in 2025 due to brand recognition, multi-line cross-sell capacity, and established compliance operations across jurisdictions. Insurtech and digital providers grow faster as AI models compress loss-adjustment expenses and enable rapid policy binding without manual underwriting for standard risks. Full-stack providers that integrate direct payment to clinics deliver value through immediate adjudication, which strengthens retention by removing the reimbursement burden on owners. As automated adjudication expands, leaders apply hybrid human-in-the-loop models to handle complex claims and suspected fraud while granting instant decisions on routine submissions. These operating advantages, coupled with embedded distribution partnerships, enable digital players to capture younger demographics in the pet insurance market.
Traditional providers continue to modernize core systems and pursue partnerships to match the speed and user experience of newer entrants, including integrations at retail checkout and veterinary front desks. They also leverage underwriting capacity and risk management to offer broader benefit options and limits for high-cost procedures, which helps retain long-tenured customers. The pet insurance industry is converging on best-of-both approaches as incumbents buy or partner with insurtechs and as digital challengers add depth in compliance and reinsurance relationships. In this environment, scale advantages come from data, automation, distribution reach, and the ability to connect to practice systems for fast payment in the pet insurance market. As growth continues, both cohorts refine product governance to align with evolving United States model law standards and consumer expectations.
By Sales Channel:
Embedded Distribution Outpaces Intermediated ModelsThe intermediated model accounted for 48.66% of the pet insurance market share in 2025, and embedded models are expected to expand at an 18.66% CAGR through 2031. Intermediated channels still account for the largest share in 2025, although their growth decelerates as digital and embedded distribution absorb more of the incremental expansion. Embedded partnerships at retail, e-commerce, and veterinary clinics lift conversion by presenting offers during adoption, purchase, and appointment flows when willingness to enroll is high. Direct-to-consumer websites and aggregators continue to funnel informed shoppers, yet the most powerful conversion effects now come from checkout and point-of-care experiences. Employers add a complementary channel by enabling payroll deduction and streamlined enrollment, which integrates with benefits platforms as a voluntary option for employees. As these channels mature, the pet insurance market sees declining acquisition costs and higher retention, where distribution controls frequent engagement with the pet-care journey.
Intermediaries continue to serve complex cases and cross-sell within multiline personal lines, while embedded partners negotiate revenue shares that align incentives around long-term renewals rather than one-time commissions. Integrations into vet-practice software and retail POS reduce friction for quoting and enrollment, which raises attach rates for wellness-enhanced plans. The pet insurance market benefits from channel diversity that meets owners where they research, shop, and receive care, thereby increasing accessibility and convenience. Over time, embedded and employer channels are expected to drive a larger share of incremental premiums as product placement becomes a standard feature of the pet-care ecosystem. This shift supports the long-run expansion in the pet insurance market by aligning distribution with high-intent interactions.
Geography Analysis
Europe Pet Insurance Market
Europe holds the largest regional position with 45.23% share in 2025, driven by a long-standing insurance-buying culture, high veterinary cost baselines, and consistent consumer familiarity with claims processes and benefits. The United Kingdom sustains elevated penetration as veterinary bills and standardized policy terms keep coverage relevant to households, while Sweden’s historically high participation reflects a cultural norm around responsible ownership that includes financial protection. Product clarity has improved in major European markets alongside consumer protection initiatives, which helps owners compare reimbursement levels and exclusions when choosing plans. Embedded partnerships across retail and clinic networks strengthen attachment rates at checkout and in appointment flows and support ongoing migration from intermediated models. With higher awareness and stable regulatory frameworks, Europe remains the anchor of the pet insurance market while new channels expand reach into underpenetrated segments.
North America Pet Insurance Market
North America ranks second by revenue and continues to grow as awareness rises and product experiences become faster and simpler through digital claims and direct payment with select providers. Written premiums expanded in 2025 on the back of higher enrollments and premium normalization to veterinary costs, though penetration varies sharply by state and urban density. The model law adoption across multiple states improves clarity on pre-existing conditions, waiting periods, and wellness programs, which reduces friction at renewal and supports retention. Employer channels add momentum by making payroll deduction available for voluntary coverage, while retail and clinic partners integrate quotes directly into point-of-sale and appointment workflows. The pet insurance market in North America benefits from operational advances like instant adjudication and hybrid AI-human claims models, which compress payout cycles and improve customer satisfaction.
APAC Pet Insurance Market
Asia-Pacific is the fastest-growing region with a projected 14.89% CAGR through 2031, supported by urbanization, rising disposable incomes, and digital-first distribution that lowers barriers to enrollment. Japan’s direct-settlement infrastructure and wellness innovation create a blueprint for convenience and preventive outcomes that other markets seek to emulate as penetration increases. Australia, China’s tier-one cities, and select Southeast Asian markets are building on mobile-native behaviors and embedded digital ecosystems to introduce coverage at scale. As EHR adoption and standardized claims data improve, underwriting precision will increase and support more tailored offerings by breed and age across the region. Together, these shifts reinforce Asia-Pacific’s role as the global growth engine for the pet insurance market while Europe anchors total revenue and North America gains on improving awareness and product experience.

Competitive Landscape
The global pet insurance market is fragmented, yet regional leaders have established durable advantages through distribution networks, automation, and integrated care that reduce friction for policyholders. Competition increasingly focuses on embedded partnerships, presenting coverage options during checkout or veterinary visits to capture consumers at key decision points. AI-enabled claims processing allows routine submissions to settle quickly, while wellness programs help maintain engagement and retention throughout a pet’s life. Direct-settlement infrastructures in mature markets highlight how operational convenience can become a competitive moat when owners no longer wait for reimbursement. Carriers with large, structured data networks benefit from faster iterations in underwriting and product development, while improved transparency under evolving standards builds trust and supports customer loyalty.
Leading companies demonstrate diverse strategies to scale and enhance efficiency across the market. Real-time payment systems that adjudicate invoices at checkout enhance clinic satisfaction and encourage high renewal rates. AI-driven claims platforms reduce administrative costs by routing complex cases to human adjusters and paying routine claims instantly. Supplemental products integrated into employer or retail channels provide additional pathways to reach pet owners, leveraging existing networks to improve conversion. By combining channel access, automation, and service integration, these strategies help the market grow while improving the overall policyholder experience.
Innovation in prevention and cost management continues to shape the market landscape. Programs that shift beyond reimbursement toward health services orchestration pair direct settlement with preventive analytics to anticipate risks and guide owners. Group purchasing initiatives for veterinary supplies and pharmaceuticals aim to slow cost escalation, supporting more stable premiums over time. Digital claims and telehealth solutions complement in-person care, improving efficiency and assisting with pre-visit triage. Across regions, market leaders align products, technology, and partnerships to create simpler, faster, and clearer experiences, ultimately driving higher adoption and retention.
Pet Insurance Industry Leaders
Trupanion Inc.
Nationwide (VPI)
Healthy Paws Pet Insurance LLC
Lemonade Inc.
Agria Djurförsäkring AB
- *Disclaimer: Major Players sorted in no particular order
Pet Insurance Market Companies Covered in this Report
- Trupanion Inc.
- Nationwide (VPI)
- Anicom Holdings Inc.
- Embrace Pet Insurance Agency LLC
- Figo Pet Insurance LLC
- Hartville Group (ASPCA)
- Healthy Paws Pet Insurance LLC
- Lemonade Inc.
- ManyPets Ltd.
- Agria Djurförsäkring AB
- RSA Group (MORE THAN)
- Petplan (Fetch)
- Pets Best Insurance Services LLC
- MetLife Pet Insurance (PetFirst)
- Dotsure.co.za
- Oneplan (South Africa)
- PetSure (Australia)
- iPet Insurance (Japan)
- Chewy / Trupanion Pet-Partner Plans
- Pumpkin Pet Insurance (Zoetis)

Recent Industry Developments in Pet Insurance Market
- January 2026: Costco announced it will offer pet insurance to members through a partnership with Figo starting in 2026, with no age or breed restrictions for enrollment, making coverage more accessible to older pets and offering customizable plans with member discounts.
- December 2025: Adoro Pet Insurance Services LLC launched its pet insurance offering across 28 states of the United States, entering the expanding pet insurance market with accident and illness coverage designed to include key services and faster claims processing.
- June 2025: Combined Insurance, a Chubb company, added Healthy Paws pet insurance to its supplemental benefits portfolio for employers and individuals, expanding workplace access with digital claims and unlimited benefit options.
- May 2025: Tokio Marine Well Design launched a group purchasing service for veterinary pharmaceuticals and related items to help clinics reduce procurement costs and administrative burden through a centralized system.


Pet Insurance Market Report Scope and Research Methodology
Market Definition and Coverage
We define the pet insurance market as all written premium generated by private or mutual carriers for policies that reimburse veterinary expenses related to accidents, illnesses, and wellness add-ons for companion animals, chiefly dogs and cats, across 17 major countries evaluated by our analysts. Policies bundled with employee benefits are included because premiums are still underwritten and priced per pet.
Scope exclusion: Livestock coverages and micro-benefit riders embedded in homeowners, credit-card, or travel insurance products are not counted.
Segments Covered in This Report
- By Policy Type
- Accident & Illness
- Accident-Only
- Wellness / Preventive-Care Add-ons
- Others
- By Animal Type
- Dog
- Cat
- Other Pets (Birds, Exotics, Equine, etc.)
- By Provider Type
- Traditional (Private / Mutual / Cooperative Insurers)
- Insurtech / Digital Providers
- Niche (Government-linked / Public Schemes / Other)
- By Sales Channel
- Direct-to-Consumer
- Intermediated
- Embedded
- By Geography
- North America
- United States
- Canada
- Mexico
- South America
- Brazil
- Argentina
- Peru
- Chile
- Rest of South America
- Europe
- Germany
- United Kingdom
- France
- Italy
- Spain
- Nordics (Sweden, Norway, Denmark, Finland)
- Benelux (Belgium, Netherlands, and Luxembourg)
- Rest of Europe
- Asia-Pacific
- China
- Japan
- India
- Australia
- South Korea
- Rest of Asia-Pacific
- Middle East & Africa
- Saudi Arabia
- United Arab Emirates
- South Africa
- Rest of Middle East and Africa
- North America
Data Sources, Market Sizing, and Validation
Primary Research
We held structured interviews and short surveys with underwriting heads, insurtech founders, practicing veterinarians, and broker networks across North America, Europe, and Asia-Pacific. These discussions clarified average premium swings, claims approval lag, and customer churn, allowing us to adjust secondary assumptions before final sizing.
Desk Research
Our team began with publicly available tier-1 statistics, such as NAPHIA insured-pet counts, the American Veterinary Medical Association price index, Eurostat household pet-care outlay, and OECD currency data, which anchor prevalence, spending, and pricing inputs. We supplemented these with government trade records on pet medicines, standard actuarial loss-ratio filings, and insights from trade bodies like the European Pet Food Federation that track canine and feline populations. To refine competitive intensity and premium trajectories, we screened carrier 10-Ks and investor decks with D&B Hoovers, browsed regulatory dockets that cite the NAIC Pet Insurance Model Act, and mined press releases contained in Dow Jones Factiva. Additional industry blogs, patent abstracts via Questel, and veterinary journal articles helped flag emerging cost drivers. The list above is illustrative, not exhaustive.
Market-Sizing & Forecasting
Our model starts with a top-down rebuild of the premium pool: companion-animal stock × insurance penetration × average annual premium. Results are cross-checked through selective bottom-up carrier roll-ups and sampled average-selling-price times policy volume, so unusual skews can be reconciled early. Key variables include veterinary cost inflation, new-pet adoption rates, disposable income growth, regulatory uptake of the NAIC framework, and digital channel share expansion.
For projections, we feed the historical series into a multivariate regression with an ARIMA overlay, letting premium elasticity to vet-cost inflation and GDP per capita drive scenario bands. Where carrier disclosures are patchy, we interpolate using peer averages and re-validate against interview ranges.
Data Validation & Update Cycle
We run multi-step variance checks, peer-to-peer review, and anomaly flags; outputs that stray beyond accepted tolerance send us back to respondents. Models refresh every 12 months, and an analyst reruns critical drivers before each client delivery.
How Mordor Intelligence's Pet Insurance Market Size Compares to Other Published Estimates
Published estimates often diverge because each firm picks different geographies, coverage tiers, and forecast cadences, leaving executives unsure which number to trust. Our study shows those gaps clearly and explains them in plain language.
Key gap drivers include Mordor's inclusion of wellness riders, our consistent 2024 currency base, and the fact that we report the first full forecast year (2025) rather than the latest historic year, while other publishers may exclude multi-pet discounts or stop at accident-only cover.
Benchmark comparison
| Market Size | Anonymized source | Primary gap driver |
|---|---|---|
| USD 15.81 B (2025) | Mordor Intelligence | - |
| USD 18.61 B (2024) | Global Consultancy A | Excludes wellness add-ons, uses 2023 exchange rates |
| USD 14.35 B (2025) | Global Consultancy B | Omits embedded employer policies, assumes lower vet-cost index |
| USD 10.10 B (2023) | Industry Association A | Reports historic premiums only, no forward adjustment for inflation |
Taken together, the comparison shows that Mordor's disciplined scope choices, current-year baseline, and transparent variable set provide a balanced, reproducible benchmark that decision-makers can rely on with confidence.


Key Questions Answered in the Report
What is the current size and growth outlook for the pet insurance market?
The pet insurance market size is USD 17.59 billion in 2026 and is projected to reach USD 29.94 billion by 2031 at an 11.23% CAGR, supported by rising pet ownership, embedded distribution, and AI-enabled claims.
Which regions lead and which are growing fastest?
Europe holds the largest share with 45.23% in 2025, while Asia-Pacific is the fastest-growing region with a projected 14.89% CAGR through 2031 due to urbanization and digital-first distribution.
Which policy types are most popular among pet owners?
Accident & Illness plans account for the largest share, and Wellness and Preventive-Care add-ons are growing the fastest as owners bundle routine care with catastrophic coverage to improve value and retention.
What are the main forces driving adoption in 2026?
Adoption is driven by pet humanization, veterinary cost inflation outpacing CPI, standardized United States policy terms under the NAIC Model Act, embedded retail and vet distribution, and AI-enabled underwriting and claims.
How is distribution shifting across channels?
Intermediated channels still hold the largest share, but embedded distribution at retail and veterinary settings and employer-sponsored voluntary benefits are growing faster as enrollment moves into checkout and appointment flows.
What role does automation play in claims and pricing?
AI models automate extraction and adjudication for routine claims, reduce loss-adjustment expenses, and improve speed to payment, while hybrid human-in-the-loop approaches focus on complex cases and fraud.
Page last updated on:


