
OTT Content Licensing Market Size and Share
Market Overview
| Study Period | 2020 - 2031 |
|---|---|
| Market Size (2026) | USD 59.16 Billion |
| Market Size (2031) | USD 111.65 Billion |
| Growth Rate (2026 - 2031) | 13.54 % |
| Fastest Growing Market | Asia-Pacific |
| Largest Market | North America |
| Market Concentration | Medium |
Major Players *Disclaimer: Major Players sorted in no particular order Image © Mordor Intelligence. Reuse requires attribution under CC BY 4.0. | |
OTT Content Licensing Market Analysis by Mordor Intelligence
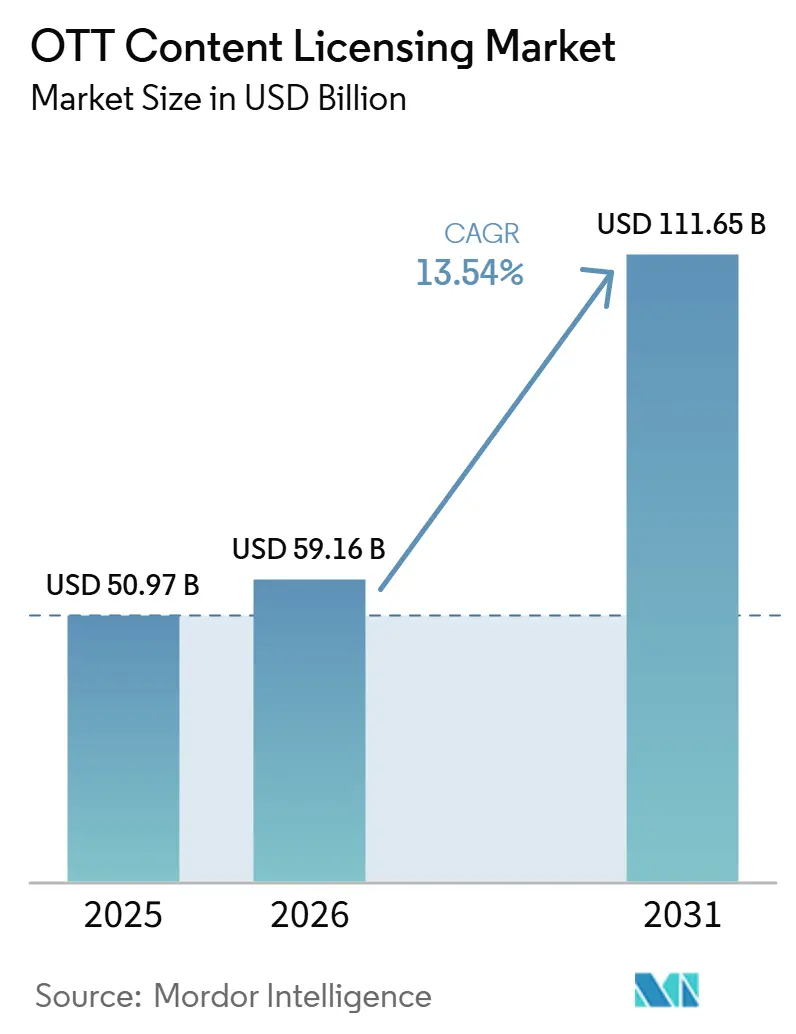
The OTT content licensing market size is projected to expand from USD 50.97 billion in 2025 and USD 59.16 billion in 2026 to USD 111.65 billion by 2031, registering a CAGR of 13.54% between 2026 and 2031. The OTT content licensing market is being shaped by a clear move away from exclusivity-led distribution toward release strategies that spread value across theatrical, premium video on demand, subscription video on demand, ad-supported video on demand, and free ad-supported streaming television windows. The OTT content licensing market is also being driven by stronger demand for local-language catalogs, as platforms now treat regional content depth as a direct driver of retention and advertising performance rather than a market-entry requirement. Large platform-studio combinations are changing bargaining power in the OTT content licensing market, as ownership of premium intellectual property reduces renewal risk and gives larger players greater control over pricing and access. The OTT content licensing market also continues to attract new licensing demand from telecom and pay-TV operators that use content bundles to support broadband and 5G offers. At the same time, rising renewal costs for premium franchises, live rights inflation, piracy, and fragmented territorial rights continue to pressure margins and deal execution in the OTT content licensing market.
Key Report Takeaways
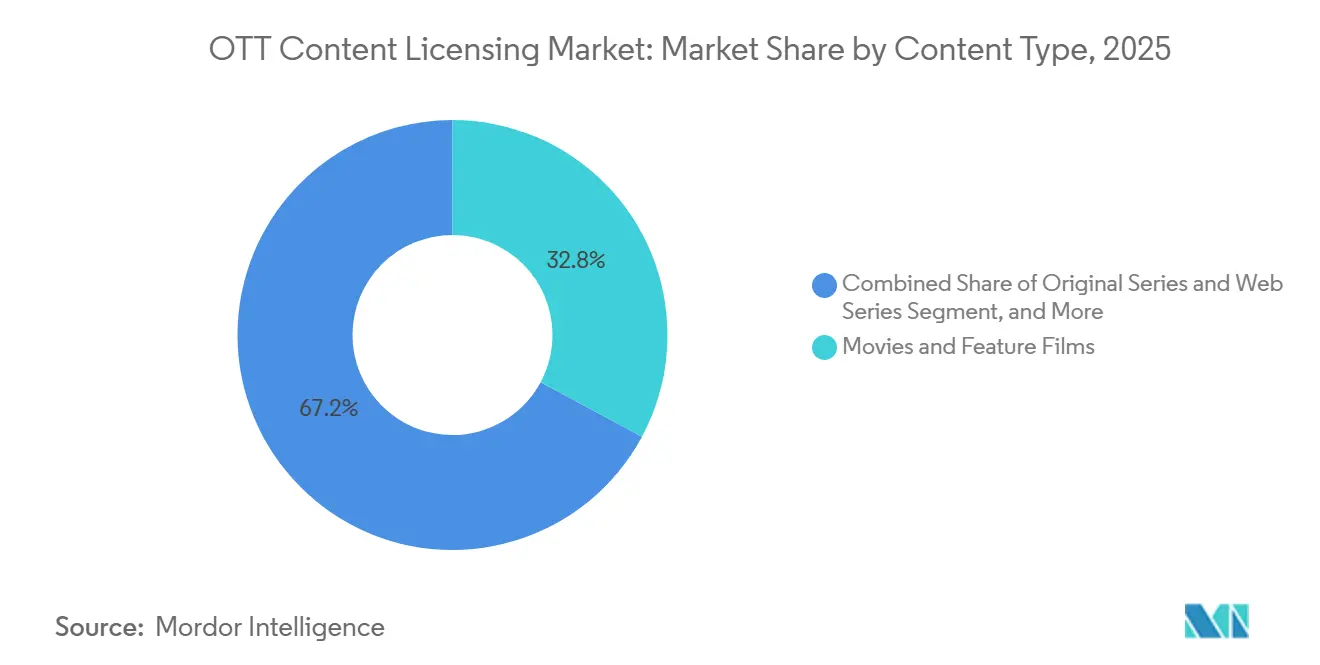
- By content type, movies and feature films held the largest share at 32.84% in 2025, while animation and kids' content are projected to expand at a 14.12% CAGR through 2031.
- By licensing model, content acquisition agreements accounted for the largest share at 48.63% in 2025, while revenue-sharing agreements are projected to record the fastest CAGR at 14.73% through 2031 in the OTT content licensing market.
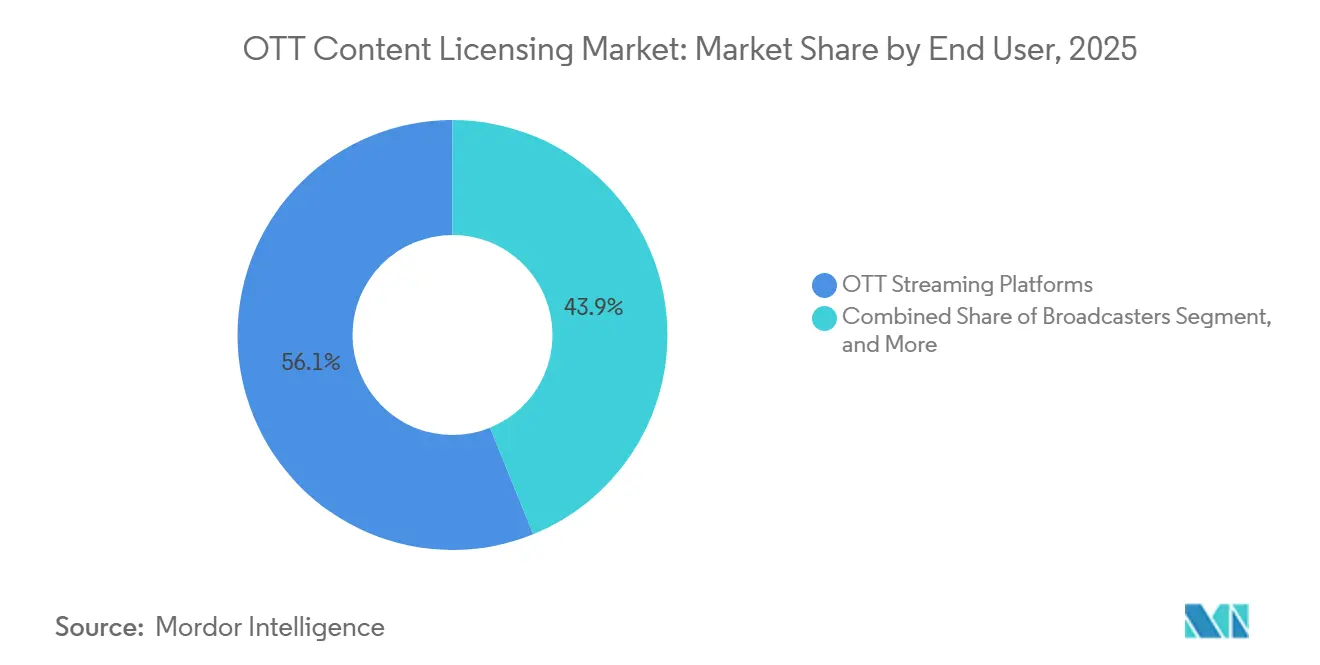
- By end user, OTT streaming platforms held the largest share at 56.13% in 2025, while telecom and pay-TV operators are expected to expand at a 14.38% CAGR through 2031.
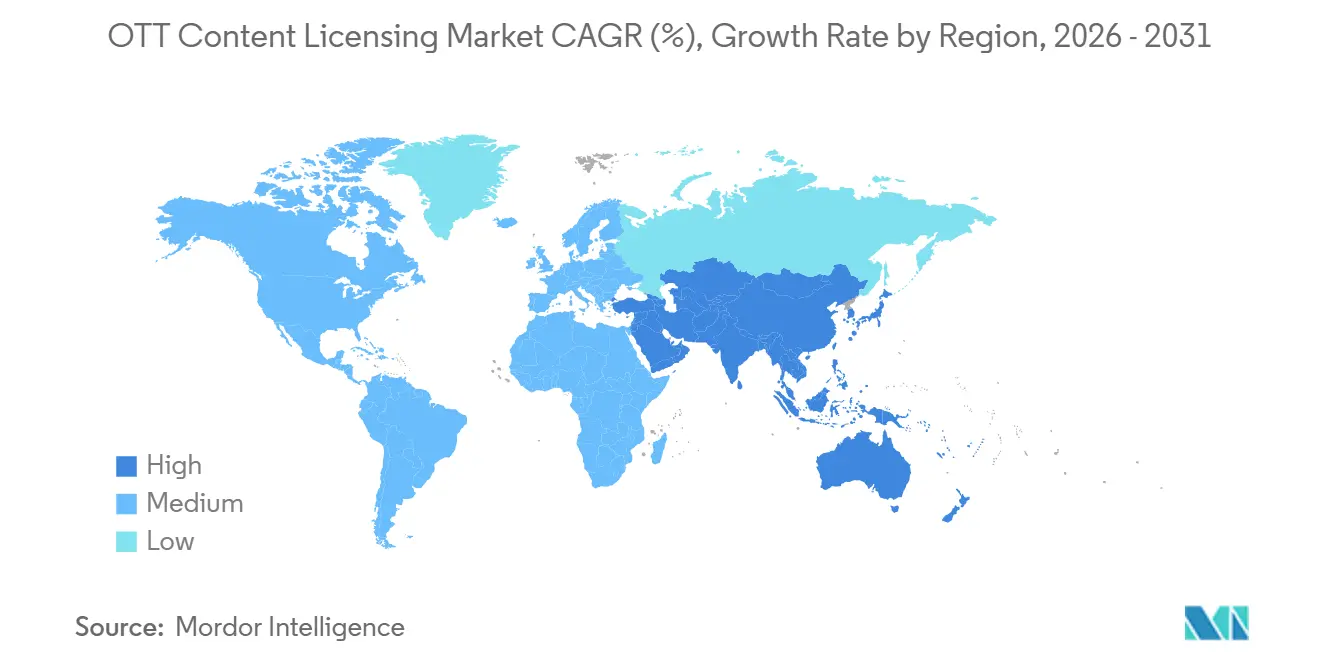
- By geography, North America led with 38.59% share in 2025, while Asia-Pacific is projected to register the fastest CAGR at 14.67% through 2031 in the over-the-top (OTT) content licensing market.
Note: Market size and forecast figures in this report are generated using Mordor Intelligence’s proprietary estimation framework, updated with the latest available data and insights as of January 2026.
Market Trends and Insights
Drivers Impact Analysis of OTT Content Licensing Market*
| Driver | (~) % Impact on CAGR Forecast | Geographic Relevance | Impact Timeline |
|---|---|---|---|
| Growth of Premium and Exclusive OTT Originals | +3.5% | Global, led by North America and Asia-Pacific | Short term (≤ 2 years) |
| Rising Global Cross-Border Content Monetization | +2.8% | Asia-Pacific core, spill-over to Europe and North America | Medium term (2-4 years) |
| Rising Demand for Local Language Catalog Depth | +2.2% | Asia-Pacific core, spill-over to Middle East and Africa | Medium term (2-4 years) |
| Bundling of Licensed Content Into Ad-Supported Plans | +1.8% | North America and Europe, growing adoption in Asia-Pacific | Short term (≤ 2 years) |
| Windowing Flexibility Across Hybrid Release Strategies | +1.5% | Global, primarily North America and Europe | Medium term (2-4 years) |
| AI-Assisted Rights Discovery and Faster Deal Execution | +1.2% | Global | Long term (≥ 4 years) |
| Source: Mordor Intelligence | |||
Growth of Premium and Exclusive OTT Originals
Premium originals now serve as anchor assets in the OTT content licensing market, shaping broader negotiations rather than serving solely as subscriber-acquisition tools. Netflix and Sony Pictures Entertainment finalized a global Pay-1 agreement in January 2026 at above USD 7 billion, reflecting materially higher pricing than the prior 2021 arrangement. Disney raised its total content budget by USD 1 billion to USD 24 billion in fiscal 2026, and the main pressure came from the new NBA rights package. This pattern gives major rights holders more room to ask for hybrid structures that combine fixed fees, output guarantees, and sequel options across the OTT content licensing market. European regulation also supports this shift, since global streaming platforms increased their share of European original content spending from 8% in 2020 to 24% in 2024.[1]European Audiovisual Observatory, “The Value of Europe's Audiovisual Market Is Estimated at 142 Billion Euro,” European Audiovisual Observatory, obs.coe.int As a result, premium original intellectual property is exercising greater pricing power and playing a broader strategic role across the OTT content licensing market.
Rising Global Cross-Border Content Monetization
Cross-border licensing has become a more important revenue path in the OTT content licensing market, especially for producers that can travel beyond their home language and home region. Platforms are now showing greater willingness to license local content internationally when they can build engagement before making original production commitments. This has increased the value of narrative formats that are easy to localize while still preserving cultural identity. It also extends monetization beyond licensing fees, since strong cross-border performance can support brand partnerships, consumer products, and sequel potential around the same title. The OTT content licensing market benefits from this pattern because successful regional content now moves through more territories and more windows than before. That change is making cross-border rights packaging more central to growth planning in the over-the-top (OTT) content licensing market.
Rising Demand for Local Language Catalog Depth
Local-language depth has become a structural requirement in the OTT content licensing market, as platforms now treat regional libraries as a core commercial asset. JioHotstar committed USD 445 million to a South Indian content slate in 2025, covering 1,500 hours of new programming across Tamil, Telugu, Malayalam, and Kannada. South Indian cinema accounted for 60% of theatrically successful film acquisitions by streaming platforms across Indian languages in 2025. ZEE5 also reported that non-Hindi-language viewing accounted for nearly half of its total consumption, indicating that regional catalogs support audience retention at scale. In the OTT content licensing market, local-language content often carries lower absolute fees than English-language titles, yet can still deliver stronger completion and repeat-viewing rates. This makes regional licensing especially useful for ad-supported plans that need consistent engagement across the OTT content licensing market.
Bundling of Licensed Content Into Ad-Supported Plans
Bundling licensed titles into ad-supported plans has become a direct revenue lever in the OTT content licensing market. Platforms need broad and steady title flow on lower-priced plans, since those tiers depend on both subscriber growth and long session depth. That has increased the value of licensed back catalogs, especially for studios that can supply large batches of recognizable film and television titles. In the OTT content licensing market, this also changes negotiation dynamics because ad-supported services rely on breadth as much as they rely on flagship originals. The result is that catalog licensors now hold stronger leverage when platforms want to fill lower-cost plans without raising internal production budgets too quickly. This supports near-term growth in the OTT content licensing market, even as original commissioning remains selective.
Restraints Impact Analysis of OTT Content Licensing Market*
| Restraint | (~) % Impact on CAGR Forecast | Geographic Relevance | Impact Timeline |
|---|---|---|---|
| Escalating Renewal Costs for Signature Franchises | -2.4% | North America and Europe | Short term (≤ 2 years) |
| Fragmented Rights Ownership Across Territories and Formats | -1.8% | Global, particularly Asia-Pacific and Europe | Medium term (2-4 years) |
| Growing Piracy Pressure on Premium and Live Content | -1.5% | Global, with high severity in Asia-Pacific and Europe | Short term (≤ 2 years) |
| Short License Tenures That Limit Catalog Predictability | -1.2% | Global | Medium term (2-4 years) |
| Source: Mordor Intelligence | |||
Escalating Renewal Costs for Signature Franchises
Rising renewal costs for premium franchises remain one of the clearest constraints on the OTT content licensing market. Disney's annual payment under the new NBA arrangement reached USD 2.6 billion, nearly triple the average annual level under the prior deal. When large rights packages absorb more budget, platforms have less room to renew broad catalog agreements across the OTT content licensing market. This pressure is especially hard on mid-sized and smaller services that cannot match the balance sheets of the largest studio-platform groups. In practical terms, the OTT content licensing market becomes less predictable when high-engagement titles move into repeated bidding cycles. That raises the risk of catalog gaps, weaker retention, and tighter renewal terms across the OTT content licensing market.
Fragmented Rights Ownership Across Territories and Formats
Fragmented rights ownership still slows execution in the OTT content licensing market, because the same title or event often carries different owners, holdbacks, and usage terms across countries and formats. A platform may need separate approvals for domestic rights, cross-border access, language versions, blackout periods, and window timing before the same content can be distributed widely. That increases legal and operational complexity in the OTT content licensing market, especially for services seeking a single, consistent catalog across many territories. It also creates friction for content owners, since global demand does not automatically translate into global availability when territorial splits remain in place. The problem is more visible in Europe and the Asia-Pacific, where different regulatory systems and pre-existing local licensing deals continue to shape access. As a result, the OTT content licensing market still carries execution risk even when the underlying demand for the title is strong.
*Our forecasts treat driver/restraint impacts as directional, not additive. The impact forecasts reflect baseline growth, mix effects, and variable interactions.
OTT Content Licensing Market Segment Analysis
By Content Type:
Feature Films Anchor Premium Deal VolumesMovies and feature films held 32.84% of the OTT content licensing market share in 2025, maintaining their leading position among content categories. The OTT content licensing market continues to place a premium on theatrical intellectual property because proven titles still command strong post-theatrical demand across major streaming services. Netflix and Sony's Pay-1 agreement, valued at above USD 7 billion, confirmed that premium theatrical output remains near the top of licensing hierarchies. Original series and web series made up the second-largest category, and many of those deals are now being structured around sequel rights and territory-specific sublicensing options. Documentary and non-fiction titles, along with reality and unscripted formats, are also gaining attention from ad-supported services because they help expand catalogs without driving the same acquisition cost profile as premium scripted titles.
Animation and kids content are projected to grow at a 14.12% CAGR from 2026 to 2031, making it the fastest-growing content type in the OTT content licensing market. Disney outbid Netflix for the CoComelon streaming license, which starts in 2027, underscoring how valuable preschool franchises remain even as overall commissioning remains selective. WildBrain reported that global licensing revenue rose 29% year over year to USD 69.4 million in Q4 2025, supported by brands such as Peanuts, Strawberry Shortcake, and Teletubbies. The economics are attractive because family-oriented franchises can reach audiences across streaming, merchandise, and location-based channels simultaneously. Even so, the OTT content licensing industry also faces a cost challenge, as animation is expensive to produce and renewal pricing can be difficult for budget-constrained buyers.



By Licensing Model:
Revenue Sharing Reshapes Deal StructuresContent acquisition agreements accounted for 48.63% of the market in 2025, making them the largest licensing model in the OTT content licensing market. Rights holders have long favored this model because it offers clear upfront revenue and simpler commercial planning. In the OTT content licensing market, that structure still suits large catalog sales and premium output deals where owners want payment certainty from the start. At the same time, the model places most of the viewership risk on the content owner, even when data sharing remains limited or absent. That pressure is prompting more counterparties to consider structures that more closely link payouts to actual platform performance.
Revenue-sharing agreements are projected to grow at a 14.73% CAGR from 2026 to 2031, which makes them the fastest-growing model in the OTT content licensing market. iQIYI introduced a unified Platform Revenue × Sharing Ratio framework in January 2026 across 8 major content categories, including film, series, animation, children's programming, and documentaries.[2]iQIYI Inc., “iQIYI Unveils 2026 Revenue-Sharing Rules for Partner Content,” Tiger Brokers, itiger.com That move shows that performance-linked licensing is becoming more formal and repeatable, rather than remaining a case-by-case arrangement. Co-licensing and partnership agreements are also gaining ground, because they help spread acquisition costs and reduce single-buyer exposure across markets. This part of the over-the-top (OTT) content licensing industry is likely to stay active as platforms seek more flexible ways to match content spending with realized monetization.
By End User:
Telecom Operators Accelerate Licensing PartnershipsOTT streaming platforms held a 56.13% share in 2025, making them the largest end-user group in the OTT content licensing market. Their advantage lies in direct control over viewing data, as they can show completion rates, title engagement, subscriber response, and churn outcomes during renewal talks. That improves their ability to justify higher bids for proven intellectual property across the OTT content licensing market. Broadcasters remained the second-largest end-user category and remain active buyers as they extend linear rights into catch-up and on-demand offerings. This keeps legacy players relevant in the OTT content licensing market even as viewer behavior continues to move toward digital distribution.
Telecom and pay-TV operators are projected to grow at a 14.38% CAGR through 2031, which makes them the fastest-growing end-user group in the OTT content licensing market. These operators use licensed content to support broadband, fiber, and 5G bundles without carrying the same production burden as direct content creators. Their existing billing relationships and device reach also make licensed entertainment a practical retention tool. Viu and iQIYI International announced a bundled offer across Indonesia, Thailand, the Philippines, and Malaysia in July 2026, a move that highlighted how cross-platform bundles can create new demand for coordinated rights coverage. Media and entertainment companies, along with other end users, remain part of the demand base where studios also act as secondary rights acquirers on selected co-productions.
Geography Analysis
North America OTT Content Licensing Market
North America held 38.59% of the OTT content licensing market share in 2025, maintaining its position as the largest regional market. The region continues to benefit from concentrated studio output, deep premium catalog ownership, and a large base of established streaming buyers. The over-the-top (OTT) content licensing market in North America is also shaped by consolidation, since ownership of film and television libraries affects both renewal risk and access terms for competing platforms. Netflix announced its agreement to acquire Warner Bros. Discovery in December 2025, and the transaction became a central point of discussion because it would combine major streaming distribution with substantial premium intellectual property. Canada also adds a compliance layer for international licensors, since domestic content expectations influence how multi-territory agreements are structured.
Europe OTT Content Licensing Market
Europe remained a highly active region in the OTT content licensing market, supported by both commercial demand and policy-driven investment pressure. The European audiovisual market generated EUR 142 billion (USD 153.6 billion) in 2024, and global streaming platforms increased their share of European original content spending from 8% in 2020 to 24% in 2024.[3]European Audiovisual Observatory, “US Works Dominate European VoD Availability Despite High Number of Individual European Titles,” European Audiovisual Observatory, obs.coe.int US titles accounted for 48% of video-on-demand catalog listings in Europe, despite representing only 33% of individual titles, underscoring the wider licensing footprint of major American studios. Y TF1+ launched on Netflix in France in June 2026, and that partnership showed how broadcaster-streamer hybrids are changing distribution economics in the OTT content licensing market.
APAC OTT Content Licensing Market
Asia-Pacific is projected to grow at a 14.67% CAGR from 2026 to 2031, making it the fastest-growing region in the OTT content licensing market. Premium video on demand in the region is forecast to add USD 12.5 billion in incremental revenue between 2025 and 2030, while premium AVOD is expected to grow from USD 8 billion in 2025 to more than USD 12 billion by 2030. India is expected to overtake China as the largest subscription video-on-demand market in the region by 2030, with 358 million individual subscriptions, supporting stronger demand for local licensing and deeper regional catalogs. JioHotstar crossed USD 1 billion in revenue in 2025 and is forecast to surpass YouTube in total revenue by the end of 2026, strengthening India's position in the OTT content licensing market. Netflix also indicated in July 2026 that it planned to become more aggressive in local licensing in Asia-Pacific, underscoring the region's growing role in future deal activity.

Competitive Landscape
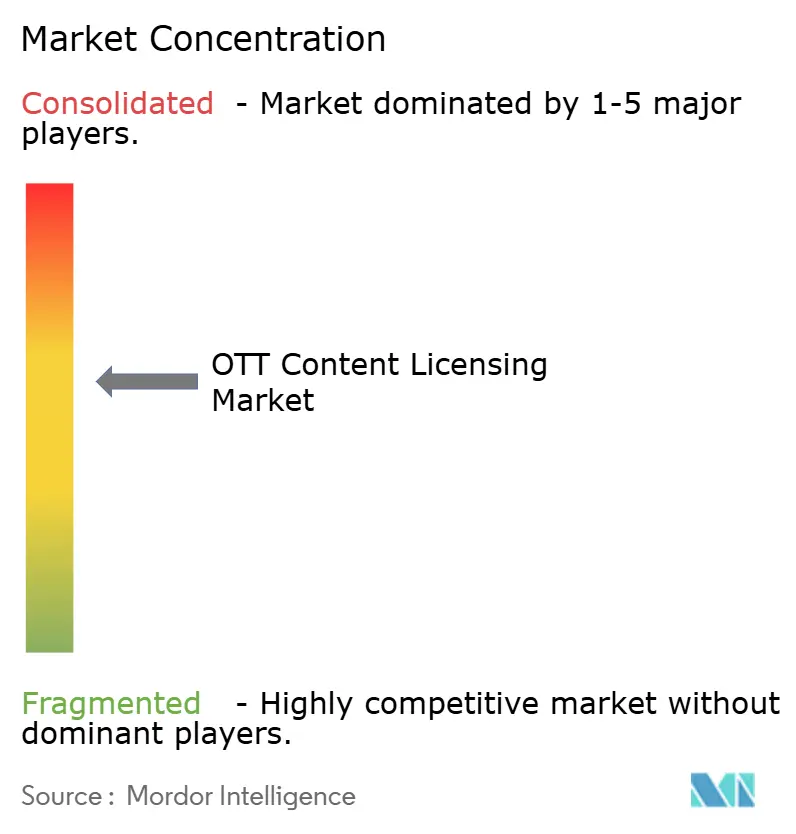
The OTT content licensing market remains moderately concentrated, with a small group of large studio-platform companies controlling much of the highest-value film, television, and franchise intellectual property. That concentration is strongest at the premium end of the OTT content licensing market, while a broad independent supplier base still provides a large share of catalog depth. Netflix's announced USD 82.7 billion acquisition of Warner Bros. Discovery was the largest strategic move in the draft and showed how ownership of premium libraries can reshape both buying power and selling power in the OTT content licensing market. If completed, the deal would reduce Netflix's renewal risk and increase pressure on smaller platforms that rely on third-party studio content. The OTT content licensing market, therefore, continues to reward scale, control over intellectual property, and the ability to manage long-term rights portfolios.
Strategic moves are also expanding beyond large mergers in the OTT content licensing market. Netflix and Sony deepened their relationship through the above-USD 7 billion Pay-1 agreement, which gave Netflix access to Sony's theatrical output on a multiyear basis. TF1 and Netflix created a new type of broadcaster-streamer arrangement in France by bringing the full TF1+ service onto Netflix with advertising. Viu and iQIYI International also used bundling in Southeast Asia to widen audience access and create a larger combined rights footprint across 4 countries.
Execution tools are becoming increasingly important because the OTT content licensing market is not driven solely by scale. Vubiquity launched Catalog Intelligence in July 2025 and enhanced it again in September 2025 to automate rights data extraction, readiness checks, and availability validation.[4]Vubiquity, “Vubiquity Releases Catalog Intelligence to Boost Content Profitability,” Vubiquity, vubiquity.com These tools help smaller rights owners reduce manual work and move titles through the licensing chain faster. Piracy remains a major constraint in the OTT content licensing market, as LALIGA reported 26.2 million takedown notices in the first half of 2025 and reported 89% did not result in illegal streaming suspensions. This is pushing platforms and rights holders to place greater weight on content protection standards when negotiating access to premium and live programming in the OTT content licensing market.
OTT Content Licensing Industry Leaders
Netflix, Inc.
The Walt Disney Company
Amazon.com, Inc.
Warner Bros. Discovery, Inc.
Comcast Corporation
- *Disclaimer: Major Players sorted in no particular order
OTT Content Licensing Market Companies Covered in this Report
- Amazon.com, Inc.
- Apple Inc.
- BBC Studios Distribution Limited
- Comcast Corporation
- Paramount Global
- The Walt Disney Company
- Warner Bros. Discovery, Inc.
- Netflix, Inc.
- Sony Pictures Entertainment Inc.
- Lions Gate Entertainment Corp.
- Canal+ Group
- A+E Global Media
- ITV plc
- ZDF Studios GmbH
- iQIYI, Inc.
- Tencent Holdings Limited
- Banijay Entertainment
- Fremantle Limited
- TelevisaUnivision, Inc.
- CJ ENM Co., Ltd.

Recent Industry Developments in OTT Content Licensing Market
- July 2026: Netflix signed licensing deals with BuzzFeed Studios, Condé Nast, Hearst Magazines, Penske Media, and People Inc. for short-form video content ranging from 3 to 20 minutes, expanding its content licensing strategy beyond traditional long-form programming and signaling a structural convergence between streaming and digital media licensing models.
- July 2026: Netflix and Spotify jointly acquired the On Purpose video podcast by Jay Shetty in a multiyear deal valued at USD 100 million, establishing an unusual dual-platform exclusive licensing arrangement that sets a new precedent for audio-visual content licensing across competing streaming services simultaneously.
- July 2026: Viu and iQIYI International announced a combined streaming subscription bundle for simultaneous launch across Indonesia, Thailand, the Philippines, and Malaysia in H2 2026, requiring a coordinated cross-border content licensing structure that spans both platforms' full catalogs across 4 separate national licensing jurisdictions.
- June 2026: TF1's streaming service TF1+ launched on Netflix in France under a first-of-its-kind distribution partnership, placing all TF1+ content on Netflix's platform with advertising, marking the first such arrangement between a major US streaming service and a leading European commercial broadcaster.


Global OTT Content Licensing Market Report Scope
The OTT Content Licensing Market refers to the global ecosystem of commercial agreements through which the rights to distribute, stream, and monetize audiovisual content are licensed to over-the-top (OTT) platforms and other media distributors over the internet. This market includes transactions involving the acquisition, sharing, or partnership-based licensing of content such as movies, original series, documentaries, reality programs, animation, and other entertainment formats. Licensing agreements typically define the scope of content rights, including geographic territories, distribution windows, exclusivity, language rights, duration, and monetization models.
The OTT Content Licensing Market Report is Segmented by Content Type (Movies and Feature Films, Original Series and Web Series, Documentary and Non-Fiction, Reality Shows and Unscripted Content, Animation and Kids Content, and Other Content Types), Licensing Model (Content Acquisition Agreements, Co-Licensing and Partnership Agreements, Revenue-Sharing Agreements, and Other Licensing Models), End User (OTT Streaming Platforms, Broadcasters, Telecom and Pay-TV Operators, Media and Entertainment Companies, and Other End Users), and Geography (North America, South America, Europe, Asia-Pacific, Middle East, and Africa). The Market Forecasts are Provided in Terms of Value (USD).
| Movies and Feature Films |
| Original Series and Web Series |
| Documentary and Non-Fiction |
| Reality Shows and Unscripted Content |
| Animation and Kids Content |
| Other Content Types |
| Content Acquisition Agreements |
| Co-Licensing and Partnership Agreements |
| Revenue-Sharing Agreements |
| Other Licensing Models |
| OTT Streaming Platforms |
| Broadcasters |
| Telecom and Pay-TV Operators |
| Media and Entertainment Companies |
| Other End Users |
| North America | United States |
| Canada | |
| Mexico | |
| South America | Brazil |
| Argentina | |
| Chile | |
| Rest of South America | |
| Europe | Germany |
| United Kingdom | |
| France | |
| Italy | |
| Spain | |
| Rest of Europe | |
| Asia-Pacific | China |
| Japan | |
| India | |
| South Korea | |
| Australia | |
| Rest of Asia-Pacific | |
| Middle East | Saudi Arabia |
| United Arab Emirates | |
| Qatar | |
| Rest of Middle East | |
| Africa | South Africa |
| Egypt | |
| Nigeria | |
| Rest of Africa |
| By Content Type | Movies and Feature Films | |
| Original Series and Web Series | ||
| Documentary and Non-Fiction | ||
| Reality Shows and Unscripted Content | ||
| Animation and Kids Content | ||
| Other Content Types | ||
| By Licensing Model | Content Acquisition Agreements | |
| Co-Licensing and Partnership Agreements | ||
| Revenue-Sharing Agreements | ||
| Other Licensing Models | ||
| By End User | OTT Streaming Platforms | |
| Broadcasters | ||
| Telecom and Pay-TV Operators | ||
| Media and Entertainment Companies | ||
| Other End Users | ||
| By Geography | North America | United States |
| Canada | ||
| Mexico | ||
| South America | Brazil | |
| Argentina | ||
| Chile | ||
| Rest of South America | ||
| Europe | Germany | |
| United Kingdom | ||
| France | ||
| Italy | ||
| Spain | ||
| Rest of Europe | ||
| Asia-Pacific | China | |
| Japan | ||
| India | ||
| South Korea | ||
| Australia | ||
| Rest of Asia-Pacific | ||
| Middle East | Saudi Arabia | |
| United Arab Emirates | ||
| Qatar | ||
| Rest of Middle East | ||
| Africa | South Africa | |
| Egypt | ||
| Nigeria | ||
| Rest of Africa | ||


Key Questions Answered in the Report
What is the current size of the OTT content licensing market?
The OTT content licensing market reached USD 50.97 billion in 2025 and stands at USD 59.16 billion in 2026, with forecast value of USD 111.65 billion by 2031 at a 13.54% CAGR.
Which content category leads OTT content licensing demand?
Movies and feature films led the content mix with 32.84% share in 2025, supported by strong demand for proven theatrical intellectual property and large Pay-1 deals.
What is the fastest-growing content type through 2031?
Animation and kids content is projected to expand at a 14.12% CAGR through 2031, helped by strong family retention and cross-platform franchise value.
Which licensing model is growing the fastest?
Revenue-sharing agreements are expected to record the fastest CAGR at 14.73% through 2031, as platforms and rights holders move toward performance-linked deal structures.
Which region is expected to grow the fastest in OTT content licensing?
Asia-Pacific is projected to post the highest CAGR at 14.67% through 2031, supported by rising premium video demand, expanding AVOD revenue, and stronger local licensing activity.
Why are telecom and pay-TV operators becoming more important buyers?
Telecom and pay-TV operators are projected to grow at a 14.38% CAGR because they use licensed content to strengthen broadband and mobile bundles without carrying the full cost of in-house production.
Page last updated on:





