
Oolong Tea Market Size and Share
Market Overview
| Study Period | 2022 - 2032 |
|---|---|
| Market Size (2027) | USD 0.79 Billion |
| Market Size (2032) | USD 1.07 Billion |
| Growth Rate (2027 - 2032) | 6.12 % |
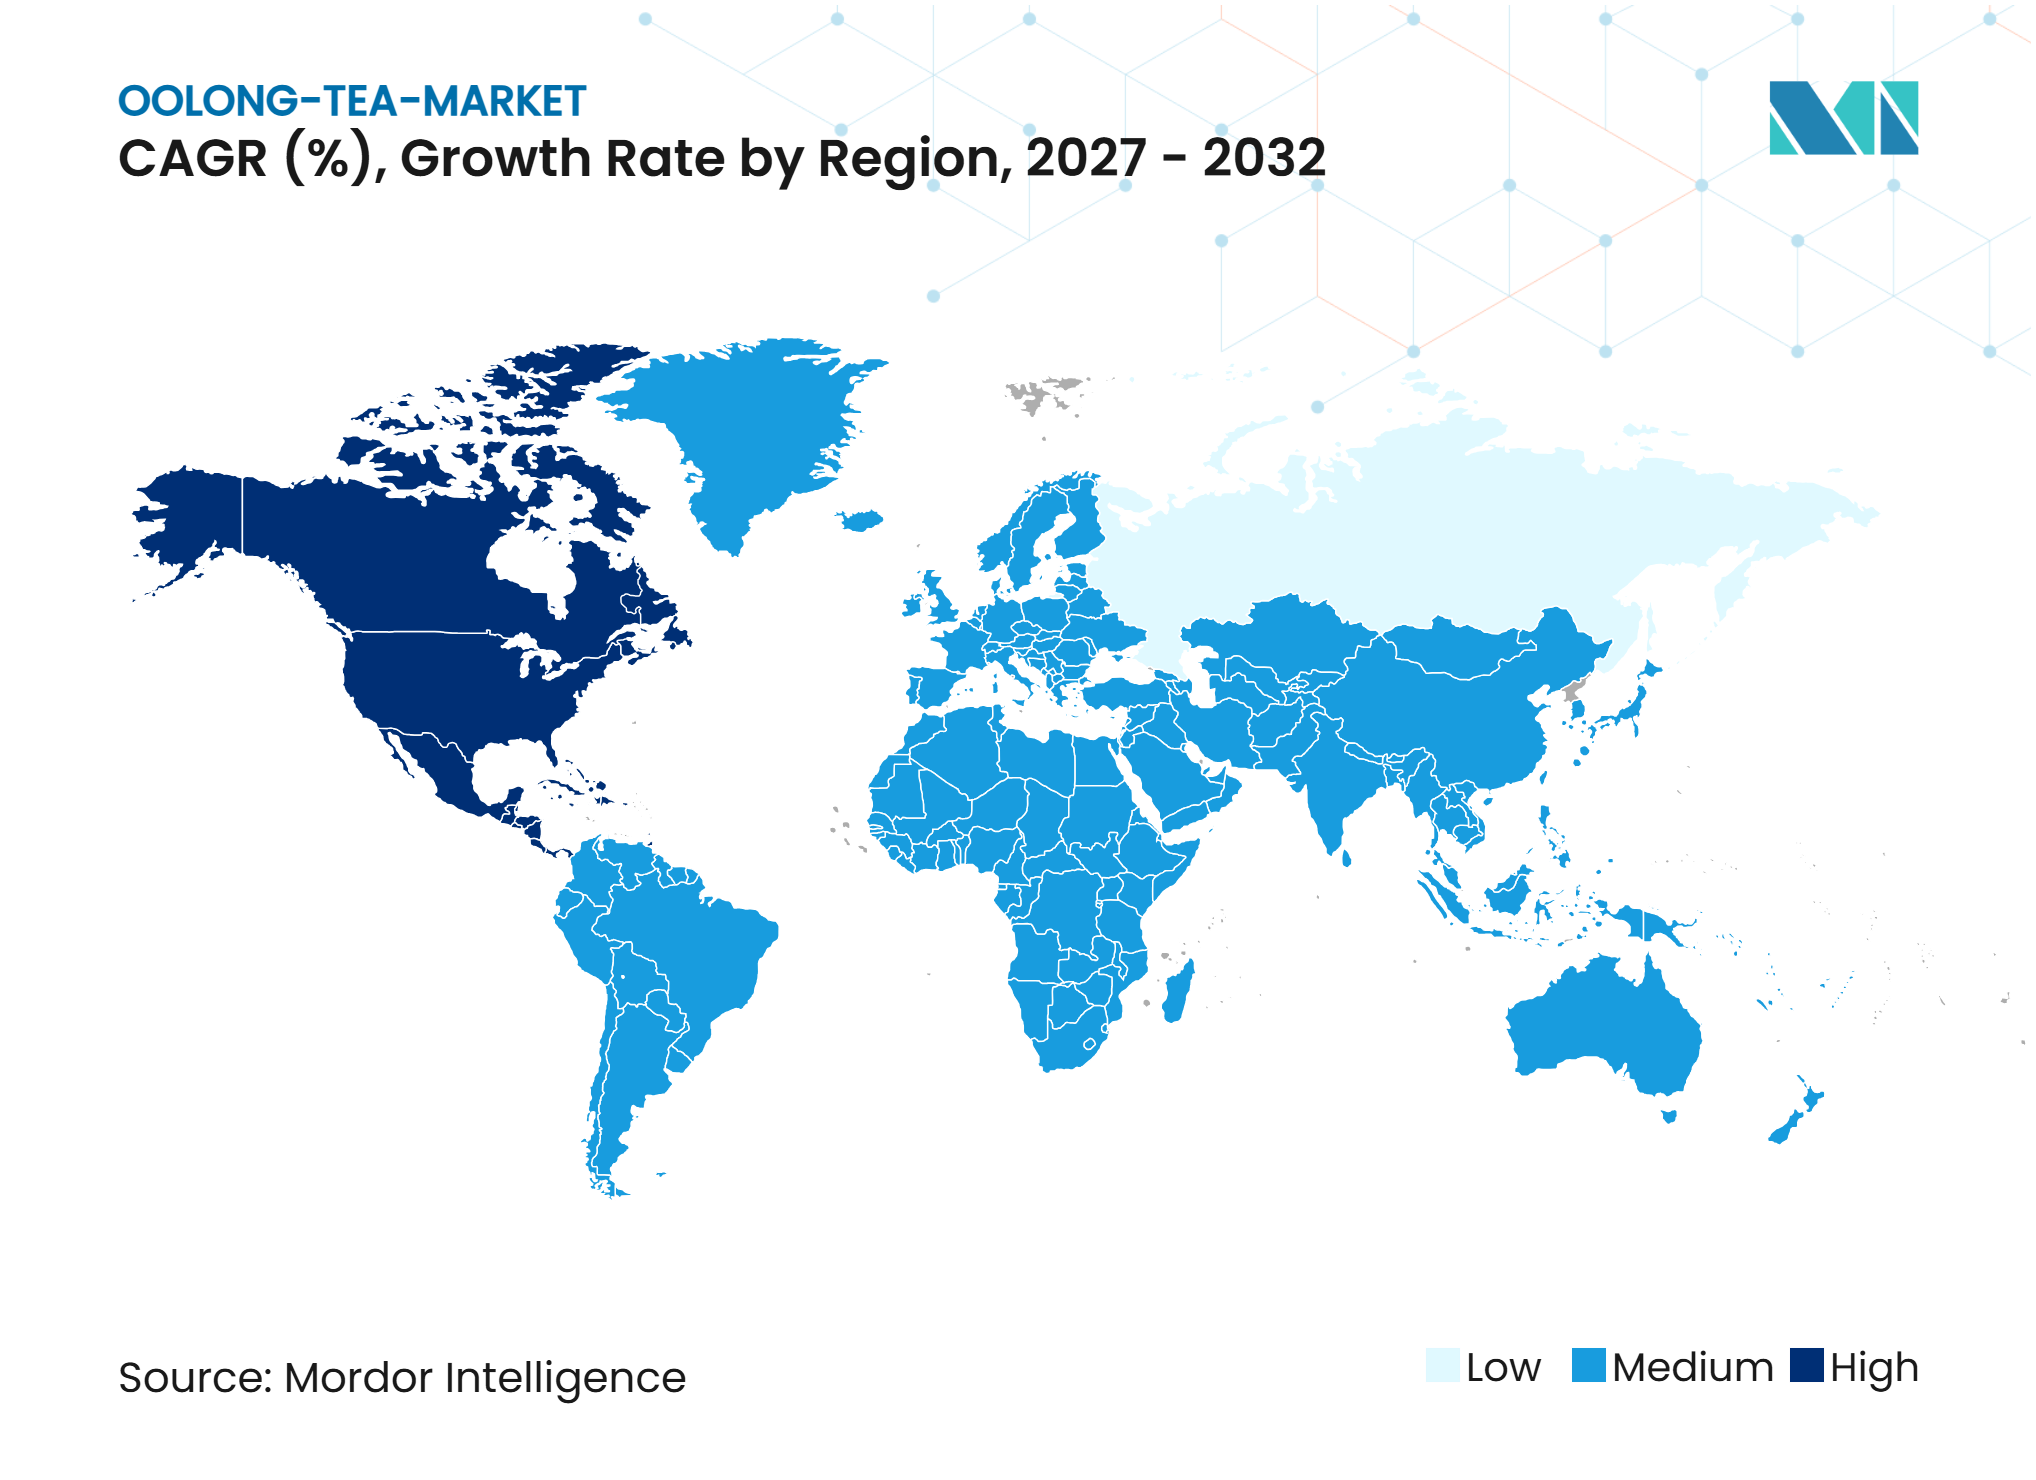
| Fastest Growing Market | Middle East and Africa |
| Largest Market | Asia-Pacific |
| Market Concentration | Low |
Major Players *Disclaimer: Major Players sorted in no particular order Image © Mordor Intelligence. Reuse requires attribution under CC BY 4.0. | |
Oolong Tea Market Analysis by Mordor Intelligence
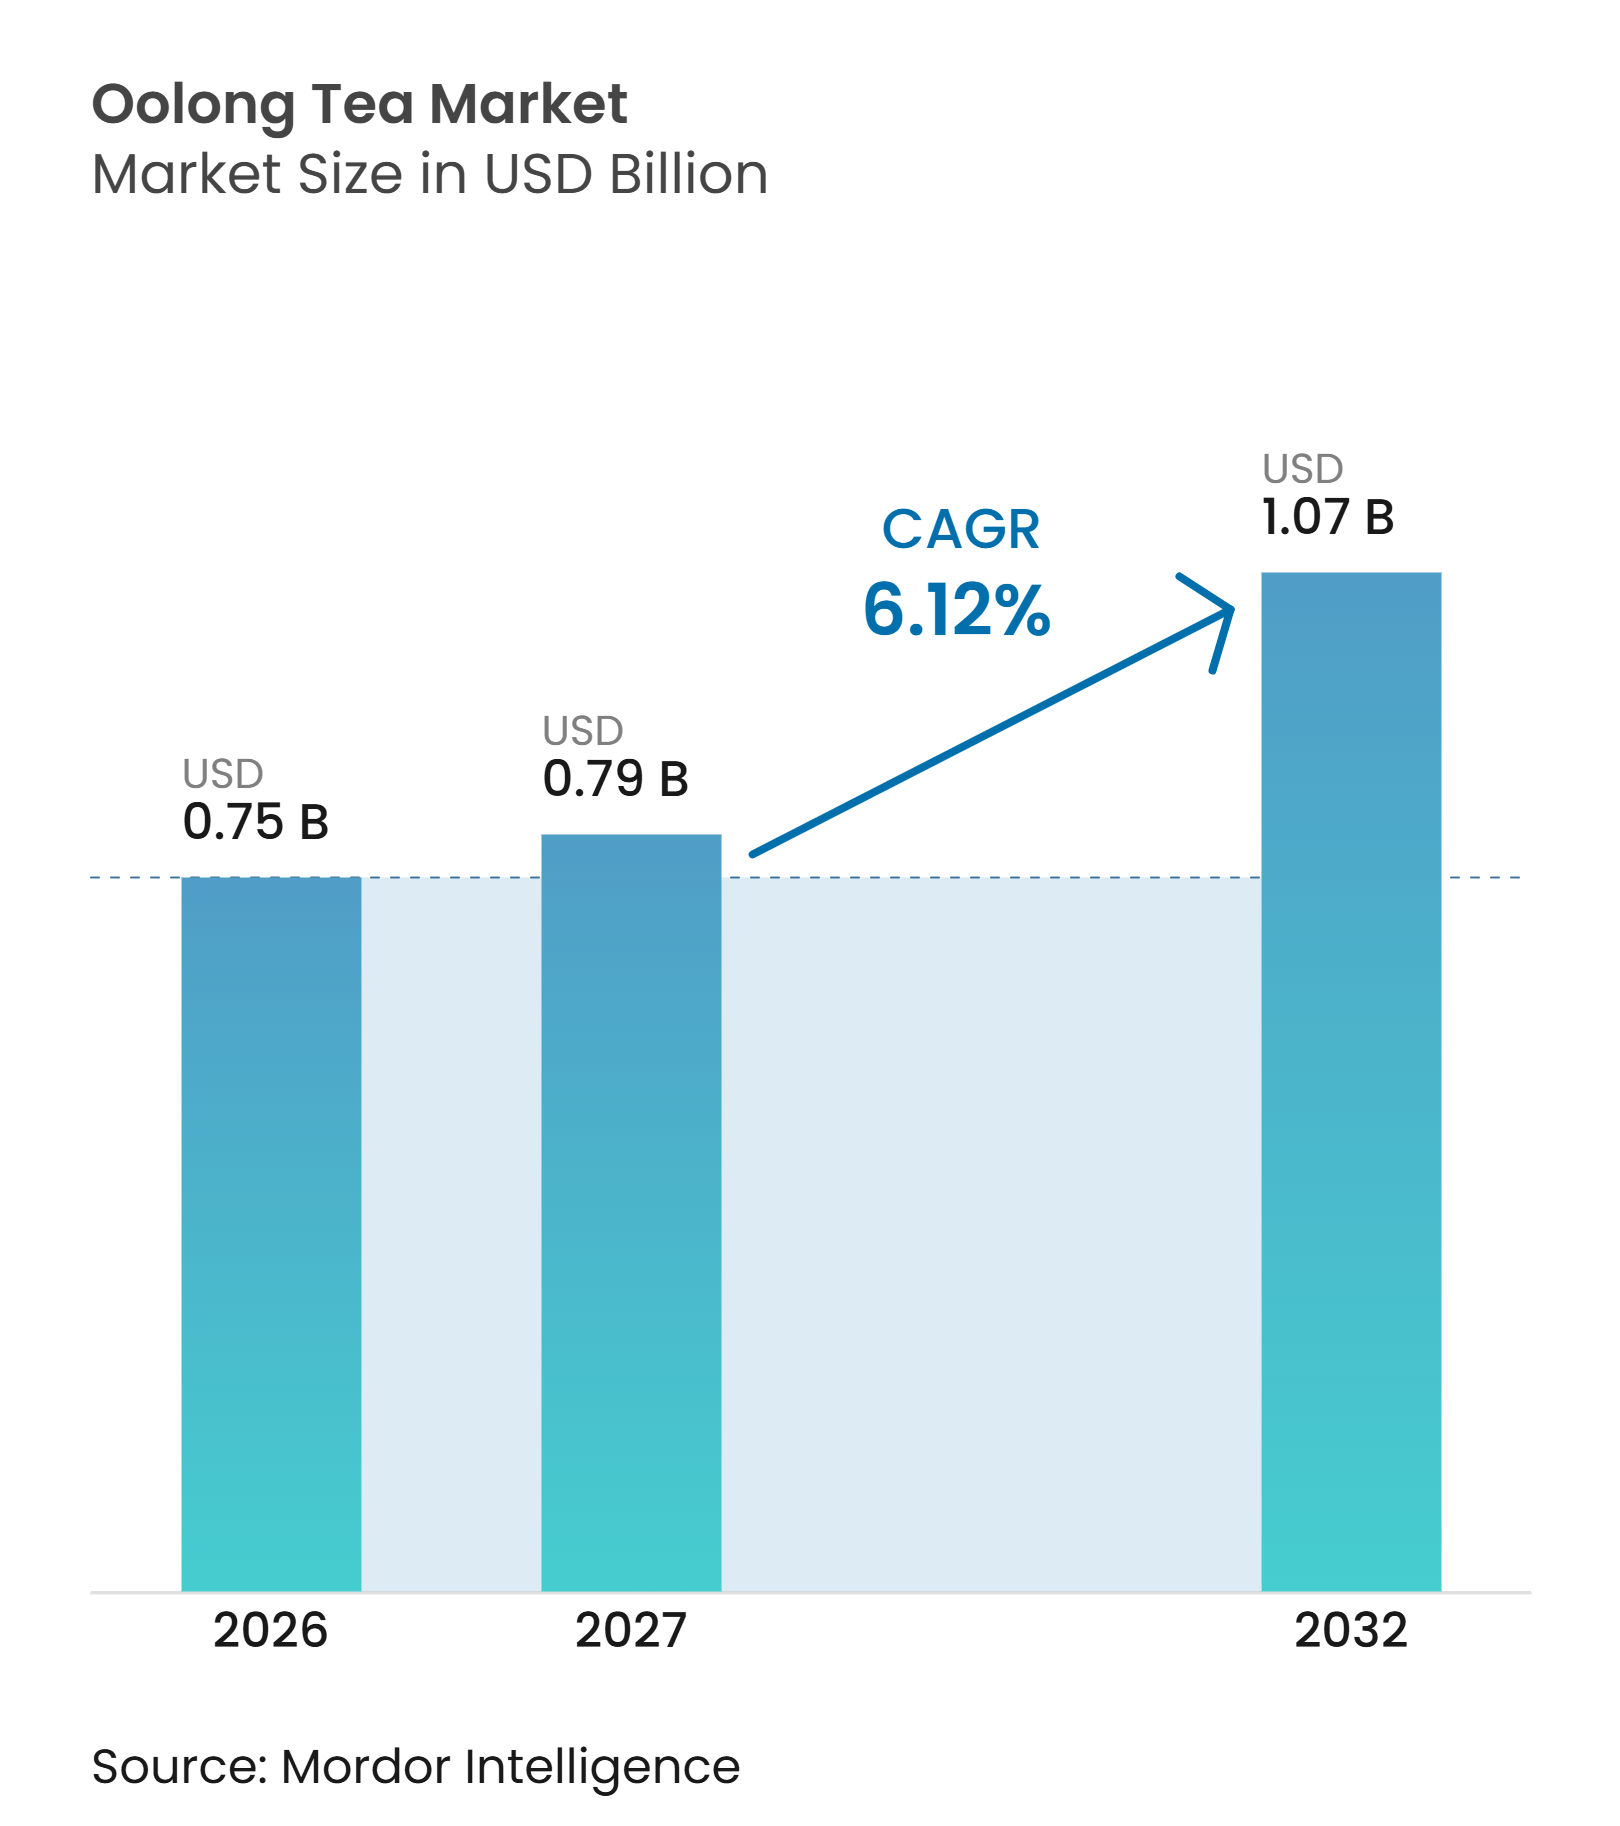
The Oolong tea market size is projected to expand from USD 0.75 billion in 2026 and USD 0.79 billion in 2027 to USD 1.07 billion by 2032, registering a CAGR of 6.12% between 2027 to 2032. The Oolong tea market is supported by premium loose-leaf demand, flavored products, online specialty retail, and wider use in foodservice. Premium tea is becoming more dependent on verified origin, blending, branding, and traceable sourcing, which gives producers with documented supply chains a clearer route to defend value. The Dubai Multi Commodities Centre identified premium, organic, functional, and ready-to-drink tea as higher-margin areas within global tea trade, which supports this positioning for oolong products. The Oolong tea market also faces a practical tension between premium leaf offerings and convenient RTD products, since the first supports unit value while the second expands access and volume. Supply disruptions affecting Middle East trade routes could slow imported specialty tea demand in the near term.
Key Report Takeaways
-
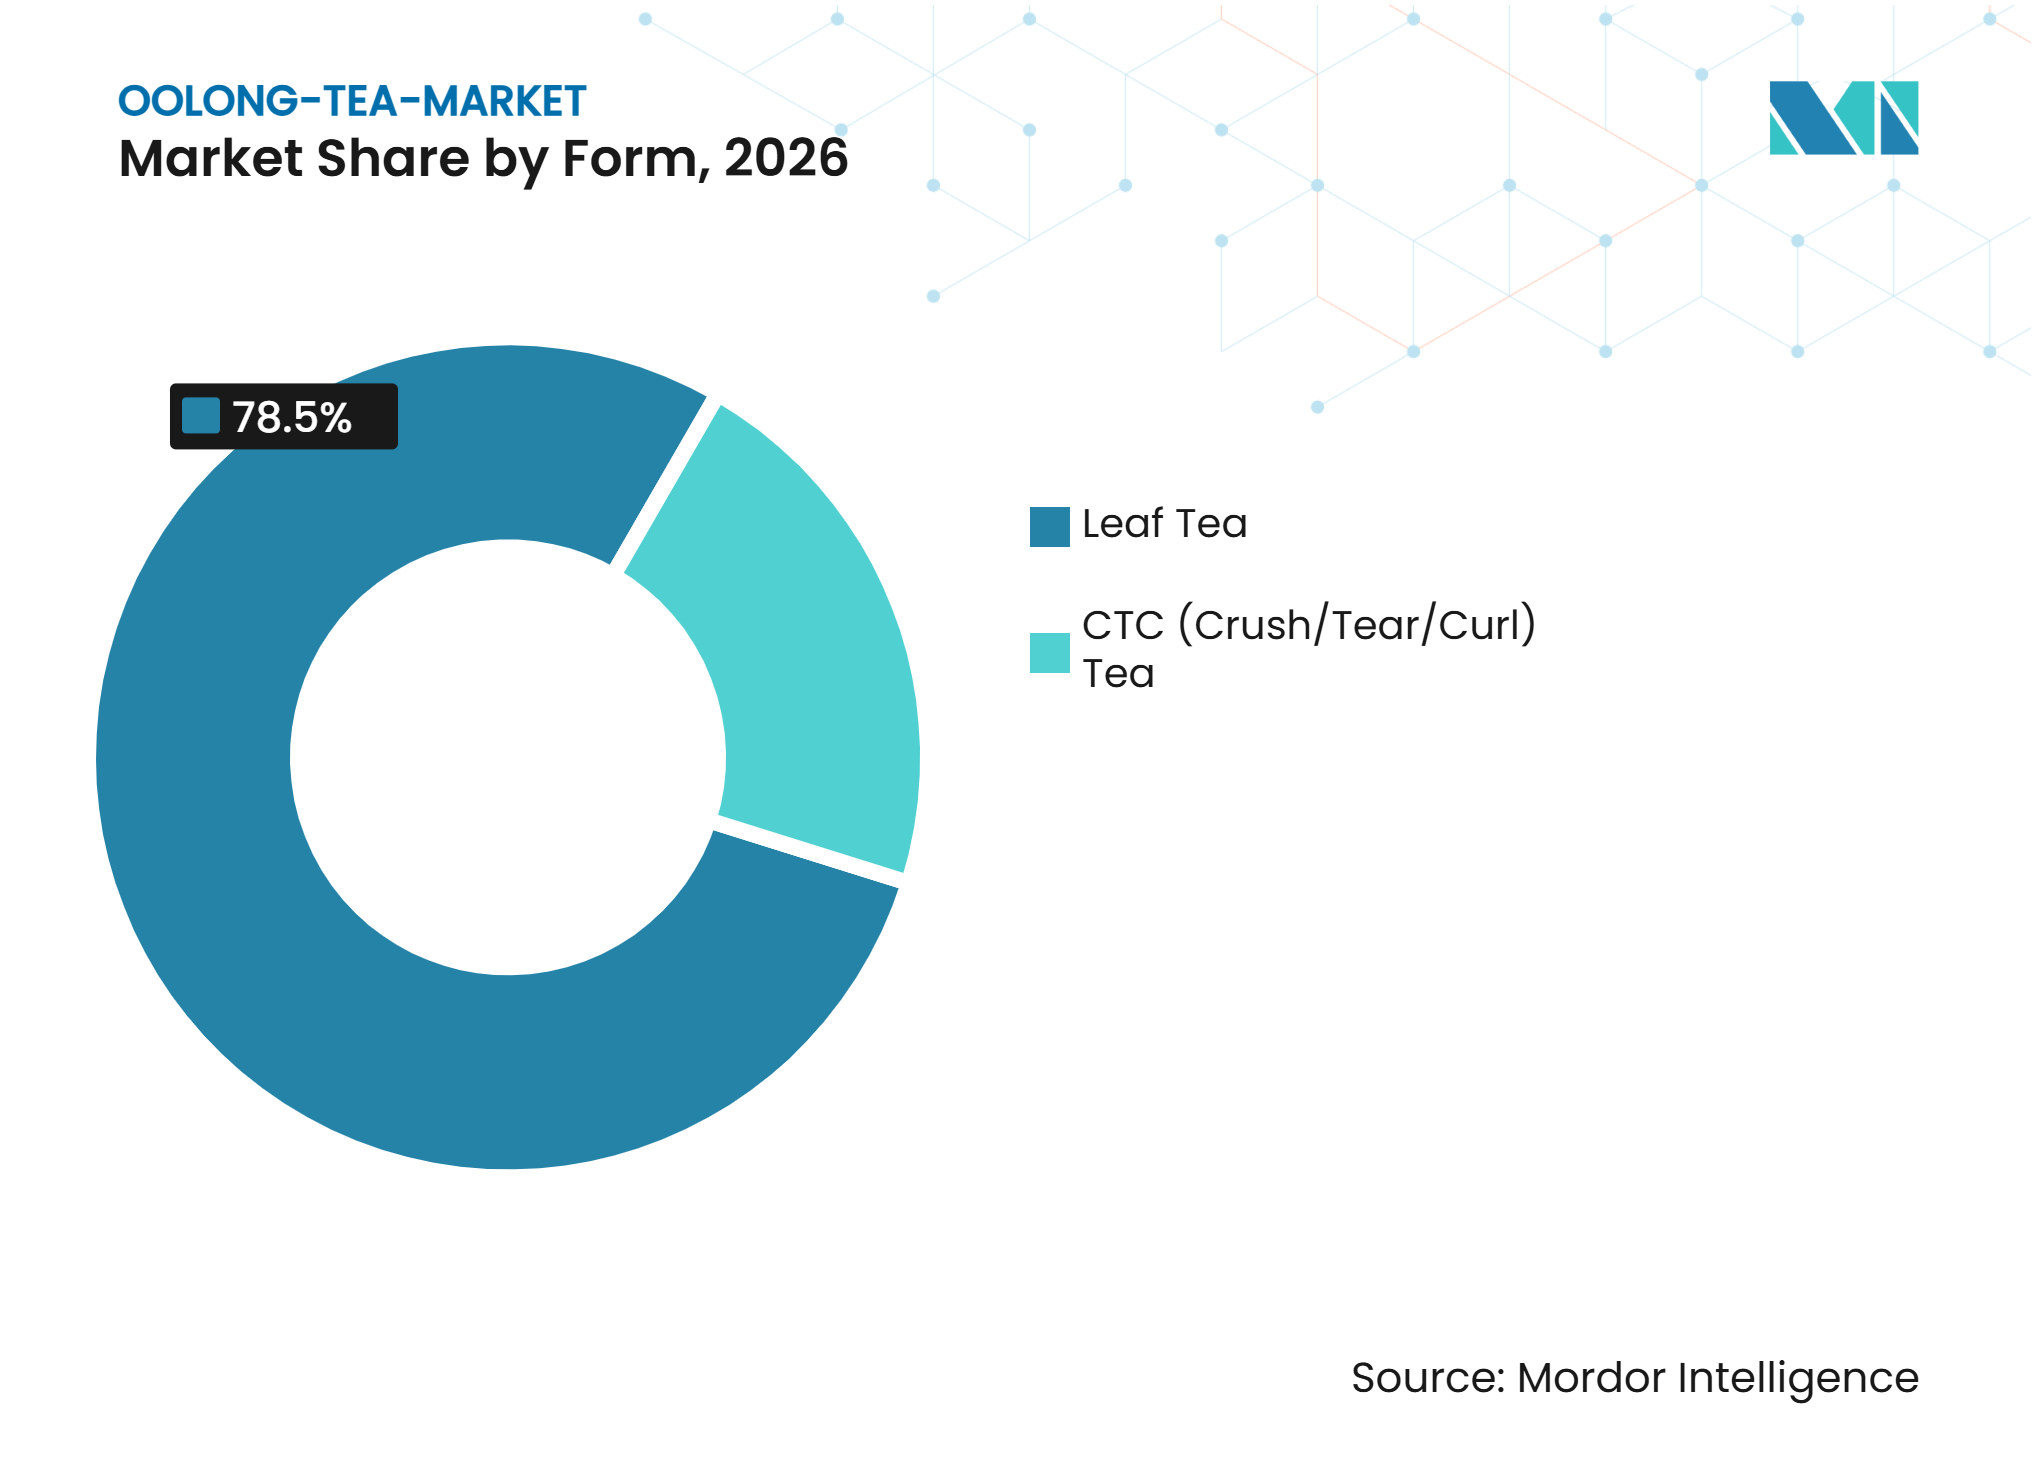
By form, Leaf Tea held 78.5% of the Oolong tea market share in 2026, while CTC Tea is forecast to grow at a 7.3% CAGR through 2032.
-
By category, Conventional Tea held 76.4% share in 2026, while Organic Tea is forecast to grow at an 8.2% CAGR through 2032.
-
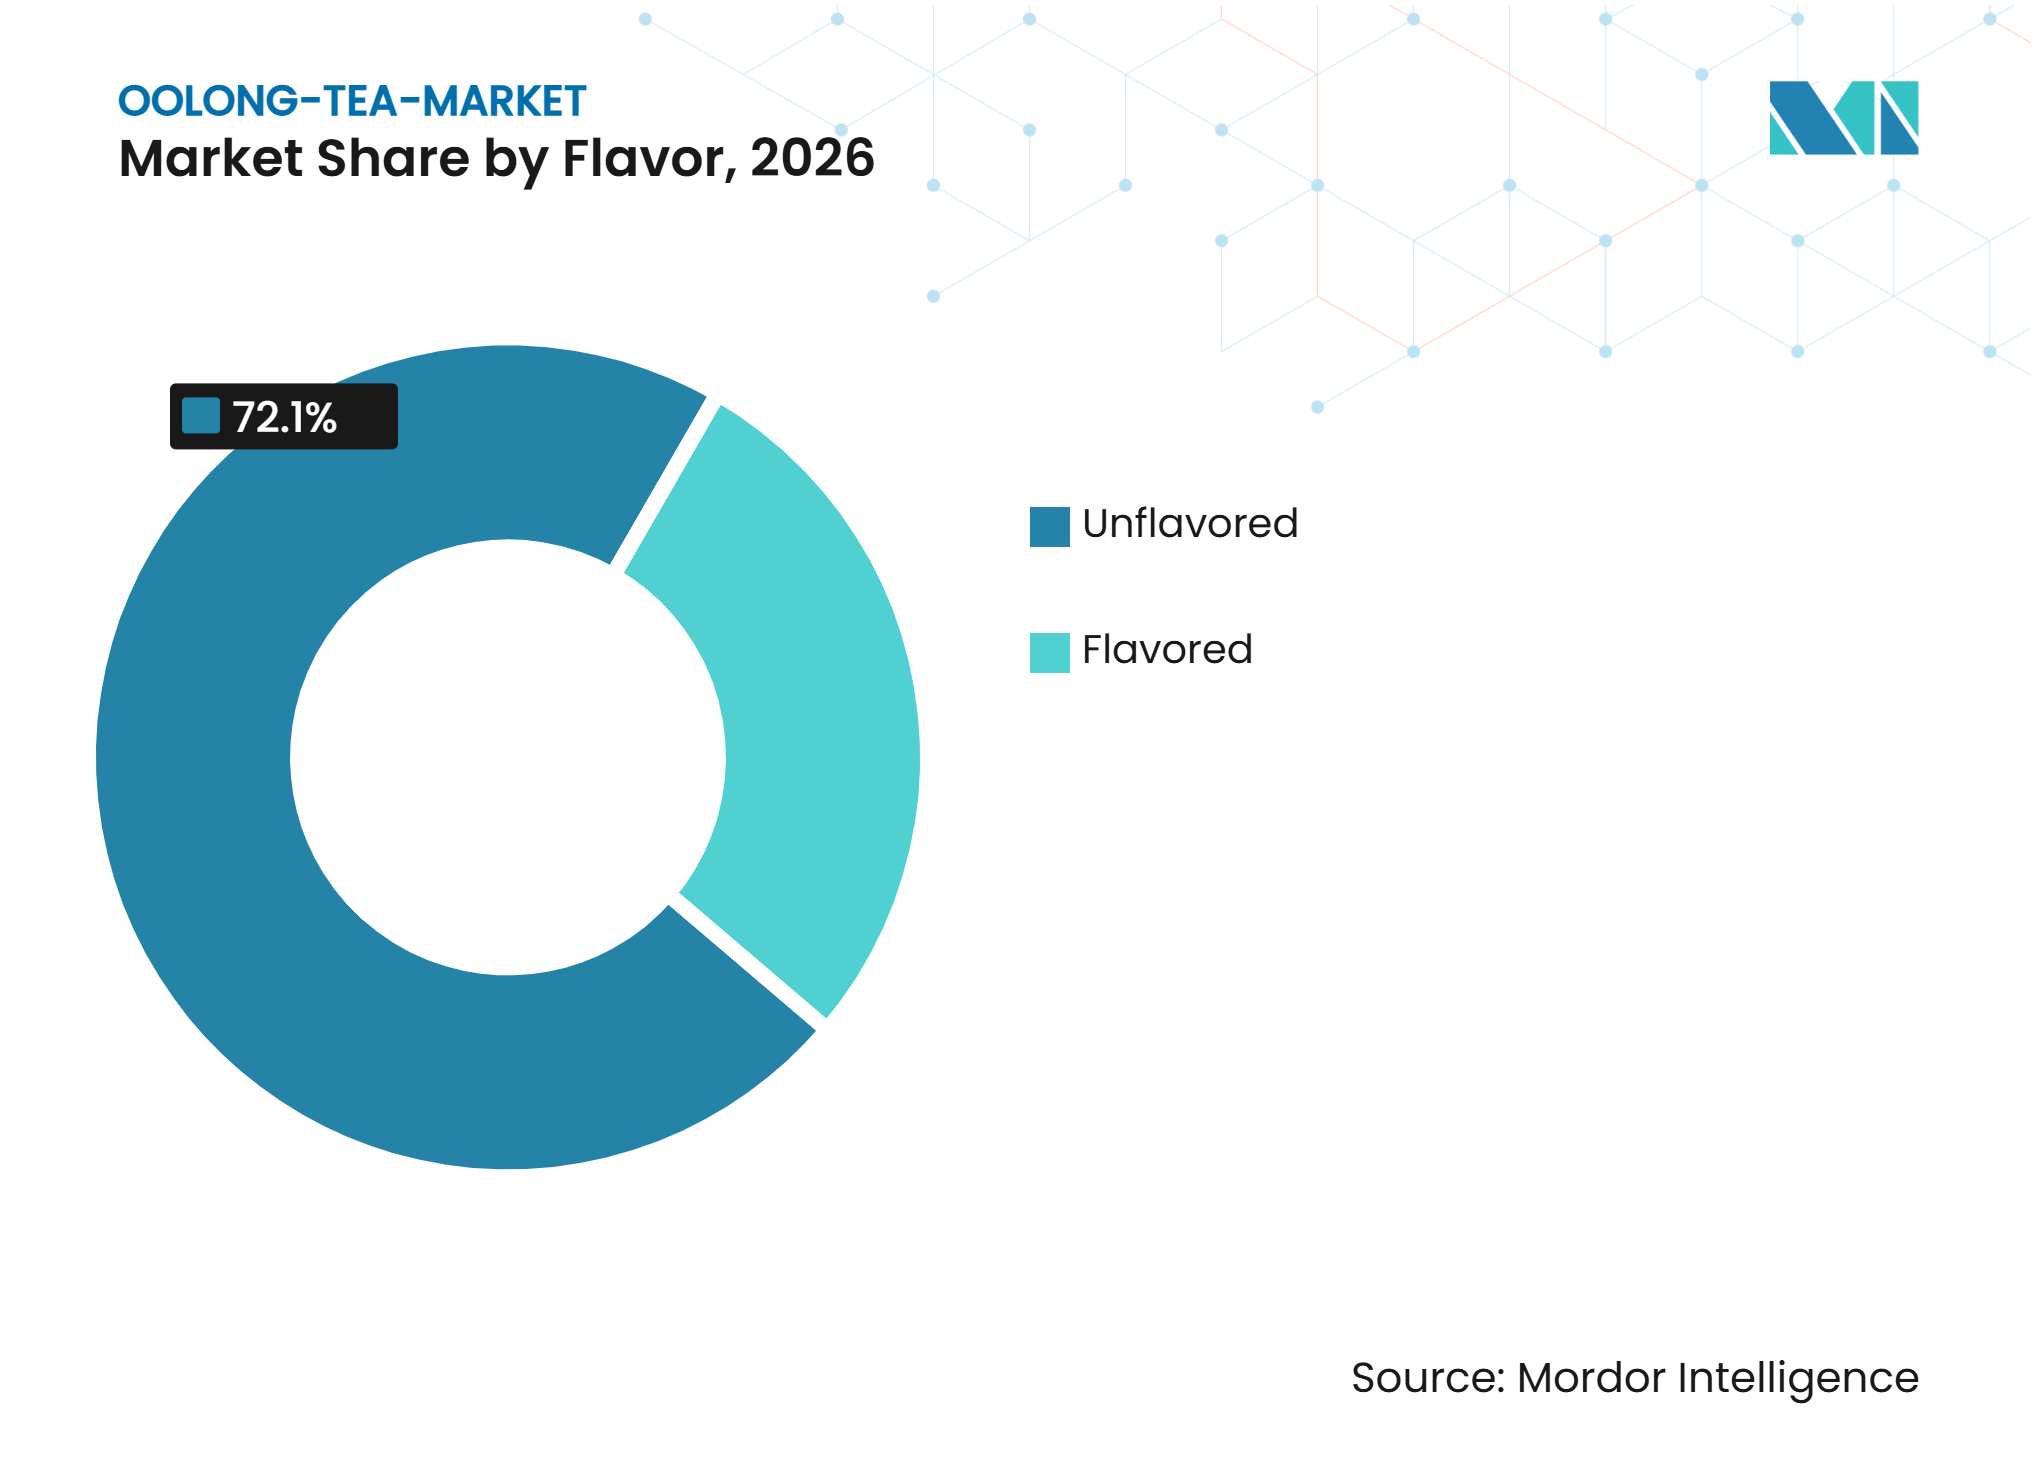
By flavor, Unflavored Oolong held 72.1% share in 2026, while Flavored Oolong is forecast to grow at a 7.8% CAGR through 2032.
-
By packaging type, Box packaging held 38.4% share in 2026, while Sachets are forecast to grow at a 7.5% CAGR through 2032.
-
By distribution channel, Off-Trade held 83.6% share in 2026, while On-Trade is forecast to grow at an 8.1% CAGR through 2032.
-
By geography, Asia-Pacific held 42.4% share in 2026, while Middle East and Africa is forecast to grow at a 7.6% CAGR through 2032.
Note: Market numbers in this report are based on Mordor Intelligence's proprietary estimation framework, which combines nine months of actuals with Q4 projections for base year 2026.
Market Trends and Insights
Drivers Impact Analysis of Oolong Tea Market*
| Driver | (~) % Impact on CAGR Forecast | Geographic Relevance | Impact Timeline |
|---|---|---|---|
| Sustainability and Ethical Sourcing Preferences | +0.8% | Global, led by Western Europe and North America | Long term (≥ 4 years) |
| Functional Blends and Flavored Infusions | +1.0% | Global, strongest in North America, Western Europe, and Southeast Asia | Medium term (2-4 years) |
| Premiumization and Specialty Tea Trend | +1.1% | Global, strongest in Asia-Pacific, North America, and Western Europe | Medium term (2-4 years) |
| Growth of E-Commerce and Online Specialty Retail | +0.9% | Global, highest in North America, Europe, and China | Short term (≤ 2 years) |
| Product Innovation in Ready-To-Drink Formats | +0.8% | Asia-Pacific, with spillover to Middle East and Africa and North America | Short term (≤ 2 years) |
| Technological Advancements in Tea Processing | +0.5% | Asia-Pacific, with spillover to South Asia | Long term (≥ 4 years) |
| Source: Mordor Intelligence | |||
Premiumization and Specialty Tea Trend
The Oolong tea market benefits from buyers placing greater weight on origin, altitude, harvest, cultivar, and production method. High-mountain Taiwanese, Wuyi rock, and Phoenix Dancong teas can use the same provenance-based logic that supports specialty coffee and fine wine. The DMCC stated that blending, branding, and verifiable provenance create the main value-added opportunity in the global tea trade. This favors estates and brands that can document where their leaves were grown and how they were handled. Premium positioning does not automatically secure higher margins, because high-altitude and certified supply is limited and costs can rise when specialty buyers compete for the same output. The Oolong tea market therefore rewards disciplined price management as much as distinctive origin claims.
Functional Blends and Flavored Infusions
Functional blends widen the appeal of oolong beyond buyers who already understand traditional tea styles. Its moderate caffeine profile and polyphenol content give brands a tea base for fruit, botanical, and wellness-oriented formulations. This makes flavored products useful for consumers who may find unflavored oolong unfamiliar or difficult to evaluate. The Oolong tea market can use these products to bridge traditional leaf formats and convenient beverages without losing the underlying tea identity. The demand case is stronger when formulation is supported by transparent ingredients and credible product information. Peer-reviewed research on sustainable tea farming by IOP Journal also reports environmental and quality-related benefits from sustainable production methods, including better soil fertility and higher polyphenol concentrations.
Growth of E-Commerce and Online Specialty Retail
Online retail gives consumers outside traditional origin markets access to single-origin oolong, subscriptions, and direct-to-consumer assortments. It also lets small producers explain processing, cultivar, flavor, and preparation in greater detail than a retail shelf usually permits. The Oolong tea market can build demand through this educational role, especially where consumers have limited access to specialty tea stores. Digital channels can also make pricing more transparent, which helps established brands but makes unsupported premium claims harder to sustain. Cross-border shipping remains an operating risk for small-batch sellers because changes in trade rules or transport conditions can raise the cost of direct imports. Larger importers may be better placed to absorb these disruptions, which could change who controls access to specialty inventory.
Product Innovation in Ready-To-Drink Formats
RTD products give oolong a practical route into daily consumption occasions, particularly for younger urban consumers seeking convenience. These formats can combine oolong with fruit, carbonation, or functional ingredients while keeping the tea recognizable. The Oolong tea market gains volume potential when RTD products move beyond specialty outlets into convenience stores, supermarkets, and warehouse retail. Standardized processing becomes important in this shift because brands must maintain flavor and quality across large production runs. Research on industrial rolling and cutting by Journal of Science of Food and Agriculture found that these processing stages affect aroma-related metabolites, including linalool and fruity aroma precursors. This technical control can help manufacturers create consistent RTD formulations, although it does not replace the premium appeal of whole-leaf offerings.
Restraints Impact Analysis of Oolong Tea Market*
| Restraint | (~) % Impact on CAGR Forecast | Geographic Relevance | Impact Timeline |
|---|---|---|---|
| Strong Competition from Established Tea Varieties | -0.8% | Global, highest in North America, Europe, and South Asia | Medium term (2-4 years) |
| Supply Chain and Logistics Disruptions | -0.7% | Global, highest on Middle East and Africa supply routes and cross-border specialty imports | Short term (≤ 2 years) |
| Regulatory and Compliance Complexity | -0.4% | North America, Europe, and East Asia | Medium term (2-4 years) |
| Adulteration and Authenticity Concerns | -0.4% | Asia-Pacific and North America | Short term (≤ 2 years) |
| Source: Mordor Intelligence | |||
Strong Competition from Established Tea Varieties
The Oolong tea market must compete with familiar black tea, green tea, matcha, and herbal products that already have established habits and clear consumer associations. Oolong often requires consumers to try a different flavor profile rather than simply switch brands within a familiar type. This raises the value of café sampling, trained foodservice staff, and clear point-of-sale explanations. Wellness positioning also offers no exclusive advantage because other tea varieties make similar claims and may have stronger recognition. Price-sensitive consumers can move toward lower-cost choices when they do not understand why a specialty oolong costs more. Brands therefore need to connect origin, flavor, and preparation with a clear reason to purchase rather than rely on general awareness campaigns.
Adulteration and Authenticity Concerns
Authentication is central to premium oolong because consumers cannot easily verify origin, altitude, organic status, or blending from appearance alone. A peer-reviewed study by Cambridge Organization found that region, certification, and production factors influence tea prices, making documentation commercially important rather than merely administrative. Weak labeling or inconsistent quality can therefore reduce willingness to pay and limit repeat purchasing. The Oolong tea market requires robust traceability across growers, processors, exporters, and importers to protect premium offers. Certification and verified origin records are especially important in cross-border trade, where buyers depend on documents to compare suppliers. Stronger compliance systems may increase near-term costs, but they also give credible producers a clearer way to protect pricing.
*Our forecasts treat driver/restraint impacts as directional, not additive. The impact forecasts reflect baseline growth, mix effects, and variable interactions.
Oolong Tea Market Segment Analysis
By Form:
Leaf Tea Anchors Premium PositioningLeaf Tea held 78.5% of the Oolong tea market size by form in 2026. The format remains linked with connoisseur consumption, ceremonial preparation, and estate-specific offerings. It can carry detailed information on origin region, altitude, harvest season, and cultivar. These attributes matter in retail and foodservice settings where premium tea is sold through provenance and preparation stories. Certified organic leaf tea can reinforce those signals because consumers can connect a documented production method with a higher-quality offer. Research on tea pricing confirms that region and certification influence value perceptions and price outcomes. Producers that preserve this information from farm through final packing can give retailers and foodservice buyers a more complete basis for presenting a premium leaf offer.
CTC Tea is forecast to grow at a 7.3% CAGR through 2032. The format suits RTD and foodservice users that need faster extraction, uniform brewing, and reliable output at scale. Smaller particles create more surface area, which supports rapid infusion for bottled drinks and fruit-based formulations. The Oolong tea market can use CTC processing where throughput and product consistency matter more than a visible leaf presentation. Industrial research shows that rolling and cutting affect flavor metabolites and aroma precursors, which makes process control relevant for standardized products. CTC is likely to benefit from higher-volume demand, while leaf tea remains better placed to retain premium provenance value. The two formats can therefore serve different purchase occasions within the same portfolio, rather than requiring a choice between traditional and convenient products.


By Category:
Organic Growth Reflects Certification MomentumConventional Tea accounted for 76.4% of the Oolong tea market size in 2026. This position reflects established production systems, lower certification costs, and long-standing buyer relationships across origin markets. Conventional supply includes both mass-market blends and high-quality estate teas that are not formally certified. This means that its volume lead does not necessarily translate into equal value leadership at the premium end. Buyers are increasingly asking suppliers for sustainability and traceability documents even when products are not certified organic. The category therefore faces a gradual shift in which documentation becomes a baseline expectation rather than a feature reserved for a small premium tier. Suppliers without formal certification can still compete, but they need consistent records that explain their sourcing, processing, and product-handling practices.
Organic Tea is forecast to grow at an 8.2% CAGR through 2032. Wellness preferences, ethical sourcing, and procurement scrutiny support its expansion. Sustainable tea farming methods have been associated with stronger soil fertility and higher polyphenol concentrations in a review of the available evidence. This evidence can support brand communication when it is presented carefully and tied to documented practices. Organic suppliers may also be better prepared for import requirements that require full origin and handling records. The Oolong tea market can gain from organic growth when certification is supported by credible traceability rather than broad sustainability language. The strongest offers align farming claims, packaging information, and supplier documentation so that buyers can assess them consistently.
By Flavor:
Flavored Variants Broaden Consumer ReachUnflavored oolong held 72.1% of the market by flavor in 2026. It remains important in China, Taiwan, Japan, and South Korea, where consumers recognize the natural floral, fruity, roasted, and mineral notes that vary by origin and oxidation. This segment depends on consistent production quality because buyers expect the tea itself to provide the flavor experience. Producers can strengthen its position through transparent descriptions of terroir, cultivar, and preparation. It also faces pressure from younger consumers who are more open to flavored and bubble tea formats. The Oolong tea market must preserve the cultural and premium role of unflavored tea while adapting how it is introduced to new consumers. Sampling, simple brewing instructions, and clear flavor descriptions can help newer buyers understand differences without simplifying the product itself.
Flavored Oolong is forecast to grow at a 7.8% CAGR through 2032. Fruit, floral, milk tea, and other variations can lower the sensory barrier for first-time buyers. These products use oolong as a recognizable base while giving consumers an accessible entry point. They are especially suited to café menus, RTD products, and social occasions where trial is more likely. The format can support conversion into traditional teas, but it can also shift demand toward more standardized blends. Brands need to keep tea quality visible in flavored products so that convenience does not weaken their connection with oolong’s premium identity. Ingredient choices, tea origin information, and balanced flavor design can help maintain that connection across café and packaged formats.

By Packaging Type:
Sachets Gain Momentum in ConvenienceBox packaging held 38.4% of the market by packaging type in 2026. It fits established retail distribution and gifting traditions, especially for premium teas in Asian markets. The larger surface area lets brands explain provenance, brewing guidance, and quality cues at the point of sale. It is therefore well suited to loose-leaf products that rely on a detailed story. Boxes can also give retailers a format that is easy to stack and display. Packaging quality remains relevant because buyers frequently use freshness protection and presentation as indicators of how carefully a specialty tea has been handled. Producers can use this space to explain storage, brewing, and origin details that support an informed purchase decision.
Sachets are forecast to grow at a 7.5% CAGR through 2032. They respond to demand for portion control, office consumption, hotel amenities, and standardized preparation in foodservice. Single-serve formats help cafés and bubble tea operators maintain consistent recipes during busy service periods. This creates a link between sachets and the faster-growing on-trade channel. Compostable and biodegradable materials can add a further point of differentiation for direct-to-consumer brands. The Oolong tea market can use this format to widen access, provided the packaging protects freshness and does not conflict with sustainability claims. Clear disposal instructions and consistent material choices can make environmental claims easier for consumers and buyers to evaluate.
By Distribution Channel:
Off-Trade Anchors Volume, On-Trade Leads GrowthOff-Trade accounted for 83.6% of the Oolong tea market share in 2026. Supermarkets, hypermarkets, convenience stores, grocery stores, and online retailers give brands broad exposure across both established and emerging demand centers. Retail availability supports repeat buying after consumers have already tried a product in cafés or restaurants. Online retail also adds direct access to customers in places without specialist tea shops. These channels suit both packaged leaf tea and RTD offerings. The Oolong tea market will continue to depend on off-trade reach for volume even as specialty operators build demand through more experiential venues. Coordinated product information across retail, online, and foodservice settings can help brands turn initial trial into repeat purchasing.
On-Trade is forecast to grow at an 8.1% CAGR through 2032. Specialty tea cafés, hotels, and bubble tea chains use oolong as a base for drinks that customers can try before buying packaged products. This makes the channel a customer-acquisition route as well as a source of direct sales. Bain Capital announced its acquisition of Gong cha in August 2026, a chain with nearly 2,200 stores across 33 markets. The transaction shows continued investor interest in scalable tea foodservice formats. Operators can differentiate with provenance, heritage preparation, or functional ingredients, but they must still deliver fast and repeatable service. Well-designed recipes and trained staff are important because inconsistent preparation can weaken the consumer’s first impression of a specialty tea.
Geography Analysis
Asia-Pacific
Asia-Pacific accounted for 42.4% of the Oolong tea market size in 2026. China, Taiwan, Vietnam, and Japan combine long-running production capabilities with large consumer bases and well-established tea rituals. The region also remains the main source of product innovation, particularly in RTD oolong and convenience formats. Producers have room to combine heritage styles with contemporary flavored offerings as consumer preferences evolve. Processing capability is a competitive advantage because consistent scaling of RTD products depends on control over aroma and flavor formation. Documentation of origin, processing, and food safety is increasingly important for export-facing suppliers, as it supports premium positioning and compliance across destination markets.
Middle East and Africa
Middle East and Africa is forecast to grow at a 7.6% CAGR through 2032. Dubai’s re-export infrastructure connects Asian tea origins with buyers across the region and supports blending, packaging, and distribution. The DMCC Tea Centre handled more than 24,400 metric tonnes of tea in 2024, which illustrates the hub’s role in regional tea trade[1]. Premium imported oolong has an opportunity in urban Gulf markets where consumers are exploring specialty varieties beyond traditional black and herbal tea. The Oolong tea market faces short-term shipping exposure because continued disruptions around the Strait of Hormuz could affect demand, prices, and logistics. Businesses using the Dubai hub will need resilient sourcing and inventory planning to limit this exposure.
Diversification Beyond Asia-Pacific Accelerates
North America is developing demand through specialty retail and cafés, where consumers can compare single-origin oolong with specialty coffee. In Europe, organic certification, clean labels, and documented provenance can help suppliers meet buyers’ expectations for transparency. South America remains early in its adoption cycle, but specialty coffee culture provides a familiar reference point for buyers who value origin and processing. These geographies favor brands that can explain quality clearly and manage small-batch supply reliably. The Oolong tea market can use direct-to-consumer sales and on-trade trial to build awareness, but logistics and compliance complexity can make scale harder for smaller importers. Credible certification, careful product education, and reliable fulfillment are likely to remain central to long-term development outside Asia-Pacific.
Competitive Landscape
Market Concentration
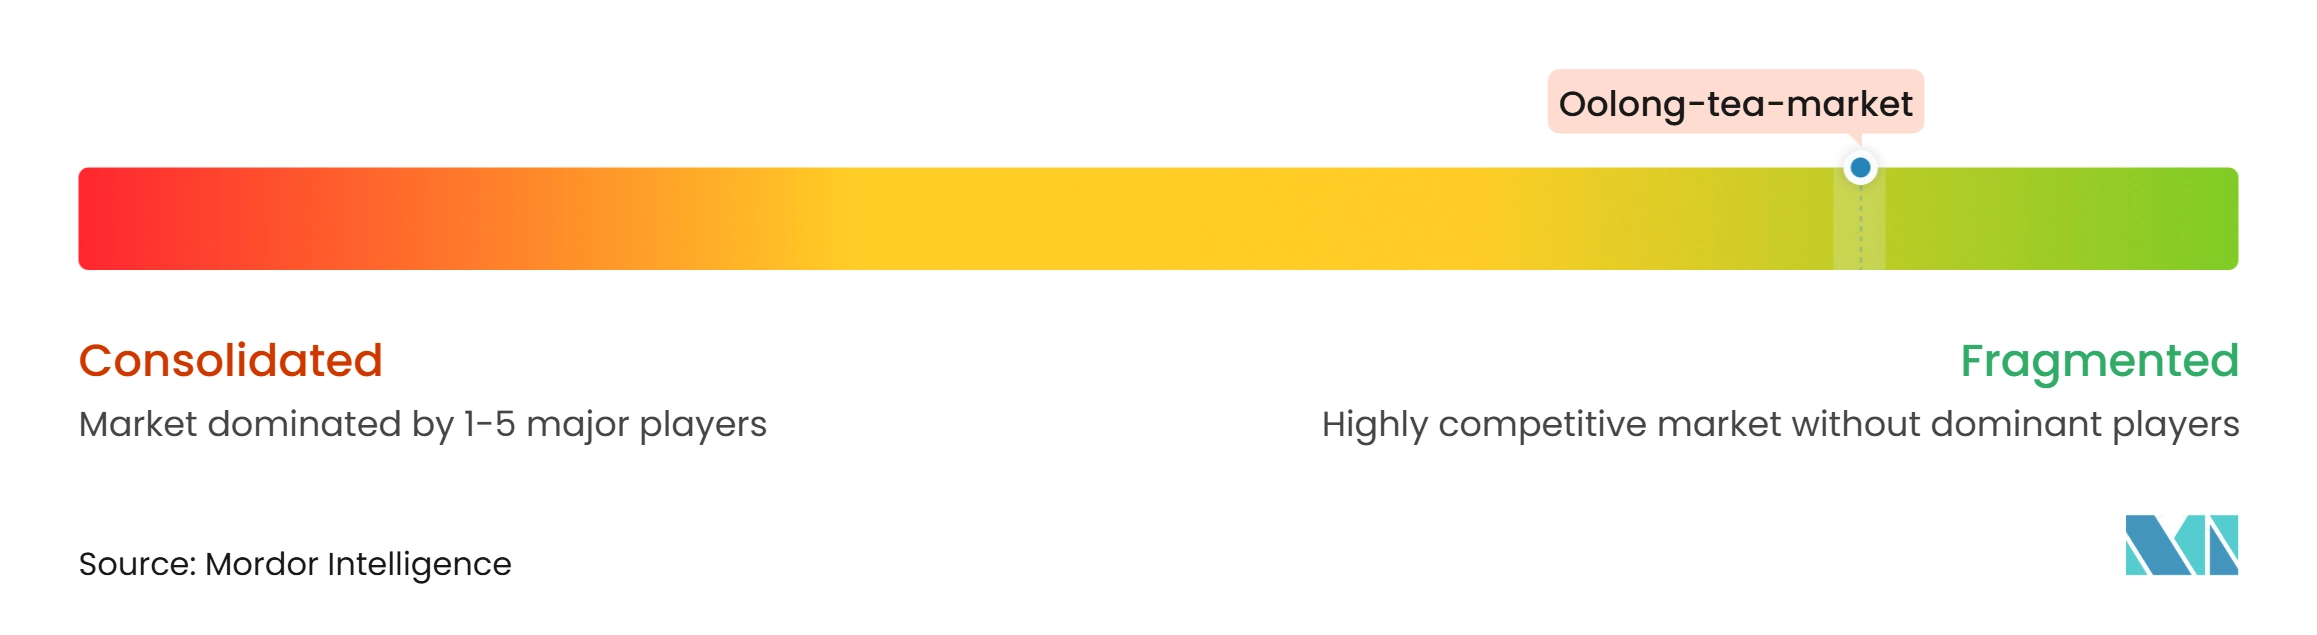
The Oolong tea market is fragmented, with no dominant player. Competitors include loose-leaf heritage specialists, large beverage companies with ready-to-drink (RTD) portfolios, and café operators. Most participants focus either on premium leaf tea or faster-moving RTD formats. Heritage brands compete on origin, cultivation, and preparation, while larger beverage groups use distribution scale and shelf presence to reach wider audiences. This divide creates an opportunity for brands that can combine specialty tea credentials with convenient formats.
Bain Capital's August 2026 acquisition of Gong cha is a clear strategic move in the on-trade segment. The chain's international footprint provides a platform to introduce oolong-based beverages at scale. Orbitel International partnered with Taiwan's Tea & Magic Hand to place Hawthorn Berry Oolong RTD in Costco Taiwan as 24-bottle packs, bringing a heritage product into a warehouse retail format. These moves show how companies are broadening distribution while adapting oolong for higher-frequency consumption. Competitive advantage will depend on whether these formats maintain a credible tea identity while meeting mass-channel expectations.
Opportunities remain in North America, Europe, South America, and sub-Saharan Africa, where overall tea consumption exceeds oolong penetration. Direct-to-consumer businesses can build a position through subscriptions and educational content around Taiwanese and Fujian tea. Foodservice chains can introduce oolong through branded drinks that lower the barrier to trial. Process innovation can improve standardization and cost control, but does not replace traceable supply. Certification and documentation offer a practical advantage as buyers scrutinize product claims. The fragmented market allows specialized operators to enter, though they must compete with better-funded players that control distribution.
Oolong Tea Industry Leaders
-
Bama Tea Co., Ltd.
-
TenFu's TEA
-
ITO EN, Ltd.
-
Associated British Foods plc
-
Ten Ren Tea Co., Ltd.
- *Disclaimer: Major Players sorted in no particular order
Oolong Tea Market Companies Covered in this Report
- Bama Tea Co., Ltd.
- TenFu's TEA
- Ten Ren Tea Co., Ltd.
- ITO EN, Ltd.
- Twinings, Associated British Foods plc
- Tata Consumer Products Limited
- The Republic of Tea
- Bigelow Tea
- Harney and Sons Fine Teas
- Dilmah Ceylon Tea Company PLC
- Unilever PLC
- PepsiCo, Inc.
- Kirin Beverage Company, Limited
- CHAGEE Holdings Limited
- Nongfu Spring Co., Ltd.
- Tingyi Holding Corp.
- Uni-President Enterprises Corporation
- DAVIDsTEA Inc.
- Rare Tea Company Limited
- PEET’S COFFEE, Inc.
Recent Industry Developments in Oolong Tea Market
- November 2026: Tealive launched its Sparkling Prebiotic Tea Soda range in Malaysia, including Apple Lemon Oolong and Lychee Oolong variants in can format. The range was positioned as Malaysia’s first sparkling prebiotic tea soda without artificial coloring and marked Tealive’s first move into packaged RTD products beyond its café-based business.
- August 2026: Bain Capital announced the acquisition of Gong cha Global, a tea chain with nearly 2,200 stores across 33 markets serving over 150 million beverages annually, from TA Associates. The transaction is expected to close in Q4 2026 and positions Gong cha’s oolong-based beverage platform for international expansion under a franchise model.
- May 2026: Yeo Hiap Seng introduced Yeo’s Unsweetened Oolong Tea in Singapore as part of its no-sugar range. The product received Nutri Grade A and the Healthier Choice Symbol. The launch took place alongside Singapore HeritageFest 2026, connecting the product with a cultural event focused on heritage Asian tea formats.
Global Oolong Tea Market Report Scope
The Oolong Tea Market refers to the market for tea produced from the leaves of the Camellia sinensis plant through a partial oxidation process, positioning it between green and black tea in terms of oxidation level, flavor, and processing characteristics. By form, the market is segmented into leaf tea and CTC (crush/tear/curl) tea. By category, the market is divided into conventional tea and organic tea. By flavor, the market is segmented into unflavored and flavored products. By packaging type, the market is divided into boxes, bags, pouches, sachets, and other packaging types. By distribution channel, the market is segmented into off-trade and on-trade channels, with off-trade further divided into supermarkets/hypermarkets, convenience/grocery stores, online retail stores, and other distribution channels. Geographically, the market covers North America, Europe, Asia-Pacific, South America, and the Middle East and Africa, with country-level coverage across major markets, including the United States, Canada, Mexico, Germany, the United Kingdom, Italy, France, Spain, the Netherlands, Poland, Belgium, Sweden, China, India, Japan, Australia, Indonesia, South Korea, Thailand, Singapore, Brazil, Argentina, Colombia, Chile, Peru, South Africa, Saudi Arabia, the United Arab Emirates, Nigeria, Egypt, Morocco, and Turkey, along with the respective regional rest-of-country categories. Market size and growth forecasts are presented in terms of value (USD).
Segmentation Overview
| Leaf Tea |
| CTC (Crush/Tear/Curl) Tea |
| Conventional Tea |
| Organic Tea |
| Unflavored |
| Flavored |
| Box |
| Bag |
| Pouch |
| Sachets |
| Other Packaging Type |
| Off-Trade | Supermarkets/Hypermarkets |
| Convenience/Grocery Stores | |
| Online Retail Stores | |
| Other Distribution Channels | |
| On-Trade |
| North America | United States |
| Canada | |
| Mexico | |
| Rest of North America | |
| Europe | Germany |
| United Kingdom | |
| Italy | |
| France | |
| Spain | |
| Netherlands | |
| Poland | |
| Belgium | |
| Sweden | |
| Rest of Europe | |
| Asia-Pacific | China |
| India | |
| Japan | |
| Australia | |
| Indonesia | |
| South Korea | |
| Thailand | |
| Singapore | |
| Rest of Asia-Pacific | |
| South America | Brazil |
| Argentina | |
| Colombia | |
| Chile | |
| Peru | |
| Rest of South America | |
| Middle East and Africa | South Africa |
| Saudi Arabia | |
| United Arab Emirates | |
| Nigeria | |
| Egypt | |
| Morocco | |
| Turkey | |
| Rest of Middle East and Africa |
| By Form | Leaf Tea | |
| CTC (Crush/Tear/Curl) Tea | ||
| By Category | Conventional Tea | |
| Organic Tea | ||
| By Flavor | Unflavored | |
| Flavored | ||
| By Packaging Type | Box | |
| Bag | ||
| Pouch | ||
| Sachets | ||
| Other Packaging Type | ||
| By Distribution Channel | Off-Trade | Supermarkets/Hypermarkets |
| Convenience/Grocery Stores | ||
| Online Retail Stores | ||
| Other Distribution Channels | ||
| On-Trade | ||
| By Geography | North America | United States |
| Canada | ||
| Mexico | ||
| Rest of North America | ||
| Europe | Germany | |
| United Kingdom | ||
| Italy | ||
| France | ||
| Spain | ||
| Netherlands | ||
| Poland | ||
| Belgium | ||
| Sweden | ||
| Rest of Europe | ||
| Asia-Pacific | China | |
| India | ||
| Japan | ||
| Australia | ||
| Indonesia | ||
| South Korea | ||
| Thailand | ||
| Singapore | ||
| Rest of Asia-Pacific | ||
| South America | Brazil | |
| Argentina | ||
| Colombia | ||
| Chile | ||
| Peru | ||
| Rest of South America | ||
| Middle East and Africa | South Africa | |
| Saudi Arabia | ||
| United Arab Emirates | ||
| Nigeria | ||
| Egypt | ||
| Morocco | ||
| Turkey | ||
| Rest of Middle East and Africa | ||
Key Questions Answered in the Report
What is the forecast growth rate for oolong tea through 2032?
The category is forecast to grow at a 6.12% CAGR from 2027 to 2032 and reach USD 1.07 billion by 2032. Growth is supported by premium loose-leaf demand, convenient RTD formats, flavored products, and wider access through online specialty retail.
Which oolong tea format has the largest share?
Leaf Tea leads by form with 78.5% share in 2026. Its position reflects its connection with ceremonial use, premium loose-leaf preparation, and products sold with detailed information on origin, harvest, cultivar, and handling.
Which oolong category is growing fastest?
Organic Tea is the fastest-growing category, with an 8.2% CAGR forecast through 2032. It benefits from wellness demand, ethical sourcing expectations, and buyers seeking traceable farming and import documentation.
Which channel is expected to expand fastest for oolong tea?
On-Trade is forecast to grow at an 8.1% CAGR through 2032. Specialty cafés, hotels, and bubble tea chains offer consumers a chance to try oolong drinks, which can later support packaged tea purchases through retail and online channels.