Market Overview
| Study Period | 2021 - 2031 |
|---|---|
| Forecast Data Period | 2026 - 2031 |
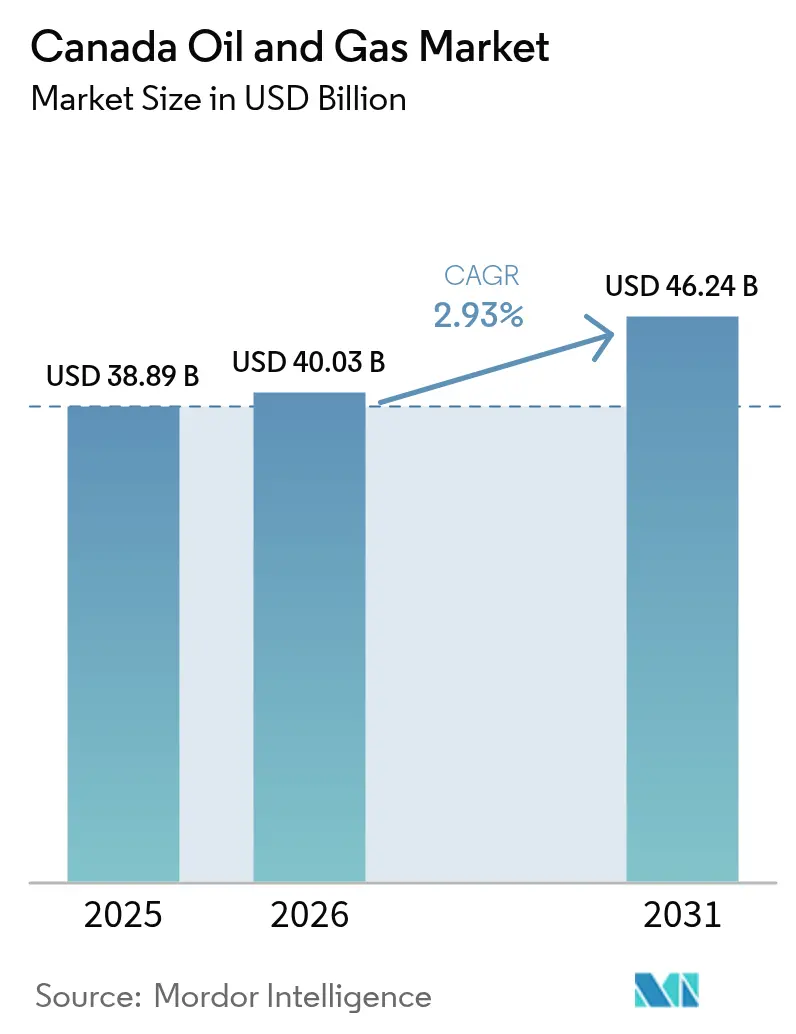
| Base Year Market Size (2025) | USD 38.89 Billion |
| Market Size (2026) | USD 40.03 Billion |
| Market Size (2031) | USD 46.24 Billion |
| Growth Rate (2026 - 2031) | 2.93% CAGR |
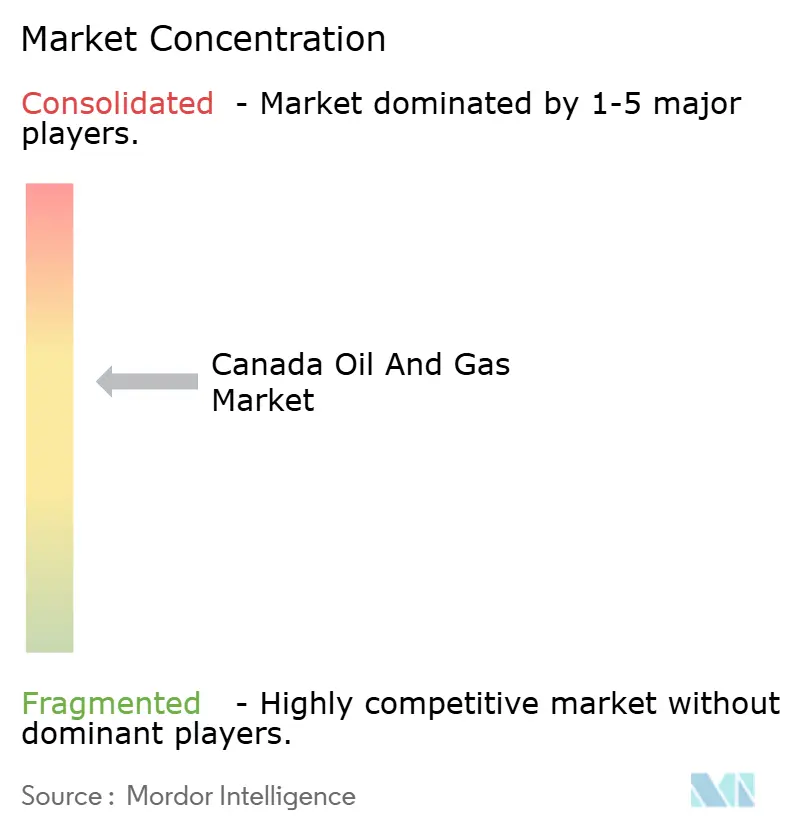
| Market Concentration | Medium |
Major Players *Disclaimer: Major Players sorted in no particular order Image © Mordor Intelligence. Reuse requires attribution under CC BY 4.0. | |
Canada Oil And Gas Market Analysis by Mordor Intelligence
The Canada Oil And Gas Market size was valued at USD 38.89 billion in 2025 and estimated to grow from USD 40.03 billion in 2026 to reach USD 46.24 billion by 2031, at a CAGR of 2.93% during the forecast period (2026-2031).
Rising pipeline capacity, new LNG export infrastructure, and steady investment in carbon-reduction technologies underpin this advance, helping the Canada oil and gas market maintain momentum despite policy uncertainty. Upscaling of oil-sands throughput, completion of the Trans Mountain Expansion (TMX) pipeline, and the imminent start-up of LNG Canada have structurally widened export routes and improved price realizations. Capital discipline remains tight, yet 2024 investments rose to USD 40.6 billion as operators prioritized brownfield developments, digital optimization, and CCUS deployment. High-impact consolidation, illustrated by a USD 6.5 billion oil-sands asset purchase by Canadian Natural Resources, is redrawing competitive boundaries while protecting margins in the Canada oil and gas market.
Key Report Takeaways
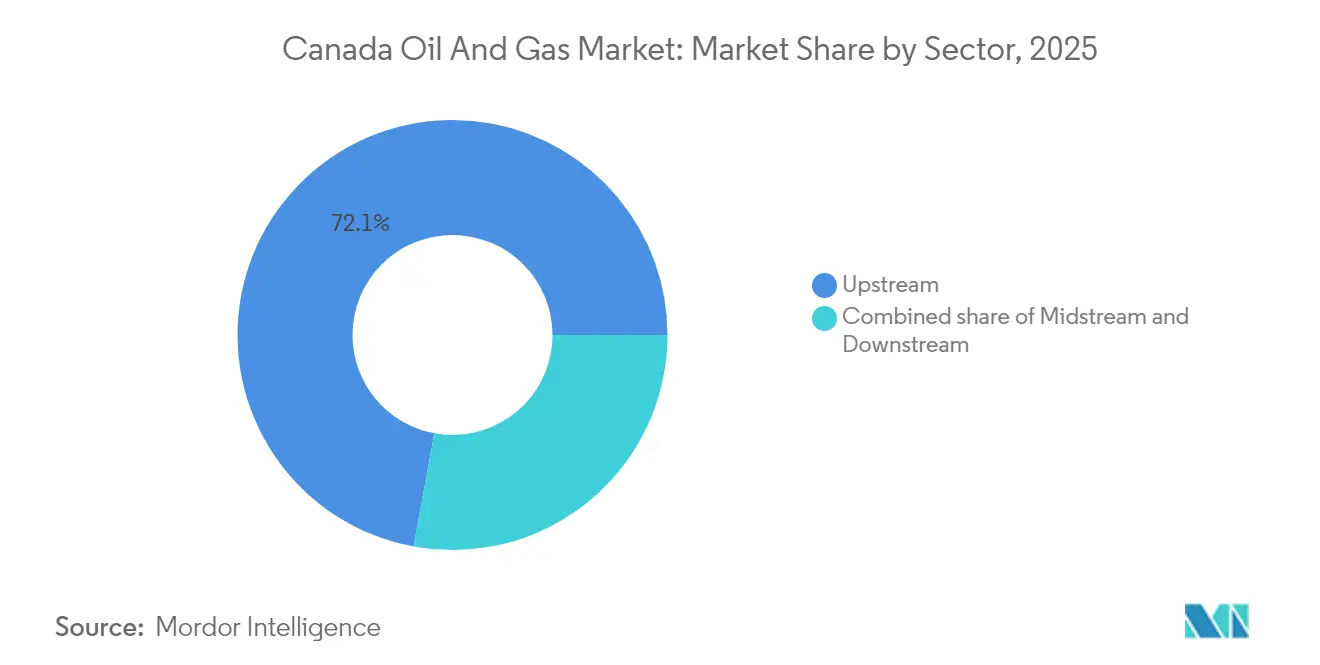
- By sector, upstream operations captured 72.10% of Canada's oil and gas market share in 2025, while midstream recorded the fastest expansion at a 3.32% CAGR through 2031.
- By location, onshore assets held 64.60% of Canada's oil and gas market size in 2025, yet offshore developments are advancing at a 5.05% CAGR to 2031.
- By service, construction accounted for 52.10% of Canada's oil and gas market size in 2025, while decommissioning is forecast to grow at a 6.22% CAGR through 2031.
Note: Market size and forecast figures in this report are generated using Mordor Intelligence’s proprietary estimation framework, updated with the latest available data and insights as of 2026.
Canada Oil And Gas Market Trends and Insights
Drivers Impact Analysis*
| Driver | (~) % Impact on CAGR Forecast | Geographic Relevance | Impact Timeline |
|---|---|---|---|
| Record-high oil-sands throughput | 0.60% | Alberta; spill-over to Saskatchewan | Medium term (2-4 years) |
| Trans Mountain (TMX) export capacity uplift | 0.50% | Western Canada; British Columbia ports | Short term (≤ 2 years) |
| LNG Canada start-up & Western gas re-rating | 0.40% | British Columbia core; Alberta supply chain | Medium term (2-4 years) |
| Clean-economy investment-tax-credits for CCUS | 0.30% | Alberta and Saskatchewan oil-sands regions | Long term (≥ 4 years) |
| Indigenous equity partnerships accelerating project approvals | 0.20% | National; early gains in B.C. and Alberta | Medium term (2-4 years) |
| AI-enabled predictive maintenance lowering OPEX | 0.10% | National production hubs | Long term (≥ 4 years) |
| Source: Mordor Intelligence | |||
Record-high Oil-sands Throughput
Oil-sands output climbed to 1.58 million BOE/d at Canadian Natural Resources and 853,000 bbl/d at Suncor in Q1 2025, reinforcing Alberta’s 58% share of national crude volumes.(1)Government of Canada, “Deputy Prime Minister Welcomes $2 Billion Partnership Between Canada Growth Fund and Strathcona Resources,” canada.ca Facility debottlenecking and solvent-assisted extraction technology are driving higher recoveries, widening cash margins as the Canadian oil and gas market taps resilient global demand for secure supply. Additional brownfield debottlenecking projects are scheduled through 2030, enhancing long-term baseline production without incurring extensive risks associated with greenfield investments.
Trans Mountain (TMX) Export Capacity Uplift
The TMX expansion tripled capacity to 890,000 bbl/d and shrank the WCS-WTI differential below USD 13/bbl, lifting producer netbacks and enhancing the Canada oil and gas market’s pricing power.(2)Suncor Energy Inc., “Suncor Energy Reports First Quarter 2025 Results,” suncor.com Early volumes are being shipped to Asia-Pacific refiners via the Westridge terminal, validating the strategic diversification away from U.S. mid-continent refineries. Forward curves indicate sustained basis tightening, driving capital reallocation toward higher-margin oil-sands expansions that are already underway.
LNG Canada Start-up & Western Gas Re-rating
The commissioning of LNG Canada's 14 mtpa Phase 1 in 2025 marks a long-sought egress for western gas, ending the chronic AECO discounting that has weighed on the Canadian oil and gas market.(3)Offshore Technology, “LNG Canada Development Running on Schedule,” offshore-technology.com Tourmaline expects a Q4 2025 price uplift linked to first cargos, and parallel projects such as Cedar LNG and the USD 1 billion Yellowhead Mainline pipeline are designed to triple LNG export capacity by 2030. Gas-focused producers are recalibrating their drilling programs to focus on British Columbia's liquids-rich acreage, which offers favourable netbacks.
Clean-economy Investment-tax-credits for CCUS
Investment tax credits covering up to 60% of eligible CCUS outlays have unlocked USD 1 billion in Growth Fund commitments to Strathcona Resources and CAD 24.5 billion in oil-sands alliance spending through 2030. The incentives enhance project economics, enabling companies to decarbonize while maintaining throughput, a balancing act crucial to the competitiveness of the Canadian oil and gas market.
Restraints Impact Analysis*
| Restraint | (~) % Impact on CAGR Forecast | Geographic Relevance | Impact Timeline |
|---|---|---|---|
| Federal emissions-cap uncertainty | -0.5% | National, concentrated in Alberta and Saskatchewan oil sands regions | Medium term (2-4 years) |
| Post-2028 pipeline egress constraints | -0.4% | Western Canada, particularly Alberta production hubs and British Columbia export corridors | Long term (≥ 4 years) |
| Rising wildfire-driven insurance premiums | -0.3% | Alberta and British Columbia core, with spill-over to Saskatchewan operations | Short term (≤ 2 years) |
| Talent gap in advanced drilling & CCUS | -0.2% | National, with acute impacts in Alberta specialized drilling operations and emerging CCUS projects | Medium term (2-4 years) |
| Source: Mordor Intelligence | |||
Federal Emissions-cap Uncertainty
A pending federal cap, lacking defined compliance rules, has delayed some long-cycle capital commitments, even as 2024 capital expenditures (capex) reached USD 40.6 billion. Oil-sands operators must plan multi-decade payback periods, making regulatory clarity pivotal. Industry groups advocate harmonized policy signals to preserve the competitiveness of the Canada oil and gas market without derailing net-zero pathways.
Post-2028 Pipeline Egress Constraints
IEA projections of 680,000 bbl/d incremental Canadian crude by 2030 could outperform current spare capacity, recreating historical egress bottlenecks. While a new Pacific-route pipeline has gained “national interest” status, permitting milestones still risk slippage and could widen differentials again, pressuring realized prices in the Canada oil and gas market past 2026.
*Our forecasts treat driver/restraint impacts as directional, not additive. The impact forecasts reflect baseline growth, mix effects, and variable interactions.
Segment Analysis
By Sector: Upstream Dominance Drives Production Growth
Upstream activities accounted for 72.10% of Canada's oil and gas market size in 2025, as operators favored brownfield expansions over frontier exploration. The segment's 3.18% CAGR through 2031 reflects the rising throughput of oil-sands and Montney gas developments, which keep the Canadian oil and gas market on a steady production trajectory. Midstream revenues are increasing due to toll growth, yet capital allocation remains disciplined following the TMX and LNG Canada build-outs, ensuring returns remain accretive.
Technologies such as horizontal drilling, solvent-aided extraction, and AI-enabled maintenance have significantly improved recovery factors, underpinning USD-denominated cash flows that ensure upstream leadership within the Canadian oil and gas market. Downstream players are pivoting to renewable diesel, as illustrated by Imperial Oil's new complex, slated for completion in mid-2025, which demonstrates adaptation to low-carbon fuel regulations while leveraging integrated supply chains.


By Location: Onshore Operations Maintain Market Leadership
Onshore production retained a 64.60% slice of Canada's oil and gas market share in 2025, thanks to well-established infrastructure across Alberta, Saskatchewan, and British Columbia. Continuous infill drilling and steam-to-solvent pilots in oil-sands mining projects prolong plateau output and sustain margin visibility.
Offshore assets, notably the West White Rose extension, deliver a 5.05% CAGR to 2031, outpacing mature onshore fields on a percentage basis. Improved rig automation, ice-resistant platform design, and supportive royalty frameworks have reinvigorated Atlantic Canada prospects, bringing geographic diversification to the Canada oil and gas market without eroding onshore dominance.
By Service: Decommissioning Gains Momentum
Construction services continued to lead in 2025, accounting for 52.10% of total service revenue as crews completed large-scale projects, such as the Trans Mountain Expansion, and prepared LNG Canada for its first gas. Yet the fastest-growing sector is decommissioning, which is expanding at a 6.22% CAGR through 2031 as stricter rules and corporate climate targets prompt operators to clear legacy wells and restore aging facilities. The change signals a maturing sector that now treats site cleanup as a core line item rather than a box-ticking exercise. Large producers are setting the tone: Cenovus alone plans to retire 3,000 wells by 2025, dedicating meaningful capital to abandonment, remediation, and surface reclamation programs.
Maintenance and turnaround work provides steady demand, centering on asset integrity and day-to-day reliability across Canada’s vast network of plants, pipelines, and terminals. The segment is modernizing rapidly, with operators rolling out AI-driven predictive systems that reduce downtime and lower safety risks; field trials have cut energy use by 37% and increased oil output by 14%. As growth spending eases, service providers are sharpening capabilities in carbon-capture construction and advanced decommissioning to meet evolving rules, illustrating how the business is shifting from pure expansion to disciplined stewardship.

Geography Analysis
Western Canada accounted for 82.40% of national output in 2025, anchored by the Western Canadian Sedimentary Basin’s prolific oil-sands and liquids-rich gas deposits. Alberta’s infrastructure base, recently augmented by TMX, connects seamlessly to tidewater, raising Asia-bound exports and fortifying the Canada oil and gas market against North American bottlenecks.
British Columbia is transitioning from a transit jurisdiction to a value-adding hub as LNG Canada commences operations in 2025. The Cedar LNG partnership enhances Indigenous participation, while the planned Yellowhead Mainline pipeline ensures sustained feedstock availability for coastal liquefaction, thereby strengthening the province’s strategic position within the Canadian oil and gas market.
Atlantic Canada contributes modest volumes today but commands outsized growth potential through West White Rose’s 2026 start-up, injecting regional diversity. Saskatchewan’s light-oil belts and potash synergies provide incremental production and midstream tie-ins, keeping the province integral to future expansion pathways. National policy encourages inter-provincial collaboration, recognizing that diversified export corridors elevate the overall resilience of the Canada oil and gas market.
Regulatory Landscape
Federal oversight for interprovincial and international pipelines, energy exports and imports, and certain upstream activities is led by the Canada Energy Regulator (CER) under the Canadian Energy Regulator Act, alongside statutes such as the Canada Oil and Gas Operations Act and the Canada Petroleum Resources Act. The CER uses a board-governed structure and sets requirements covering pipeline safety, environmental protection, and facility operations, which shapes compliance for national-scale midstream systems and regulated offshore or northern activities.
For 2025-2028, operators have been tracking the CER Regulatory Framework Plan and the CER Forward Regulatory Plan as the basis for upcoming rule changes. Planned work in Spring 2026 includes drafting amendments to the Onshore Pipeline Regulations. In parallel, federal environment policy workstreams (including methane and broader greenhouse-gas initiatives referenced in Government of Canada forward regulatory planning) keep emissions-related compliance central to project design, operating practices, and long-cycle capital decisions across the Canadian oil and gas market.
Competitive Landscape
Market concentration centers on three integrated majors, Canadian Natural Resources, Suncor Energy, and Cenovus Energy, that dominate upstream barrels and orchestrate disciplined capital programs. Their combined asset scale allows procurement leverage, technology roll-outs, and dividend continuity that smaller peers struggle to match. Midstream assets exhibit natural-monopoly traits, with Enbridge, TC Energy, and Pembina Pipeline owning critical trunk lines regulated on cost-of-service models.
Strategic M&A, such as Canadian Natural’s purchase of Chevron’s Alberta portfolio and the USD 15 billion Whitecap-Veren tie-up, underscores an industry shift toward consolidation to harvest synergies and sustain the competitiveness of the Canadian oil and gas market. Technology adoption differentiates leaders; digital twins, autonomous drilling, and CCUS megaprojects secure lower break-evens and improved ESG profiles. Indigenous equity frameworks also shape competitive positioning by expediting approvals and locking in local support.
Despite a high concentration in upstream volumes, niche E&Ps and service innovators are carving value around Montney liquids windows, CCUS integration, and AI analytics. These agile players supply specialized capabilities that complement the broader Canada oil and gas market, preventing monopolistic stasis and fostering technology exchange.
Canada Oil And Gas Industry Leaders
Canadian Natural Resources Ltd.
Suncor Energy
Cenovus Energy
Imperial Oil (Exxon subsidiary)
Enbridge Inc.
- *Disclaimer: Major Players sorted in no particular order

Market Opportunities and Future Outlook
Near-term whitespace concentrates in (i) carbon management build-out tied to oil sands competitiveness and (ii) incremental brownfield and technology-led debottlenecking that increases throughput without introducing new greenfield megaproject risk. A key proof point is the Pathways Project Carbon Capture Initiative, where a July 2026 federal-provincial announcement formalized the initiative around a 16 million tonnes per year emissions-reduction objective. That framing creates tangible demand for capture equipment, CO2 gathering and compression, storage appraisal, and related engineering and construction services across Alberta oil sands hubs. This is reinforced by the availability of clean-economy investment tax credits for CCUS cited in the report context, which improves project economics and supports a larger pipeline of investable carbon infrastructure.
A second opportunity area is operational technology that improves heavy oil and oil sands recovery and lowers emissions intensity. In April 2026, Emissions Reduction Alberta published field validation results for NanosTechs In-situ Upgrading Technology (ISUT), reporting up to 50% production increases and 30% GHG emissions reduction in heavy oil extraction. On the supply side, brownfield-led capital programs are adding visibility for services and equipment, and Canadian Natural Resources Limited outlined a 2026 capital budget of USD 6.3 billion (including dedicated carbon capture spending). Execution milestones such as Strathcona Resources achieving first steam at Meota Central on June 6, 2026 also support continued thermal and optimization work in Western Canada. Together, these developments are directing spending toward emissions-reducing infrastructure and productivity upgrades across upstream and midstream systems. Separately, new west coast pipeline project workstreams referenced in the Major Projects Office add a permitting and routing track that could reshape future egress options if advanced through approvals.
Recent Industry Developments
- July 2026: The Pathways Alliance companies (including Canadian Natural Resources, Suncor Energy, Cenovus Energy, Imperial Oil, and ConocoPhillips) signed an agreement framework with the governments of Alberta and Canada to advance the Pathways carbon capture and storage project. The agreement framework formalized public-sector alignment around a shared CO2 transportation and storage concept, tightening the link between long-life oil sands operations and investable decarbonization infrastructure.
- May 2026: Suncor Energy updated its 2026 outlook, including refinery utilization guidance of 90% to 93%, and disclosed a higher refining network nameplate capacity of 511,000 barrels per day. The update highlights continued focus on downstream reliability and throughput optimization, supporting product supply resilience and helping integrated players balance upstream volatility with refining cash flows.
- July 2025: Canada Growth Fund partnered with Strathcona Resources on up to USD 2 billion of CCUS infrastructure targeting 2 million tCO2 per year of capture. The partnership strengthened the financing pathway for carbon capture build-out in Western Canada and backed a repeatable model for pairing public capital with operator-led emissions reduction projects.


Research Methodology Framework and Report Scope
Market Definition and Coverage
For this report, the Canada oil and gas market is sized as the value generated from upstream, midstream, and downstream activity within Canada across oil and natural gas, measured in USD for consistent comparison over time.
Scope exclusions: Retail fuel sales margins at the point of sale, downstream petrochemicals outside core refining, and non-hydrocarbon renewables are not counted in this market value.
Segmentation Overview
- By Sector
- Upstream
- Midstream
- Downstream
- By Location
- Onshore
- Offshore
- By Service
- Construction
- Maintenance and Turn-around
- Decommissioning
Data Sources, Market Sizing, and Validation
Desk Research
Desk work starts with building a clean fact base on Canada production, trade flows, and infrastructure, because these signals define the boundaries for what can realistically be produced, moved, and processed. We referenced public sources such as Statistics Canada releases, the Canada Energy Regulator, Natural Resources Canada, and the International Energy Agency, which helped ground the time series on liquids and gas.
To translate those operating signals into value, we also reviewed sources such as provincial regulator publications, industry association dashboards, and investor materials like annual reports and technical disclosures that describe project timelines and operating conditions. Where company-level financial context was needed, we used paid subscriptions limited to company financials and news intelligence, and we also checked patent databases for directional technology activity when it impacted costs or recovery. The sources listed here are illustrative, and we also used other public documents and data tables for data collection, validation, and clarification.
Primary Interviews and Surveys
Fieldwork was used to test whether the desk assumptions match what is happening across producing basins, pipeline corridors, and refining hubs. We spoke with a mix of operators, midstream and service participants, and domain specialists who could comment on throughput, maintenance cycles, and contracting patterns. We then used surveys to recheck sensitive inputs such as utilization and near-term price pass-through.
Distribution of primary research fieldwork respondents
| Company type | Respondent position | Region |
|---|---|---|
| Top tier: 29% | CXOs: 12% | |
| Mid tier: 56% | Functional/Unit leaders: 40% | |
| Smaller Players: 15% | Managers: 48% |
Market-Sizing & Forecasting
Sizing starts with a top-down build where production, processing, and transport series are reconstructed from official Canadian energy statistics, then value is derived using consistent pricing and service cost relationships for the sector. The totals are corroborated with selective bottom-up checks, such as sample company revenue disclosures, supplier and contractor rate cards, and a few volume times average realized price calculations that help detect drift in the model.
Inputs used in the model include crude and natural gas production volumes, pipeline and terminal throughput, refinery capacity and utilization, upstream capital spending direction, and benchmark price spreads that influence realized revenue in Canada. For the forecast, scenario analysis is used so oil price, gas price, utilization, and project timing can be flexed within realistic bands agreed during interviews. The final path is selected based on what most experts considered achievable. When bottom-up reference points were missing for smaller operations, we filled gaps using peer averages and capacity-based proxies, then rechecked them against national totals.
Data Validation & Update Cycle
Validation is done in a few passes so that both obvious and non-obvious errors are caught before numbers are finalized. We compare model outputs against independent signals like production and export trends, announced project start dates, and changes in capacity utilization, then investigate large variances with follow-up checks.
Anomalies trigger rework of assumptions. If the driver is not clearly visible in public data, we re-contact experts to confirm what changed and when it started. Each report is refreshed annually, and interim updates are made when material events affect pricing, volumes, or infrastructure operations. Before delivery, a final review pass is completed so clients receive the latest updated view.
Mordor Intelligence's Canada Oil and Gas Market Sizing Compared With Other Published Estimates
Different sources often show different market sizes for Canada oil and gas, and the difference usually comes down to what is included in the value pool and how price and volume are linked. Timing also matters because sector revenue can swing quickly when benchmark prices move, even if physical volumes are stable.
By tracking throughput and utilization signals and then refreshing price and cost assumptions with expert checks, Mordor Intelligence keeps the Canada total tied to operating activity rather than broader GDP contribution style measures or expanded energy definitions.
Benchmark comparison
| Source | Market Size | Gaps in Research Methodology |
|---|---|---|
| Mordor Intelligence | USD 40.03 B (2026) | |
| Global Consultancy A | USD 60.00 B (2024) | This estimate is based on an earlier base year and appears to use a broader value pool that can fold in wider sector revenue linkages, which lifts the total versus an activity-traced model tied to current operating volumes. |
| Industry Publisher B | USD 71.00 B (2024) | The number is presented as a single headline value and is framed around macro contribution signals, which can mix indirect effects and price spikes, thereby overstating the core oil and gas activity value captured by production, throughput, and processing checks. |
The table shows that the spread is mainly explained by scope and the valuation anchor used for converting activity into USD, rather than a disagreement on Canada having a large oil and gas sector. When the model is tied to production, transport, and refining indicators, and assumptions are rechecked during validation, the resulting market size is easier to reproduce and to update when prices or utilization change.


Key Questions Answered in the Report
What is the current value of the Canada oil and gas market?
The Canada oil and gas market size was USD 40.03 billion in 2026 and is projected to grow at a 2.93% CAGR to USD 46.24 billion by 2031.
Which segment holds the largest Canada oil and gas market share?
Upstream operations dominated with 72.10% of Canada oil and gas market share in 2025, driven by record oil-sands throughput.
How will LNG Canada affect western Canadian natural gas pricing?
Once operational in 2025, LNG Canada’s 14 mtpa capacity is expected to reduce AECO discounts by opening premium Asian export channels, improving gas producer netbacks.
What role do Indigenous partnerships play in project approvals?
Projects with Indigenous equity, such as Cedar LNG’s 50.1% Haisla Nation ownership, receive faster regulatory clearance and stronger social licence, shortening approval timelines.
How are CCUS incentives influencing investment decisions?
Federal tax credits covering up to 60% of CCUS costs have unlocked billions in private funding, with initiatives like Strathcona Resources’ capture projects set to sequester 2 million tCO₂ annually.
What risks could restrain future growth of the Canada oil and gas market?
Key risks include policy uncertainty around federal emissions caps and the possibility of renewed pipeline constraints after 2028 if additional capacity is not sanctioned in time.
Page last updated on:


