North America Same Day Delivery Market Size and Share
Market Overview
| Study Period | 2018 - 2031 |
|---|---|
| Forecast Data Period | 2026 - 2031 |
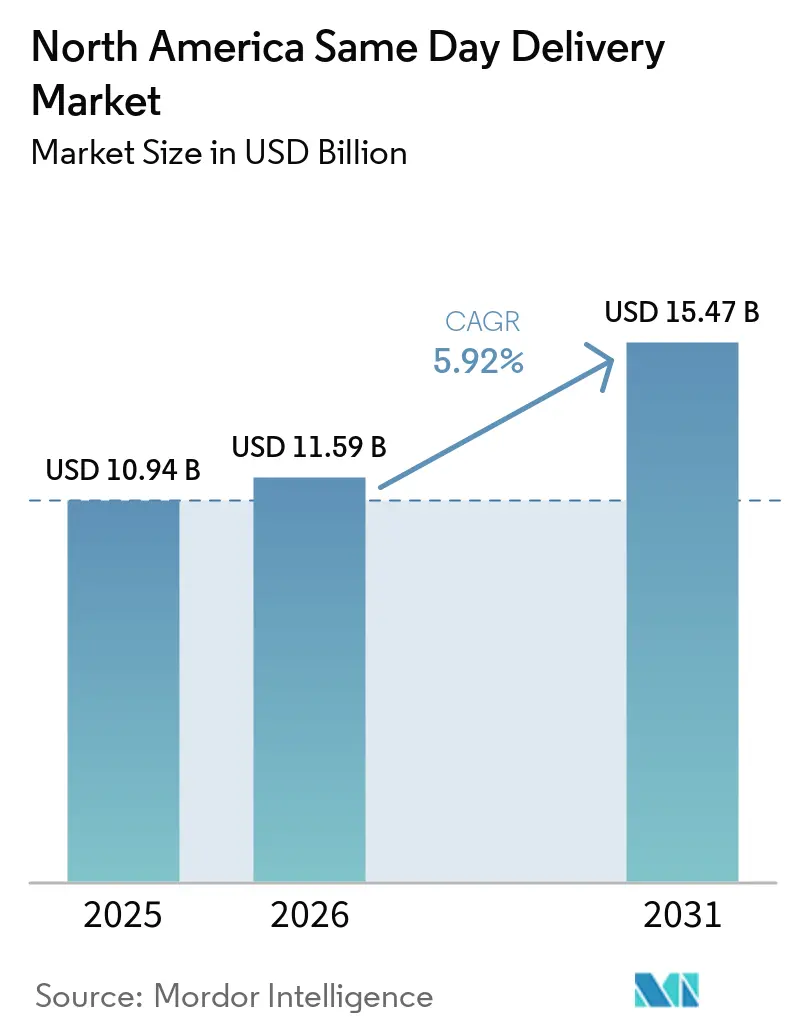
| Base Year Market Size (2025) | USD 10.94 Billion |
| Market Size (2026) | USD 11.59 Billion |
| Market Size (2031) | USD 15.47 Billion |
| Growth Rate (2026 - 2031) | 5.92% CAGR |
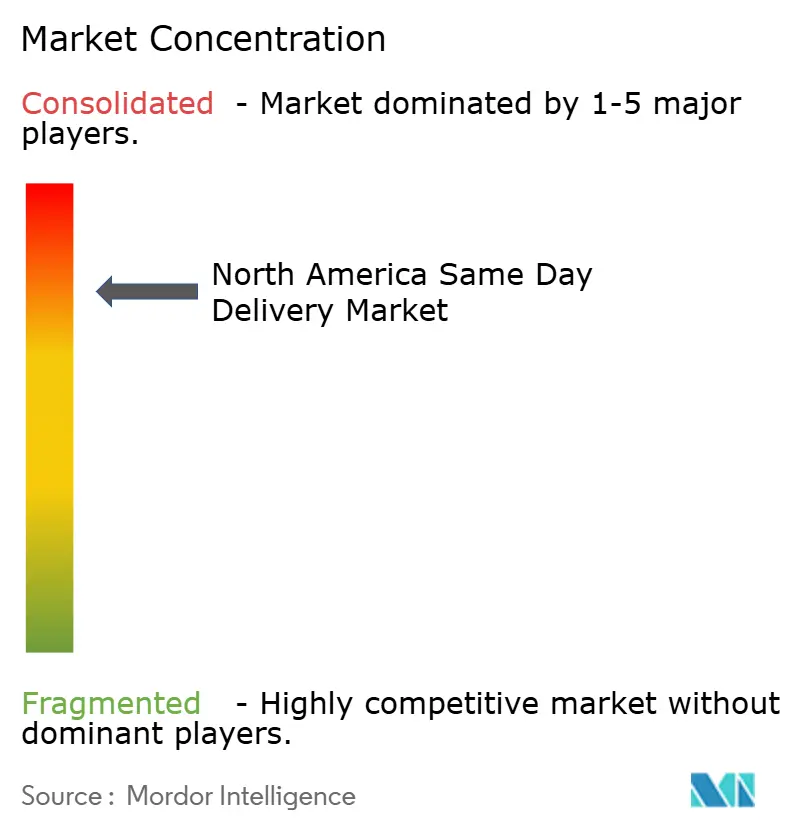
| Market Concentration | High |
Major Players *Disclaimer: Major Players sorted in no particular order Image © Mordor Intelligence. Reuse requires attribution under CC BY 4.0. | |
North America Same Day Delivery Market Analysis by Mordor Intelligence
The North America same day delivery market size was valued at USD 10.94 billion in 2025 and estimated to grow from USD 11.59 billion in 2026 to reach USD 15.47 billion by 2031, at a CAGR of 5.92% during the forecast period (2026-2031). The momentum comes from consumers who now treat sub-24-hour fulfillment as the norm rather than a premium add-on, a behavioral shift forged during the pandemic. Investments in urban micro-fulfillment centers made during 2020-2021 have permanently lowered delivery lead times, allowing retailers to promise arrival within four hours in most tier-one cities. Competitive pressure from private retail networks, especially Amazon, continues to reshape market economics as large shippers vertically integrate last-mile assets. Meanwhile, state-level zero-emission mandates are accelerating fleet electrification, positioning electric vans and two-wheeled robots as cost shields against rising congestion fees. Structural headwinds remain in the form of acute driver shortages and tariff-driven equipment cost inflation, yet technological levers such as AI-powered route optimization have begun to offset a portion of these pressures.
Key Report Takeaways
- By mode of transport, road networks held 50.41% of the North America same day delivery market share in 2025, while air shipments are forecast to advance at a 6.01% CAGR between 2026-2031.
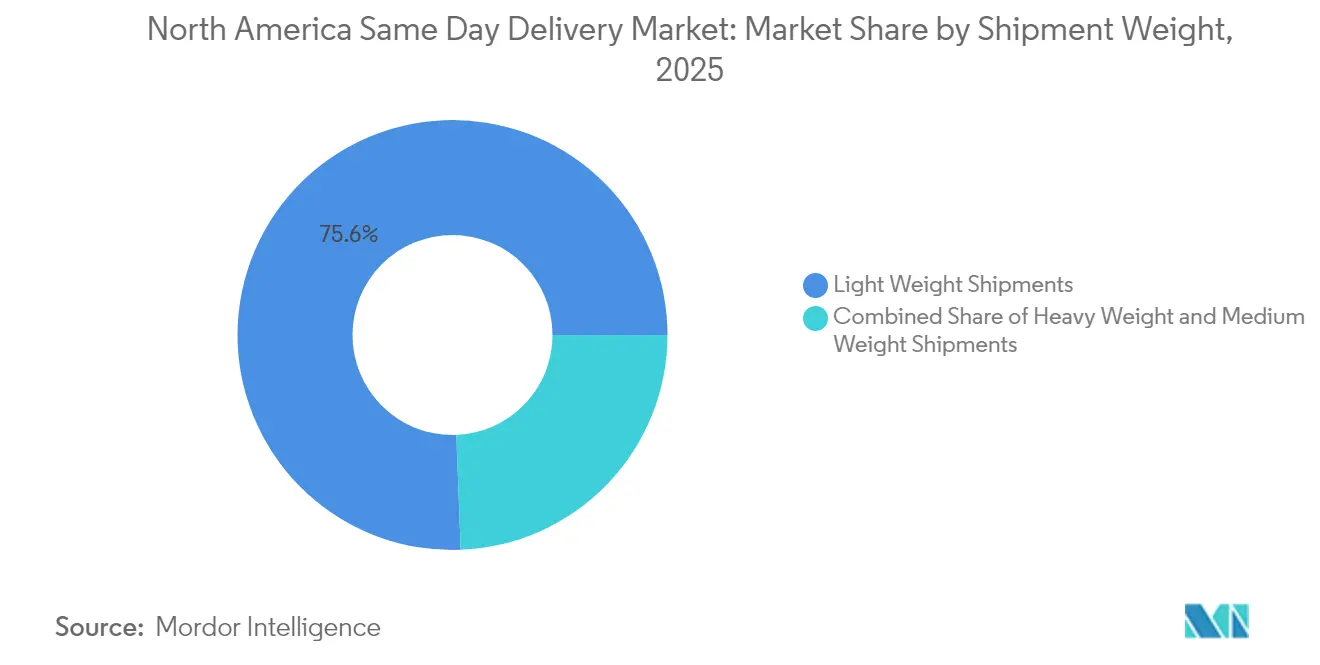
- By shipment weight, light parcels accounted for 75.61% share of the North America same day delivery market size in 2025 and medium-weight consignments are expanding at a 5.58% CAGR between 2026-2031.
- By destination, domestic deliveries led with 78.55% share in 2025; international routes are projected to grow at a 6.12% CAGR between 2026-2031.
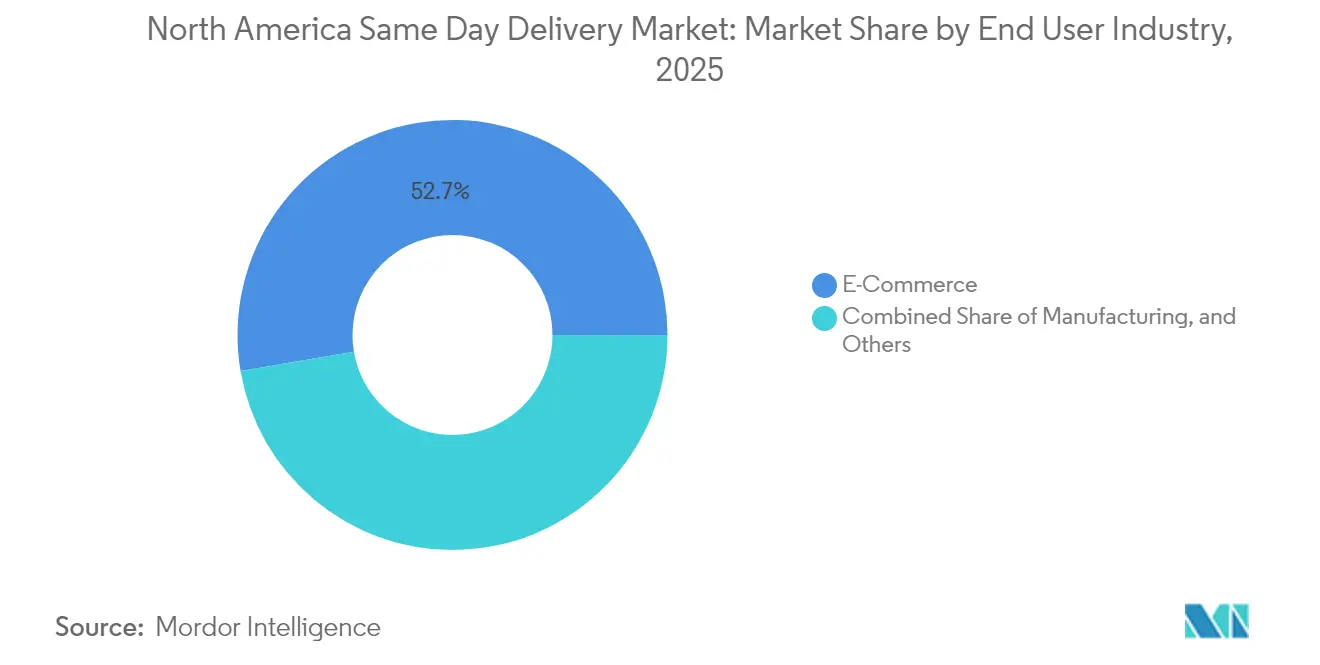
- By end-user industry, e-commerce commanded 52.68% revenue share in 2025, whereas offline wholesale and retail trade is on track for a 6.04% CAGR between 2026-2031.
- By country, the United States contributed 89.62% of regional revenue in 2025, but Mexico is the fastest riser at a 7.52% CAGR between 2026-2031.
Note: Market size and forecast figures in this report are generated using Mordor Intelligence’s proprietary estimation framework, updated with the latest available data and insights as of 2026.
North America Same Day Delivery Market Trends and Insights
Drivers Impact Analysis*
| Driver | (~) % Impact on CAGR Forecast | Geographic Relevance | Impact Timeline |
|---|---|---|---|
| Explosive B2C e-commerce volumes post-COVID-19 | +1.8% | United States and Canada core, Mexico emerging | Medium term (2-4 years) |
| Retailers deploying micro-fulfillment and ship-from-store networks | +1.2% | Urban centers across North America | Short term (≤ 2 years) |
| AI-driven route optimization cutting last-mile costs | +0.9% | U.S. metropolitan areas | Medium term (2-4 years) |
| Boom in quick-commerce grocery and food platforms | +0.7% | Dense urban corridors | Short term (≤ 2 years) |
| Same-day prescription-delivery mandates by U.S. payors | +0.5% | 49 U.S. states | Long term (≥ 4 years) |
| State carbon-pricing accelerating EV/robot fleets | +0.4% | California, Washington | Long term (≥ 4 years) |
| Source: Mordor Intelligence | |||
Explosive B2C E-Commerce Volumes Post-COVID-19
U.S. parcel throughput hit 23.4 billion in 2024 equal to 70 packages per resident and the surge has locked same-day expectations into the mainstream. Amazon alone is pouring USD 4 billion into rural station build-outs to bring four-hour delivery to 13,000 ZIP codes, widening geographic coverage of rapid fulfillment. Canadian grocery platforms mirror this shift, with third-party apps favored by 54% of consumers and sector revenue on pace for USD 28.6 billion by 2030. These volumes create a predictable, high-density order flow that underpins network utilization and capex returns, even as carriers battle margin compression[1]“70 Battery Electric Trucks Added to Local Fleets,” South Coast Air Quality Management District, aqmd.gov.
Retailers Deploying Micro-Fulfillment and Ship-from-Store Networks
Big-box chains are repurposing store backrooms into automated micro-fulfillment hubs, placing inventory within 10 miles of most urban shoppers. Walmart and Target have already rolled out robotics-enabled storage grids that trim picking times and repurpose store labor during off-peak periods. The model reduces reliance on distant distribution centers and enhances supply-chain resiliency by dispersing inventory risk. As a result, brick-and-mortar footprints have flipped from perceived liabilities to strategic assets, intensifying competition with pure-play e-commerce rivals[2]“Canada's Food Delivery Market: What to Expect in 2025,” Deliverect, deliverect.com.
AI-Driven Route Optimization Cutting Last-Mile Costs
Platforms such as Shipium ingest real-time traffic, weather, and driver capacity to recompute delivery promises every few minutes, lowering last-mile costs by up to 25%. Predictive demand algorithms stage inventory in micro-hubs hours before orders arrive, raising first-attempt delivery success and curbing fuel spend. The savings are helping offset wage inflation and congestion tolls, keeping the North America same day delivery market economically viable for low-margin merchandise categories.
Boom in Quick-Commerce Grocery and Food Delivery Platforms
Fifteen-minute grocery propositions seeded in 2023 have achieved sufficient order density in New York, Toronto, and Los Angeles to break even on mature routes. Dark stores stock fewer than 2,000 SKUs but turn inventory eight times weekly, minimizing spoilage while meeting ultra-fast expectations. Traditional grocers have responded by partnering with or acquiring quick-commerce specialists, accelerating consolidation while broadening consumer choice.
Restraints Impact Analysis*
| Restraint | (~) % Impact on CAGR Forecast | Geographic Relevance | Impact Timeline |
|---|---|---|---|
| Driver shortages and escalating labor costs | −1.1% | North America-wide, acute in cities | Short term (≤ 2 years) |
| Urban congestion fees and curb-management penalties | −0.8% | Major metropolitan areas | Medium term (2-4 years) |
| FAA delays on BVLOS drone approvals | −0.6% | United States, spillover to Canada | Long term (≥ 4 years) |
| 2025 U.S. tariffs inflating van component prices | −0.4% | U.S. with cross-border impacts | Short term (≤ 2 years) |
| Source: Mordor Intelligence | |||
Driver Shortages and Escalating Labor Costs
Thirty-eight percent of North American logistics firms report severe driver scarcity, pushing companies to raise wages, bonuses, and flexible-schedule perks to keep seats filled. Gig-economy platforms have softened the blow but introduce quality-control and insurance complications that elevate per-delivery costs. Automation investments from parcel-sorting robotics to larger route territories enabled by AI are now essential to sustain service levels amid talent constraints[3]“Zero-Emission Truck Insights,” University of California Institute of Transportation Studies, escholarship.org.
Urban Congestion Fees and Curb-Management Penalties
New York’s congestion charge surpasses USD 9 per commercial entry, and other cities are following suit, piling direct costs onto last-mile operators. Simultaneously, stricter curb-use rules lengthen walking distances from parked vans to doorsteps, raising dwell times and hourly labor costs. Exemptions for electric vehicles are nudging carriers toward faster EV fleet uptake, yet upfront capital outlays and charging logistics remain hurdles[4]“Shifting fortunes in parcel delivery continue to redraw the landscape,” DC Velocity, dcvelocity.com.
*Our forecasts treat driver/restraint impacts as directional, not additive. The impact forecasts reflect baseline growth, mix effects, and variable interactions.
Segment Analysis
By End User Industry: E-Commerce Leads, Offline Retail Accelerates
E-commerce platforms maintained a 52.68% hold on 2025 revenue as shoppers expect doorstep delivery within hours for everyday needs, from apparel to electronics. Wholesale and retail trade (offline) is the breakout, slated for a 6.04% CAGR between 2026-2031 as brick-and-mortar chains weaponize local inventory via ship-from-store models that mimic pure-play speed without the real-estate drag.
Healthcare’s policy-driven requirement for same-day prescription fulfillment is adding controlled-temperature and chain-of-custody complexity, carving out premium service niches for certified couriers. Financial-services clients, meanwhile, continue to pay top dollar for secure, time-stamped document movement. Across sectors, route-density economics dictate that the North America same day delivery market increasingly relies on a mixed basket of consumer and enterprise demand to maintain efficiency.


By Destination: Domestic Deliveries Anchor Market, International Gains Momentum
Domestic routes captured 78.55% share in 2025, reflecting streamlined documentation and the absence of customs holds that can derail a same-day clock. Yet cross-border lanes are heating up; international volumes are forecast to climb at a 6.12% CAGR between 2026-2031 on the back of rising U.S.–Mexico near-shoring trade.
Trade value between both nations surpassed USD 475.6 billion in 2024, feeding demand for expedited components that traverse the border multiple times during assembly cycles. Infrastructure upgrades, such as DSV’s 900,000 sq ft automated hub in Laredo, are designed to punch customs dwell time below the one-hour mark, a crucial threshold for reliable same-day service. Political harmonization under USMCA provides a regulatory tailwind, though cargo-theft risks and security escorts inflate insurance premiums on certain corridors.
By Shipment Weight: Light Parcels Drive Volume, Medium Weight Shows Promise
Light parcels generated 75.61% of North America same day delivery market revenue in 2025, underscoring consumer appetite for split-basket e-commerce orders. Standardized carton sizes and conveyor-friendly weights translate to high sortation throughput and dense urban routing that keep per-stop costs manageable. Medium-weight shipments, while only a quarter of volume, are the growth story with a 5.58% CAGR between 2026-2031 as manufacturers and office suppliers migrate toward just-in-time replenishment.
This weight-band shift is pushing carriers to invest in load-bearing shelves and ergonomic equipment to protect drivers from injury while meeting same-day promises. Heavy-weight categories remain a niche for emergency industrial parts and large home goods, where premiums cover white-glove handling. As AI matchmaking of truck cubic-space and order profiles improves, medium-weight consignments are expected to win more same-day coverage, tightening utilization curves and inching margins higher.
By Mode of Transport: Road Networks Dominate Despite Air’s Speed Advantage
Road transport held the largest slice of the North America same day delivery market share at 50.41% in 2025. Extensive interstate highways, flexible routing, and mature delivery-van fleets combine to keep ground costs lower than any air alternative. Air solutions, however, are scaling quickly; the segment’s 6.01% CAGR between 2026-2031 reflects mounting demand for four-hour intercity delivery of high-value pharmaceuticals and electronics.
Air expansion remains tethered to regulatory progress on autonomous drones and urban air-mobility corridors. Once BVLOS approvals broaden, cost-per-mile economics could narrow the gap with road-based vans, particularly on suburban and rural routes where congestion adds time-value penalties to ground movement. Road operators are therefore investing in AI dispatch to maintain utilization rates, while airports and real-estate funds race to convert unused hangars into mini-sort hubs. The resulting modal mix suggests coexistence rather than displacement; shippers will cherry-pick the best speed-versus-cost option on a lane-by-lane basis.
Geography Analysis
The United States same day delivery market continues to anchor the North America market, providing 89.62% of regional value in 2025 thanks to mature carrier footprints and consumers who place a premium on speed. Amazon’s build-out of 200-plus rural stations extends four-hour coverage to an extra 1.2 million sq mi, while UPS’s network trims signal heightened focus on yield management over sheer volume. Urban congestion fees in Manhattan and forthcoming West Coast toll corridors are prompting electric-van rollouts, aided by California’s Advanced Clean Fleets mandate that forces zero-emission drayage truck adoption from 2024 forward.
South of the border, Mexico’s 7.52% CAGR between 2026-2031 underscores the allure of near-shoring. DSV and Maersk have committed close to USD 500 million in aggregate capex to automate border gateways, slimming customs latency for automotive and electronics inputs. Still, the 1-2 hour median crossing time at Laredo tempers true same-day reliability, creating a service premium that only the most sophisticated operators can command. Security remains paramount; courier fleets rely on GPS-geofencing and federal police escorts through red-zone highways, embedding risk-management costs into rate cards.
Canada, while a smaller slice, exhibits steady demand buoyed by metropolitan density in Toronto and Vancouver. The food-delivery vertical’s 7.7% CAGR to 2030 is fueling investments in refrigerated micro-hubs and multilingual customer-care centers to accommodate Quebec’s regulatory duality. Provincial clean-fuel rebates are accelerating electric van adoption, particularly for last-mile specialists targeting government sustainability contracts. Cross-border synergies with contiguous U.S. states allow carriers to amortize technology and fleet assets across both markets, albeit with bilingual labeling and customs automation adjustments.
Competitive Landscape
The North America same day delivery market gravitates toward consolidation as the top three players Amazon, UPS, and FedEx jointly command majority of the share, yet face encroachment from nimble regionals. Amazon’s vertically integrated network ships 17.1 million parcels per day, claiming 25.6% share and leveraging its retail volume to undercut third-party rates. Traditional incumbents are responding with strategic realignments; UPS’s 20,000 planned layoffs and facility consolidations aim to strip fixed costs from under-utilized suburban depots.
Technology distinguishes winners; Shipium’s AI stack chooses among multiple carriers in milliseconds, slashing late-delivery penalties for omnichannel retailers. Fleet electrification is another battleground: 70 battery-electric trucks in Southern California fleets have amassed 600,000 miles, proving both operational viability and compliance with stringent emissions caps. Niche operators such as Excel Courier hold defensible positions in healthcare and financial-services verticals where regulatory barriers lock out generalists.
Cross-border specialists are scaling to capture USMCA-fuelled flows. DSV’s new Laredo super-hub boasts automated sorters that clear 20,000 parcels per hour, an order-of-magnitude increase over the legacy site it replaced. Regional carriers like OnTrac extend geographic reach through facility expansions, prying volume from national giants by offering high-touch customer service and tailored pricing structures.
North America Same Day Delivery Industry Leaders
FedEx
Amazon
USPS
OnTrac
United Parcel Service of America, Inc. (UPS)
- *Disclaimer: Major Players sorted in no particular order

Recent Industry Developments
- April 2025: Fastfrate Group rebranded ASL Distribution as Precision Parcel and Package Deliveries, boosting Canadian final-mile capacity with new technology and a sustainability pledge.
- March 2025: OnTrac opened a 334,000 sq ft Midwest facility, enhancing same-day reach across key metro areas by adding automated sortation and redundant line-haul lanes.
- February 2025: DSV inaugurated a 900,000 sq ft cross-border super-hub in Laredo, Texas, outfitted with customs pre-clearance zones to streamline U.S.–Mexico parcel flow.
- January 2025: Amazon expanded its multi-year alliance with FedEx for oversized parcel delivery, blending Amazon’s volume muscle with FedEx’s heavyweight expertise.


North America Same Day Delivery Market Report Scope
Air, Road, Others are covered as segments by Mode Of Transport. Heavy Weight Shipments, Light Weight Shipments, Medium Weight Shipments are covered as segments by Shipment Weight. Domestic, International are covered as segments by Destination. E-Commerce, Financial Services (BFSI), Healthcare, Manufacturing, Primary Industry, Wholesale and Retail Trade (Offline), Others are covered as segments by End User Industry. Canada, Mexico, United States are covered as segments by Country.| Air |
| Road |
| Others |
| Heavy Weight Shipments |
| Light Weight Shipments |
| Medium Weight Shipments |
| Domestic |
| International |
| E-Commerce |
| Financial Services (BFSI) |
| Healthcare |
| Manufacturing |
| Primary Industry |
| Wholesale and Retail Trade (Offline) |
| Others |
| Canada |
| Mexico |
| United States |
| Rest of North America |
| Mode of Transport | Air |
| Road | |
| Others | |
| Shipment Weight | Heavy Weight Shipments |
| Light Weight Shipments | |
| Medium Weight Shipments | |
| Destination | Domestic |
| International | |
| End User Industry | E-Commerce |
| Financial Services (BFSI) | |
| Healthcare | |
| Manufacturing | |
| Primary Industry | |
| Wholesale and Retail Trade (Offline) | |
| Others | |
| Country | Canada |
| Mexico | |
| United States | |
| Rest of North America |


Market Definition
- Courier, Express, and Parcel - The Courier, Express, and Parcel services, often called as CEP Market, refers to the logistics and postal service providers which specialize in moving small goods (parcels/packages). It captures the overall market size (USD) and market volume (number of parcels) of (1) the shipments/parcels/packages which are under 70kgs/ 154lbs weight, (2) Business Customer packages viz. Business-to-Business (B2B) & Business-to-Consumer (B2C) as well as private customer packages (C2C), (3) non-express parcel delivery services (Standard and Deferred) as well as express parcel delivery services (Day-Definite-Express and Time-Definite-Express), (4) domestic as well as international shipments.
- Demographics - To analyse total addressable market demand, population growth & forecasts have been studied and presented in this industry trend. It represents population distribution across categories like gender (male/female), development area (urban/rural), major cities among other key parameters like population density and final consumption expenditure (growth and share % of GDP). This data has been used for assessing the fluctations in demand & consumption expenditure, and the major hotspots (cities) of potential demand.
- Domestic Courier Market - Domestic Courier Market refers to the CEP shipments wherein the origin and destination is within the boundary of the geography studied (country or region as per the scope of report). It captures the market size (USD) and market volume (number of parcels) of (1) the shipments/parcels/packages which are under 70kgs/ 154lbs weight, including light weight shipments, medium weight shipments and heavy weight shipments (2) Business Customer packages viz. Business-to-Business (B2B) & Business-to-Consumer (B2C) as well as private customer packages (C2C), (3) non-express parcel delivery services (Standard and Deferred) as well as express parcel delivery services (Day-Definite-Express and Time-Definite-Express).
- E-Commerce - This end user industry segment captures the external (outsourced) logistics expenditure incurred by the e-tailers, through online sales channel, on Courier, Express, and Parcel (CEP) services. The scope includes (i) the supply chain of a company's online customer orders being fulfilled, (ii) the process of getting a product from the point of manufacturing to the point at which it is delivered to consumers. It involves managing inventory (deferred as well as time critical), shipping, and distribution.
- Export Trends and Import Trends - Overall logistics performance of an economy is positively and significantly (statistically) correlated to its trade performance (exports and imports). Hence, in this industry trend, total value of trade, major commodities/ commodity groups and the major trade partners, for the studied geography (country or region as per the scope of report) have been analysed alongside the impact of major trade/logistics infrastructure investments & regulatory environment.
- Financial Services (BFSI) - This end user industry segment captures the external (outsourced) logistics expenditure incurred by the BFSI players, on Courier, Express, and Parcel (CEP) services. CEP is important to the financial services industry in shipping of confidential documents and files. The establishments in this sector are engaged in (i) financial transactions (that is, transactions involving the creation, liquidation, or change in ownership of financial assets) or in facilitating financial transactions, (ii) financial intermediation, (iii) the pooling of risk by underwriting annuities and insurance, (iv) providing specialized services that facilitate or support financial intermediation, insurance and employee benefit programs, and (v) monetary control - the monetary authorities.
- Fuel Price - Fuel price spikes can cause delays and diruption for logistics service providers (LSPs), while drops in the same can result in higher short-term profitability and increased market rivalry to offer consumers with the best deals. Hence, the fuel price variations have been studied over the review period and presented along with the causes as well as market impacts.
- GDP Distribution by Economic Activity - Nominal Gross Domestic Product and distribution of the same, across major economic sectors in the geography studied (country or region as per scope of the report) have been studied and presented in this industry trend. As GDP is positively related to the profitability and growth of logistics industry, this data has been used in adjunction to the input-output tables/ supply-use tables for analyzing the potential major contributing sectors towards the logistics demand.
- GDP Growth by Economic Activity - Growth of Nominal Gross Domestic Product across major economic sectors, for the geography studied (country or region as per scope of the report) have been presented in this industry trend. This data has been utilized for assessing the growth of logistics demand from all the market end users (economic sectors considered here).
- Healthcare - This end user industry segment captures the external (outsourced) logistics expenditure incurred by the Healthcare players (Hospitals, clinics, mrdical centres) , on Courier, Express, and Parcel (CEP) services. The scope includes CEP services involved in the defrerred as well time critical movement of medical goods & supplies (surgical supplies and instruments, including gloves, masks, syringes, equipment). The establishments in this sector (i) include the ones providing medical care exclusively (ii) deliver services by trained professionals (iii) involve processes, including labor inputs of health practitioners with the requisite expertise (iv) are defined based on the educational degree held by the practitioners included in the industry.
- Inflation - Variations in both Wholesale Price Inflation (YoY change in producer price index) and Consumer Price Inflation have been presented in this industry trend. This data has been used to assess the inflationary environment as it plays a vital role in smooth functioning of the supply chain, directly impacting the logistics operational cost components e.g., pricing of tyres, driver wages & benefits, energy/fuel prices, maintenace costs, toll charges, warehousing rents, custom brokerage, forwarding rates, courier rates etc. hence impacting the overall freight and logistics market.
- Infrastructure - As infrastructure plays a vital role in an economy's logistics performance, variables like length of roads, distribution of road length by surface category (paved v/s unpaved), distribution of road length by road classification (expressways v/s highways v/s other roads), rail length, volume of containers handled by major ports and tonnage handled by major airports have been analysed and presented in this industry trend.
- International Express Service Market - International Express Service Market refers to the CEP shipments wherein the origin or destination is not within the boundary of the geography studied (country or region as per the scope of report). It captures the market size (USD) and market volume (number of parcels) of (1) the shipments/parcels/packages which are under 70kgs/ 154lbs weight, including light weight shipments, medium weight shipments and heavy weight shipments (ii) Inter-Region as well as Intra-Region Shipments
- Key Industry Trends - The report section named "Key Industry Trends" include all the key variables/parameters studied to better analyze the market size estimates and forecasts. All the trends have been presented in the form of data points (time series or latest available data points) along with analysis of the paramter in the form of concise market relevant commentary, for the geography studied (country or region as per the scope of report).
- Key Strategic Moves - The action taken by a company to differentiate from its competitor or used as a general strategy is referred to as a key strategic move (KSM). This includes (1) Agreements (2) Expansions (3) Financial Restructuring (4) Mergers and Acquisitions (5) Partnerships, and (6) Product Innovations. Key players (Logistics Service Providers, LSPs) in the market have been shortlisted, their KSM have been studied and presented in this section.
- Logistics Performance - Logistics Performance and Logistics Costs are the backbone of trade, and influences trade costs, making countries compete globally. Logistics performance is influenced by market wide adopted supply chain management strategies, government services, investments & policies, fuel/ energy costs, inflationary environment etc. Hence, in this industry trend, the logistics performance of the geography studied (country/ region as per the scope of report) has been analysed and presented over the review period.
- Manufacturing - This end user industry segment captures the external (outsourced) logistics expenditure incurred by the Manufacturing industry (including Hi-Tech/Technology) players, on Courier, Express, and Parcel (CEP) services. The end user players considered are the establishments primarily engaged in the chemical, mechanical or physical transformation of materials or substances into new products. Logistics Service Providers (LSPs) play a crucial role in maintaining a smooth flow of raw materials across the supply chain, enabling timely delivery of finished goods to distributors or end customers and storing & supplying the raw materials to clients for just-in-time manufacturing.
- Other End Users - Other end user segment captures the external (outsourced) logistics expenditure incurred by the construction, real estate, educational services, and professional services (administrative, waste management, legal, architectural, engineering, design, consulting, scientific R&D), on Courier, Express, and Parcel (CEP) services. Logistics Service Providers (LSPs) plays a crucial role in the reliable movement of time critical supplies and documents to/from these industries such as transporting any equipment or resources required, shipping confidential documents and files.
- Primary Industry - This end user industry segment captures the external (outsourced) logistics expenditure incurred by the AFF (Agriculture, Fishing, and Forestry) and Extraction indsutry (Oil &Gas, Quarrying and Mining) players, on Courier, Express, and Parcel (CEP) services. The end user players considered are the establishments (i) primarily engaged in growing crops, raising animals, harvesting timber, harvesting fish & other animals from their natural habitats and providing related support activities; (ii) that extract naturally occurring mineral solids, such as coal and ores; liquid minerals, such as crude petroleum; and gases, such as natural gas. Herein, Logistics Service Providers (LSPs) (i) play a crucial role in acquisition, storage, handling, transportation, and distribution activities for the optimal & continuous flow of inputs (seeds, pesticides, fertilizers, equipment, and water) from manufacturers or suppliers to the producers and smooth flow of output (produce, agro-goods) to distributors/ consumers; (ii) cover entire phases from upstream to downstream and play a crucial role in the transportation of machinery, drilling equipments, extracted minerals, crude oil & natural gas and refined/ processed products from one place to another. This includes both termperature controlled and non-temperature controlled logistics, as and when required according to the shelf life of goods being transported or stored.
- Producer Price Inflation - It indicates inflation from viewpoint of the producers viz. the average selling price received for their output over a period of time. Annual change (YoY) of producer price index is reported as wholesale price inflation in the "Inflation" industry trend. As WPI captures dynamic price movements in most comprehensive way, it is widely used by governments, banks, industry, business circles and is deemed important in formulation of trade, fiscal and other economic policies. The data has been used in adjunction to consumer price inflation for better understanding the inflationary environment.
- Segmental Revenue - Segmental Revenue has been triangulated or computed and presented for all the major players in the market. It refers to the courier, express, and parcel (CEP) market specific revenue earned by the company, over the base year of study, in the geography studied (country or region as per the scope of report). It is computed through the study and analysis of major parameters like financials, service portfolio, employee strength, fleet size, investments, number of countries present in, major economies of concern, etc. that have been reported by the company in its annual reports, webpage. For companies having scarce financial disclosures, paid databases like D&B Hoovers, Dow Jones Factiva have been resorted to and verified through industry/expert interactions.
- Transport and Storage Sector GDP - Value and growth of Transport and Storage Sector GDP has a direct relation to the freight and logistics market size. Hence, this variable has been studied and presented over the review period, in value terms (USD) and as share % of total GDP, in this industry trend. The data has been supported by concise and relevant commentary around the investments, developments, and current market scenario.
- Trends in E-Commerce Industry - Enhanced internet connectivity and boom in smartphone penetration, coupled with increasing disposable incomes, has led to a phenomenal growth in the e-commerce market globally. Online shoppers require fast and efficient delivery of their orders leading to an increase in the demand for logistics services especially e-commerce fulfilment services. Hence, the Gross Merchandise Value (GMV), historial and projected growth, breakup of major commodity groups in e-commerce industry for the studied geography (country or region as per scope of the report) have been analysed and presented in this industry trend.
- Trends in Manufacturing Industry - Manufacturing industry involves the transformation of raw materials into finished products, while logistics industry ensures the efficient flow of raw materials to the factory, and the transport of manufactured products to the distributors & consumers. Demand-Supply of both industries are highly cross-linked and critical for a seamless supply chain. Hence, the Gross Value Added (GVA), breakup of GVA into major manufacturing sectors, and growth of manufacturing industry over the review period have been analysed and presented, in this industry trend.
- Wholesale and Retail Trade (Offline) - This end user industry segment captures the external (outsourced) logistics expenditure incurred by the wholesalers and retailers, through offline sales channel, on Courier, Express, and Parcel (CEP) services. The end user players considered are the establishments primarily engaged in wholesaling or retailing merchandise, generally without transformation, and rendering services incidental to the sale of merchandise. Logistics Service Providers (LSPs) plays a crucial role in the reliable movement of supplies to and finished products from production houses to the distributors and finally to the end customer covering activites like material sourcing, transportation, order fulfillment, warehousing & storage, demand forecasting, inventory management etc.
| Keyword | Definition |
|---|---|
| Axle Load | The axle load refers to the total load (weight) bearing on the roadway through wheels connected to a given axle. Across the globe, there are systems in place to ensure axle load monitoring, wherein surpassing the defined limits set by the concerned regulatory authority can lead to penalty/fine. For transportation of goods via road this can be an important determinant of costs as knowledge about the axle load limits can be used to (i) load the vehicle optimally for maximizing profits (ii) avoid exceeding the same and hence the probable fines associated (iii) avoid wear and tear of the vehicle (iv) avoid damage to pavement resulting in noticeable public maintenance and repair costs (v) achieve better turnaround time. |
| Back Haul | Backhaul is the return movement of a transport vehicle from its original destination to its original point of departure, and can include full, partial, or empty truck loads (all or part of the way) depending on the visibility of the local freight ecosystem. In this regard, transportation of empty containers to the point of origin, known as deadheading is also a significant factor, considering the supply/container shortages across the geographies, resulting in cost escalation and under optimized profit potential attainment. Generally, the carriers offer discounts on the backhaul, to secure freight for the trip. |
| Bill of Lading (BOL) | A bill of lading is a legal contract document issued by a carrier to a shipper to acknowledge reception of their cargo, and is evidence for the contract of carriage between the two parties. Broadly it details the (i) type, quantity, and other specifications of the goods being carried (ii) destination, and terms & conditions of the shipment (iii) carrier and drivers with all the necessary information to process the shipment, which can be used for insurance and customs clearance purposes (iv) assurance that the consignment is damage-free and ready to be shipped to the consignee. In this regard, a house bill of lading (HBL) is a document issued by a freight forwarder or a non-vessel operating common carrier (NVOCC) to acknowledge receipt of items for shipment (to a shipper). If shipments from several shippers are involved a master bill of lading (MBL) might be involved which is a consolidated version of the same for all the shipments being taken care of by the carrier (to a common destination) and might be issued by the carrier to the freight forwarder or the shipper (depending on who books the transport). |
| Bunkering | Bunkering is the process of supplying fuel to power the propulsion system of a ship. It includes the logistics of loading and distributing the fuel among available shipboard tanks. In this regard, (i) Bunker fuel is technically any type of fuel oil used aboard ships. It gets its name from the containers on ships and in ports that it is stored in; in the days of steam they were coal bunkers but now they are bunker-fuel tanks, (ii) Bunker refers to the spaces (Tank) on board a vessel to store fuel, (iii) Bunker trader refers to a person dealing in trade of bunker (fuel), (iv) Bunker call is made when a cargo ship anchors or berths in a port to take on bunker oil or supplies, (v) Bunkering service is the supply of a requested quality and quantity of bunkers to a ship. Bunkering is signficant from point of view of freight rates applicable to the shipper as Bunker Contribution (BUC)/ Fuel Adjustment Factor (FAF)/ Bunker Adjustment Factor (BAF) are applied by shipping lines to offset the effect of fluctuations in the cost of bunkers. |
| Cabotage | Transport by a vehicle registered in a country, performed on the national territory of another country. Cabotage law may restrict domestic cargo traffic to be carried in its own nationally registered, and sometimes built and crewed vehicles, though regulations vary across industries/commodity groups/countries and sometimes specify maximum allowable percentage of cabotage that can be serviced by foreign registered fleet. |
| C-commerce | Collaborative commerce (also known as C-commerce), (i) describes electronically enabled business interactions among an enterprise’s internal personnel, business partners and customers throughout a trading community (industry, industry segment, supply chain or supply chain segment); (ii) is the optimization of supply and distribution channels to capitalize on the global economy by using new technology efficiently. Advantages of C-commerce, to detail few include (i) maximization of organization's efficiency and profitability (ii) technology integration with physical channels to allow companies to work together (iii) increased information exchange such as inventory and product specifications, using the web as an intermediary (iv) increased competitiveness by reaching a broader audience. Examples of C-commerce, also known as peer-to-peer commerce, include (i) companies that allow consumers to rent things from each other, or marketplaces, such as Meta (formerly Facebook) Marketplace, that allow the sale of used goods; (ii) DoorDash teamed up with many national brands, such as McDonald’s and Chipotle, to offer fast food delivery, building their business model on c-commerce. They have since expanded their delivery service from restaurants to retailers and even offer 'fleets' of drivers to businesses. |
| Courier | A business/company that delivers packages/parcels/shipments (upto 70 kgs) including quick door to door pickup and delivery service for goods or documents, domestically or internationally, on a commercial contract basis. Example, DHL Group, FedEx, United Parcel Service of America, Inc., USPS, International Distributions Services, J&T Express, SF Express among several others |
| Cross docking | Cross docking is a practice in logistics management that includes unloading incoming delivery vehicles and loading the materials directly into outbound delivery vehicles, omitting traditional warehouse logistical practices and saving time and money. It requires close synchronization of both inbound and outbound movements. It is highly significant in reduction of costs pertaining to warehousing & storage (and the associated Value Added Services). |
| Cross Trade | International transport between two different countries performed by a vehicle registered in a third country. A third country is a country other than the country of loading/embarkation and the country of unloading/disembarkation. Cross Trade law may restrict international cargo traffic to be carried by respective country's registered vehicles, and sometimes built and crewed vehicles, though regulations vary across industries/commodity groups/countries and sometimes specify maximum allowable percentage of cross trade that can be serviced by foreign registered fleet. |
| Customs Clearance | The process of declaring and clearing cargoes through customs. It includes the procedures involved in getting cargo released by Customs through designated formalities such as presenting import license/permit, payment of import duties and other required documentations by the nature of the cargo. In this regard, a customs broker is a person or company licensed by the respective department of the country to act on behalf of freight importers and exporters. |
| Dangerous Goods | Dangerous goods (or hazardous materials or HAZMAT) include flammable liquids/solids, gases (compressed, liquified, dissolved under pressure), corrosives, oxidising substances, explosive substances and articles, substances which on contact with water emit flammable gasses, organic peroxides, toxic substances, infectious substances, radioactive materials, miscellaneous dangerous goods and articles. |
| First mile Delivery | First mile delivery refers to the (i) first stage of the freight/shipment/cargo/courier transportation (ii) the transportation of goods from a merchant’s premises or warehouse to the next fulfillment centre/warehouse/hub from where the goods are forwarded (iii) shipping goods from local distribution centers to stores (For retailers) (iv) transportation of finished goods from a plant or a factory to a distribution center (For manufacturers), (v) pick up of goods from the end-customer’s home or store followed by movement to a warehouse or storage location (movers and packers), (vi) process where goods are picked up from a retailer and then transferred to third-party logistics providers or courier service providers to be delivered to the end-consumer (e-commerce). Once the package reaches the next warehouse or the courier’s hub, it is then sorted and transported further until it reaches the customer’s doorstep. Example, if one chooses UPS as a courier, first-mile delivery will be the product being delivered from manufacturer's/retailer's warehouse to the UPS’s warehouse/ fulfilment centre. |
| Last Mile Delivery | Last mile delivery refers to the very last step of the delivery process when a parcel is moved from a transportation hub (warehouse or a distribution center or fulfillment centre) to its final destination, which usually is a personal residence/retail store/ business, or parcel locker. It accounts for around half of the total cost involved in entire process of first mile, middle mile, and last mile delivery, though it can vary shipment to shipment, based on commodity, business model and similar factors. |
| Milkrun | A Milk Run is a delivery method used to transport mixed loads from various suppliers to one customer, using lean management principles applied to logistics. Instead of each supplier sending a truck every week to meet the needs of one customer, one truck (or vehicle) visits the suppliers to pick up the loads for that customer. This method of transport got its name from the dairy industry practice, where one tanker used to collect milk from several dairy farms for delivery to a milk processing company. A milk run can be a more efficient way to handle logistics but require proper planning. If the route involves products from different companies, there is need for an agreement about cost-sharing and other aspects of the cooperative delivery arrangement. Once the group settles these issues, this delivery method can save time and money for everyone by pooling operation costs and resources. |
| Multi country consolidation | Multi-Country Consolidation (MCC) is a cost-effective solution that consolidates one's cargo from different countries of origin to build Full Container Loads (FCL). MCC is most suitable for companies that import light volumes of goods from multiple countries but want to take advantage of the more economic FCL freight rates. Apart from costing some of the other advantages include (i) flexibility to choose suppliers from a wider range of origin countries without worrying about the logistics to final destination from each origin, (ii) ability to pick the most suitable suppliers from many different countries for one's business operations. The increase in one's sourcing options by MCC provides the kind of flexibility needed in competitive global markets. |
| Q-commerce | Q-commerce, also referred to as quick commerce, is a type of e-commerce where emphasis is on quick deliveries, typically in less than an hour. The companies providing Q-Commerce services might have vertically intergrated model or might be using third party delivery platforms (outsourced logistics). It has advantages like (i) competitve USP, (ii) potential to earn greater profit margins, (iii) better customer experience, (iv) guaranteed availability of products, (v) traceability, and (vi) scaleability. |
| ReverseLogistics | Reverse logistics is a type of supply chain management that moves goods from customers back to the sellers or manufacturers and may involve ciruclar economy principles (3Rs) viz. recycling, reuse (repurposing, reselling), reducing or repairing. In this regard, reverse commerce (or Recommerce) is the selling of previously owned items through physical or online marketplaces/distribution channels to buyers who reuse, recycle or resell them. |


Research Methodology
Mordor Intelligence follows a four-step methodology in all our reports.
- Step-1: Identify Key Variables: In order to build a robust forecasting methodology, the variables and factors identified in Step-1 are tested against available historical market numbers. Through an iterative process, the variables required for market forecast are set and the model is built on the basis of these variables.
- Step-2: Build a Market Model: Market-size estimations for the forecast years are in nominal terms. Inflation is considered to be a part of the pricing, and the average selling price (ASP) is varying throughout the forecast period for each country
- Step-3: Validate and Finalize: In this important step, all market numbers, variables and analyst calls are validated through an extensive network of primary research experts from the market studied. The respondents are selected across levels and functions to generate a holistic picture of the market studied.
- Step-4: Research Outputs: Syndicated Reports, Custom Consulting Assignments, Databases & Subscription Platforms


