
Market Overview
| Study Period | 2020 - 2031 |
|---|---|
| Forecast Data Period | 2026 - 2031 |
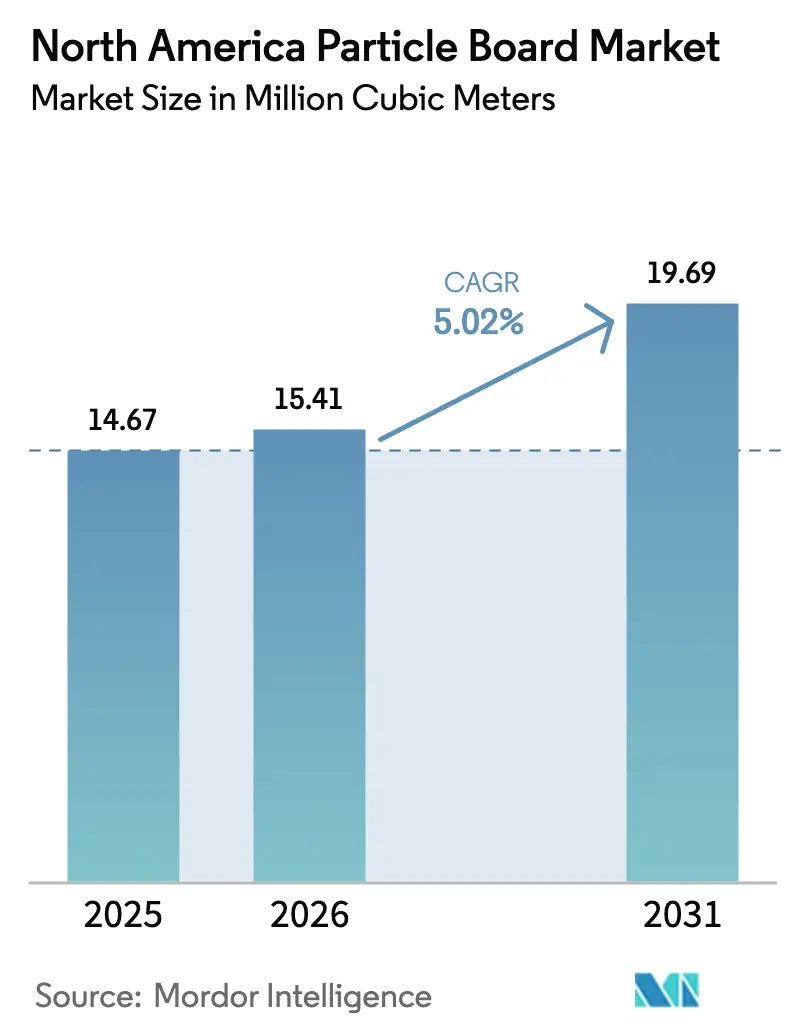
| Base Year Market Size (2025) | 14.67 Million cubic meters |
| Market Volume (2026) | 15.41 Million cubic meters |
| Market Volume (2031) | 19.69 Million cubic meters |
| Growth Rate (2026 - 2031) | 5.02 % |
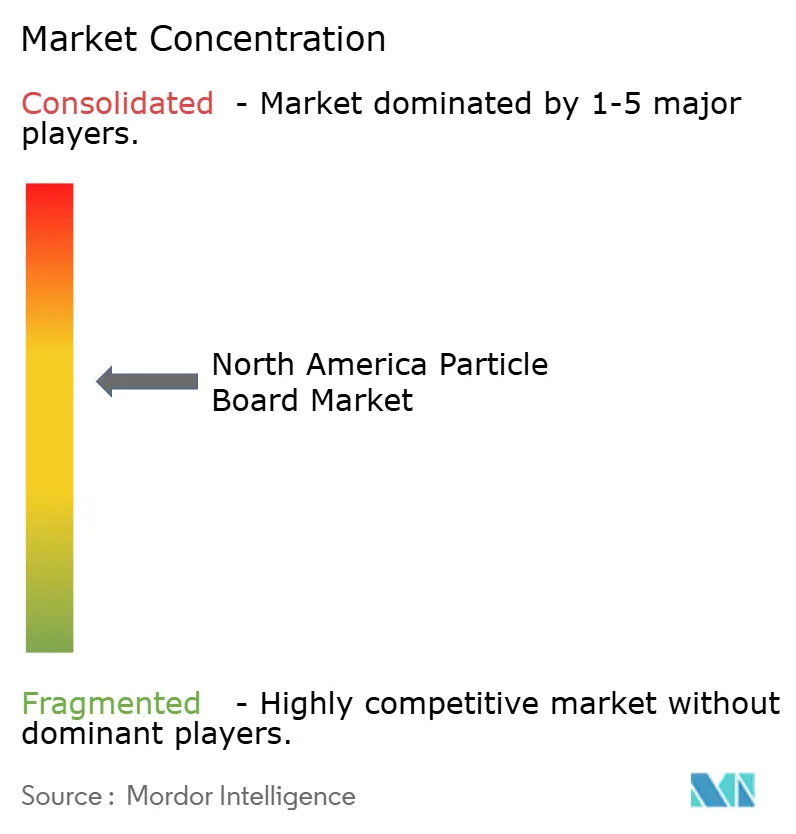
| Market Concentration | Medium |
Major Players *Disclaimer: Major Players sorted in no particular order Image © Mordor Intelligence. Reuse requires attribution under CC BY 4.0. | |
North America Particle Board Market Analysis by Mordor Intelligence
North America Particle Board Market size in 2026 is estimated at 15.41 million cubic meters, growing from 2025 value of 14.67 million cubic meters with 2031 projections showing 19.69 million cubic meters, growing at 5.02% CAGR over 2026-2031. This growth trajectory reflects three intersecting forces. First, state-level landfill-diversion mandates are redirecting construction and demolition wood into panel furnish, easing raw-material costs for mills located near urban waste streams. Second, furniture producers are re-engineering product lines around flat-pack formats that prize low weight and tight dimensional tolerances, a design philosophy that dovetails with continuous-press particle board. Third, sugarcane-growing regions in Louisiana are commercializing bagasse as an alternative furnish, helping producers hedge against sawmill-residue volatility. On the demand side, residential remodeling expenditures in the United States are driving cabinet substrates and flooring underlayment volumes upward. Competition is intensifying as continuous-press automation narrows the unit-cost gap between particleboard and medium-density fiberboard, prompting furniture OEMs to reassess their material specifications. Meanwhile, EPA formaldehyde caps have raised the compliance bar, accelerating consolidation and favoring mills that can amortize resin-system upgrades over larger output bases.
Key Report Takeaways
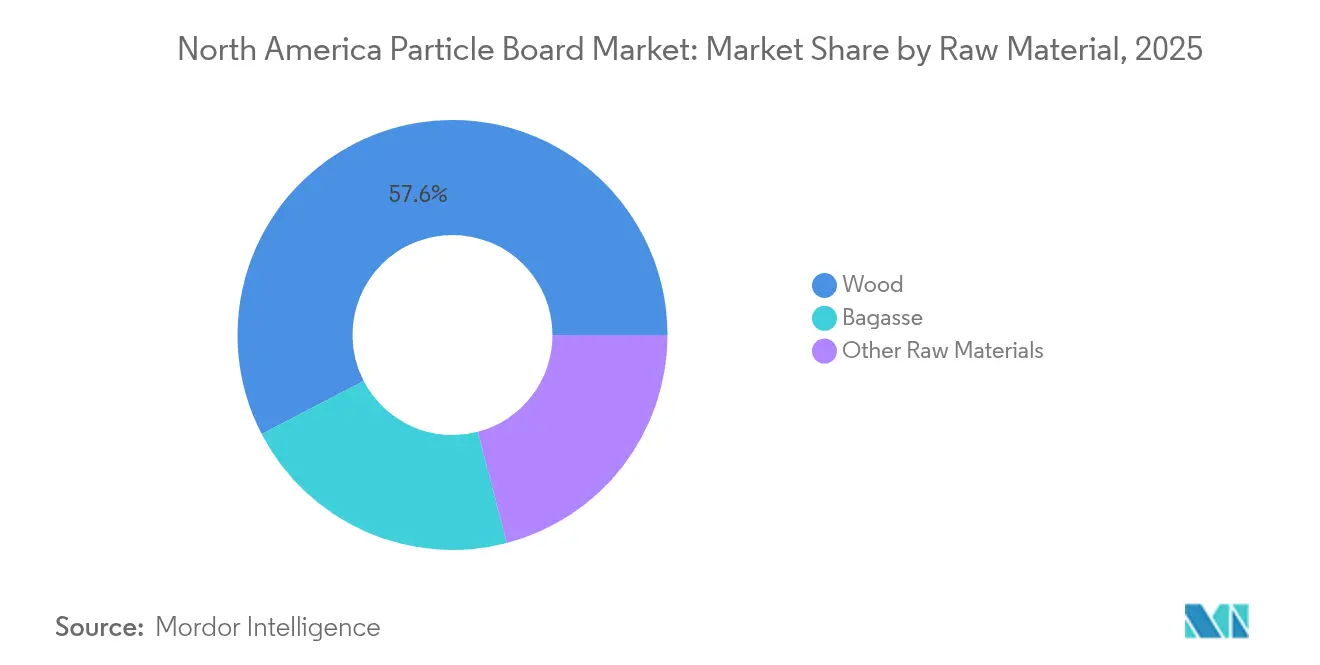
- By raw material, wood residues led with a 57.62% share of the North American particle board market in 2025, while bagasse is projected to expand at a 5.38% CAGR through 2031.
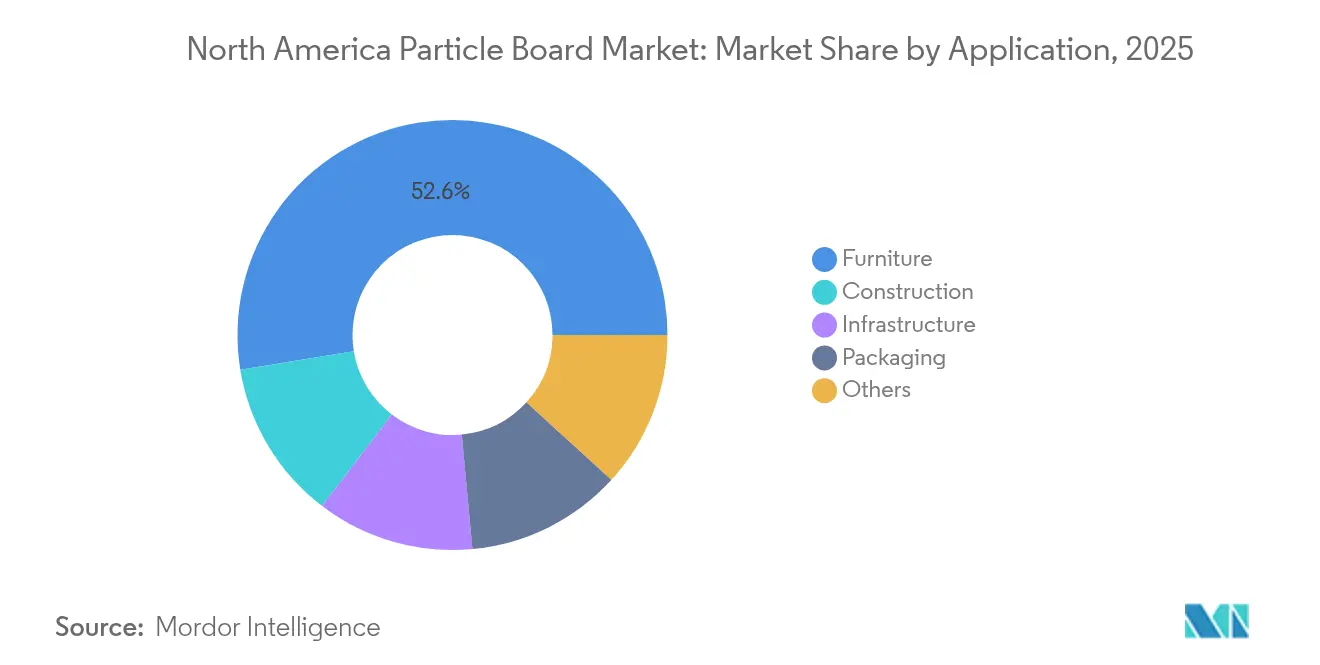
- By application, furniture accounted for 52.58% of the North American particle board market size in 2025 and is projected to advance at a 5.45% CAGR through 2031.
- By geography, the United States captured 66.45% of the North America particle board market share in 2025 and is forecast to grow at a 5.12% CAGR over the same period.
Note: Market size and forecast figures in this report are generated using Mordor Intelligence’s proprietary estimation framework, updated with the latest available data and insights as of 2026.
Market Trends and Insights
Drivers Impact Analysis of North America Particle Board Market*
| Drivers | (~) % Impact on CAGR Forecast | Geographic Relevance | Impact Timeline |
|---|---|---|---|
| Growing demand from the construction industry | +1.2% | United States, Canada | Medium term (2-4 years) |
| Easy availability of regional wood residues | +0.9% | United States (South, Pacific Northwest), Canada (Quebec, Ontario) | Short term (≤ 2 years) |
| Surge in RTA furniture and DIY renovation boom | +1.4% | United States, Canada, with urban concentration | Short term (≤ 2 years) |
| State-level landfill-diversion mandates unlocking recycled feedstock | +0.8% | United States (California, Washington, Oregon) | Medium term (2-4 years) |
| Continuous-press automation cutting unit costs | +0.7% | North America (facilities with capital access) | Long term (≥ 4 years) |
| Source: Mordor Intelligence | |||
Growing Demand from the Construction Industry
Residential remodeling spending surpassed expectations in 2024, driving demand for particle board in countertop cores, stair treads, and interior partitions. Single-family housing starts remain comfortably above pre-pandemic baselines, and each new unit incorporates roughly 0.8–1.2 m³ of panel products. Modular construction is scaling in multi-family projects, favoring particle board because the material machines easily and withstands repeated handling during off-site assembly. Canada echoes this pattern, particularly in Ontario and British Columbia, where provincial codes now recognize engineered wood for use in non-load-bearing walls. Infrastructure spending, although a smaller slice of consumption, is lifting particle board volumes in acoustic baffles and temporary formwork used in transit corridors.
Easy Availability of Regional Wood Residues
The 2023 U.S. Department of Energy Billion-Ton Report identified logging residue and unused mill residue as sources of annual waste. Alabama, Georgia, Mississippi, and South Carolina collectively account for significant sawmill by-products each year, prompting mill investment along key rail corridors that connect forests to Gulf Coast ports. Quebec and Ontario enjoy a similar, if colder, dynamic: co-located sawmill and panel operations slash haul distances and stabilize furnish costs. Small-diameter trees harvested through U.S. Forest Service thinning contracts represent an additional source each year, although economics are sensitive to terrain and trucking radius.
Surge in RTA Furniture and DIY Renovation Boom
IKEA North America posted sales in FY 2023, a benchmark that underscores the pull of ready-to-assemble formats on the North America particle board market. E-commerce logistics reward low-bulk packaging, so furniture designers tend to gravitate toward particle board panels that deliver weight savings without compromising fastener-holding capacity. Social-media tutorials have democratized woodworking skills, prompting more homeowners to opt for flat-pack cabinets and laminate flooring underlayment that can be easily installed with basic tools. Millennial and Gen-Z households, typically more mobile than older cohorts, value affordability and quick assembly over heirloom durability. Big-box retailers now bundle particle board shelving and storage kits with step-by-step apps, further normalizing the material for non-structural household upgrades.
State-Level Landfill-Diversion Mandates Unlocking Recycled Feedstock
California’s SB 1383 requires 75% diversion of organic waste by 2025, placing construction and demolition wood squarely within the mandate[1]. Local grinding stations now sell recycled furnish at shadow prices below USD 70 per dry ton, a discount that coastal particle board mills leverage to undercut inland rivals. Washington and Oregon rolled out similar bans, tightening supply for bioenergy plants and reshaping the cost curve for board producers. Public procurement rules in the West favor verified post-consumer content, giving certified panels a competitive edge in school and municipal projects. Mills outside coastal catchment zones must either import recycled furnish, increasing transport costs, or rely more heavily on sawmill residues that face rising competition from the pellet sector.
Restraints Impact Analysis of North America Particle Board Market*
| Restraints | (~) % Impact on CAGR Forecast | Geographic Relevance | Impact Timeline |
|---|---|---|---|
| Threat of MDF and plywood substitutes | -0.6% | North America, with higher impact in premium furniture and cabinetry segments | Medium term (2-4 years) |
| Tightening formaldehyde-emission regulations | -0.4% | United States (EPA jurisdiction), Canada (Health Canada standards) | Short term (≤ 2 years) |
| Bio-energy projects competing for wood residue supply | -0.5% | United States (South, Pacific Northwest), Canada (British Columbia) | Long term (≥ 4 years) |
| Source: Mordor Intelligence | |||
Threat of MDF and Plywood Substitutes
Medium-density fiberboard commands a price premium but wins market share in painted cabinets because its fine fibers eliminate the need for edge banding. Plywood retains dominance in structural shelving and sub-floor assemblies where particle board’s lower internal bond strength is a disadvantage. Cross-laminated timber is emerging in mid-rise frames and threatens particle board’s foothold in non-structural skirting applications. Consumers in premium brackets often equate MDF or plywood with higher quality, particularly for moisture-prone areas such as kitchens and bathrooms. Producers are trialing melamine-urea-formaldehyde recipes, along with wax additives, to improve moisture resistance; however, these upgrades narrow the cost delta with MDF and curb particle board’s pricing appeal.
Tightening Formaldehyde-Emission Regulations
EPA’s 40 CFR Part 770 caps emissions at 0.09 ppm and mandates third-party certification for interstate commerce[2]. California’s Air Resources Board enforces a stricter testing cadence, prompting mills to adopt more expensive phenol-formaldehyde or MDI binders. Health Canada has harmonized its thresholds with those of the EPA, removing any compliance arbitrage for exporters. Smaller mills face resin cost increases and must finance new large-chamber test equipment or outsource verification, both of which erode margins. Failure to comply risks recalls, contract loss, and reputational damage, spurring some mid-tier operators to exit or sell capacity to better-capitalized rivals.
*Our forecasts treat driver/restraint impacts as directional, not additive. The impact forecasts reflect baseline growth, mix effects, and variable interactions.
North America Particle Board Market Segment Analysis
By Raw Material:
Wood Residues Maintain Leadership as Bagasse Gains TractionWood residues captured 57.62% of the North America particle board market share in 2025, reflecting entrenched sawmill infrastructure that channels sawdust, shavings, flakes, and chips into continuous-press furnish. Sawdust feeds the surface layer for a smoother finish, while coarser flakes bulk out the core where density drives bending strength. Chips from pulp operations provide a tertiary stream when low-grade roundwood is plentiful, especially in the U.S. South. Bagasse, the fibrous by-product of sugarcane crushing, is forecast to expand at a 5.38% CAGR through 2031, the fastest rate among feedstocks, helped by partnerships between Louisiana sugar mills and panel makers that monetize what was once a disposal cost. Laboratory trials confirm that bagasse boards bonded with MDI resin pass ANSI A208.1 internal-bond benchmarks. Secondary materials such as hemp hurds and cotton stalks remain niche because year-round supply consistency is elusive, a key requirement for continuous-press scheduling.
Continuous refinements in dryer controls and resin sprays are lowering the moisture penalty of recycled demolition lumber, enabling mills to blend reclaimed chips with virgin furnish without exceeding emissions thresholds. Nevertheless, shifting to higher recycled content demands closer contaminant screening because legacy plywood offcuts often carry phenol-based adhesives that skew formaldehyde assays. Large mills with optical sorting lines absorb this complexity more readily, reinforcing the scale advantage that characterizes the North America particle board market.

By Application:
Furniture Segment Widens its Lead on DIY MomentumFurniture accounted for 52.58% of the 2025 volume and is expected to grow at a 5.45% CAGR through 2031, driven by the rapid adoption of ready-to-assemble lines that reduce weight and ship flat. CNC routers cut particle board with minimal tool wear, and edge-banding machines accommodate thickness tolerances as tight as ±0.15 mm on continuous-press output. Construction ranked second, buoyed by remodeling projects that rely on particle board underlayment and stair treads for cost-optimized flooring systems. DIY channels accelerated during the pandemic era and have not receded, as big-box stores continue to stock panelized cabinet kits that reduce skilled-labor spend. Infrastructure and packaging remain smaller niches: transit-station acoustic panels and export crates, respectively, together account for less than one-tenth of aggregate demand. Yet federal domestic-content rules for public projects could stimulate broader use of recycled-content particle board in non-load-bearing partitions.
Retailers are increasingly specifying third-party-certified low-formaldehyde grades, thereby tightening inbound quality checks. This favors mills with on-site emissions testing, further consolidating the customer base around large-scale producers. As a result, furniture OEMs negotiate multi-year contracts tied to methylene-diphenyl-diisocyanate price indices, locking in supply while granting mills a predictable offtake that justifies new line debottlenecking.
Geography Analysis
Southeastern and Western United States Particle Board Market
The United States accounted for 66.45% of North American particle board shipments in 2025, and its output is set to rise at a 5.12% CAGR through 2031. Capacity additions are concentrated in the Southeast, and logistics corridors connect forests with Gulf ports, providing a cost advantage over import-dependent regions. On the West Coast, California’s SB 1383 is unlocking recycled wood flows that coastal mills leverage to underprice their interior competitors, although inland producers remain advantaged in terms of freight for Midwestern customers. The Pacific Northwest continues to contract as log export restrictions, wildfire setbacks, and sawmill closures tighten residue availability, prompting operators like Roseburg to shutter the Missoula line and redeploy capital to higher-yield assets.
Quebec and Ontario Particle Board Market
Canada ranks second, with integrated facilities in Quebec and Ontario that pipe sawmill shavings directly into continuous press lines. Provincial stumpage policies favor domestic processing; however, rising natural-gas tariffs and competition from pulp mills increase operating costs. Housing starts remain below pre-2008 peaks, limiting growth in construction-linked panel usage. Western Canada sees residue diversion into pellet exports, creating episodic shortages for board producers in British Columbia. Nonetheless, Quebec’s Green Building Program incentivizes low-emission panels in municipal projects, opening a small but lucrative niche for certified particle board.
Mexico Particle Board Market
Mexico holds a modest share but offers white-space potential. Feedstock collection is fragmented, and continuous-press capacity is limited; however, the federal government’s housing-subsidy initiatives indicate a medium-term demand uplift. MASISA’s Terranova facility operates below nameplate capacity due to fuel shortages, yet sugarcane-based bagasse streams in Veracruz could supply future expansion phases if logistics hurdles are overcome. Investors will likely weigh the cost of supply-chain integration—harvesting, chipping, and rail links—against the cost of EPA-equivalent resin systems needed to export to the United States.
Regulatory Landscape
In the United States, particleboard sold or distributed in interstate commerce must comply with EPA TSCA Title VI (40 CFR Part 770) composite wood requirements, including third-party certification and labeling, with the federal emission limit for particleboard set at 0.09 ppm. California adds an additional layer via the California Air Resources Board (CARB) Composite Wood Products program (ATCM), which is often treated as the strictest practical compliance benchmark for panels entering large West Coast distribution channels.
In Canada, the Government of Canada Formaldehyde Emissions from Composite Wood Products Regulations (SOR/2021-148) aligns emission limits with the North American framework, narrowing room for cross-border compliance arbitrage for mills and importers serving the United States and Canada. Alongside emissions compliance, state-level organics and landfill-diversion policies, notably California SB 1383 with a 2025 diversion target referenced in the market context, affect furnish sourcing and documentation practices for recycled-content claims used in public procurement and building-project specifications.
Value Chain Analysis
The value chain begins with furnish aggregation from sawmill residues (sawdust, shavings, flakes, and chips), supplemented by alternative agricultural residues such as bagasse in sugarcane-linked regions and by increasing blends of recycled construction and demolition wood where diversion programs support collection. Upstream inputs also include binders and additives, such as urea-formaldehyde, melamine-modified systems, phenol-formaldehyde, or MDI, plus waxes, with TSCA Title VI, CARB, and Canada’s composite-wood rules shaping resin selection, quality-control cadence, and certification costs.
Manufacturing centers on drying, blending, mat forming, and continuous-press consolidation, followed by sanding, trimming, and lamination or overlay where applicable, and packaging. Downstream channels run through distributors and fabricators into furniture, including RTA or flat-pack formats, construction underlayment and non-structural interior uses, and niche infrastructure or packaging applications. Large buyers increasingly require certified low-formaldehyde grades and traceable documentation. Logistics economics depend on hauling radius for bulky furnish and finished panels, favoring integrated wood-products groups that can balance residue flows across OSB, MDF, plywood, and particleboard assets and redeploy capital toward higher-yield lines when regional residue availability tightens.
Competitive Landscape
The North American particle board market is moderately consolidated. Competitive levers cluster in three areas: furnish security, formaldehyde compliance, and automation maturity. Technologically, the arms race centers on continuous-press retrofits and inline quality control. EPA and CARB emission caps function as quasi-barriers to entry because quarterly testing and certification overhead erode the scale economies of small plants. Furniture OEMs are now writing low-formaldehyde clauses into supplier agreements, effectively blacklisting non-compliant mills. Strategic whitespace is visible in three lanes. First, bagasse-based boards in Louisiana utilize sugar sector residues and benefit from the renewable content marketing appeal. Second, recycled-content panels in California and Washington have reduced disposal fees for municipalities wrestling with SB 1383 compliance. Third, moisture-resistant grades paired with melamine films could claw back kitchen and bathroom share lost to MDF and plywood. Realizing these opportunities will require capital endowments that only larger incumbents or well-funded entrants can marshal.
North America Particle Board Industry Leaders
-
Roseburg Forest Products
-
Georgia-Pacific.
-
Arauco
-
Kronospan LLC
-
West Fraser Timber Co.
- *Disclaimer: Major Players sorted in no particular order
North America Particle Board Market Companies Covered in this Report
- Amerhart
- Arauco
- Boise Cascade
- Collins Products
- Cornerstone Specialty Wood Products LLC
- Egger Wood Products LLC
- Forestral Terranova Mexico SA de CV (MASISA)
- Georgia-Pacific.
- GP Wood Products Inc.
- Kronospan LLC
- Maderas Conglomeradas SA de CV (MACOSA)
- Masonite Corporation
- Panolam Industries International Inc.
- Plummer Forest Products
- Roseburg Forest Products
- Tafisa Canada Inc.
- Timber Products Company
- Uniboard
- West Fraser Timber Co.
- Weyerhaeuser Company
Market Opportunities and Future Outlook
Opportunity is visible in product and process pathways that reduce compliance cost per cubic meter while still meeting tightening emissions scrutiny. TSCA Title VI labeling and third-party certification in the United States, CARB oversight in California, and harmonized Canadian rules under SOR/2021-148 are pushing mills and resin suppliers toward lower-emitting formulations and tighter inline quality control. This creates whitespace for formaldehyde-free or ultra-low emitting adhesive systems and for certified panel grades that simplify procurement for national furniture and retail chains.
Feedstock and footprint-driven differentiation is another actionable lane. The market context highlights landfill-diversion programs in the US West, including California SB 1383, which expand recycled-wood furnish availability near urban grinding stations and support public-project specifications tied to verified post-consumer content. Technology programs aimed at bio-based, formaldehyde-free binders also reinforce this direction. For example, Sonae Arauco joined the EU-funded SUSBOARD project in 2026 to develop bio-based adhesives for particleboard and MDF, which signals potential inputs for North American product roadmaps for suppliers serving multinational furniture and building-material customers seeking lower-emission panels.
Recent Industry Developments in North America Particle Board Market
- May 2026: Georgia-Pacific announced an Ontario government investment of $10 million toward a $191 million modernization and expansion project at Georgia-Pacific’s North Woods OSB facility in Englehart to boost production capacity by 14%. The capacity expansion strengthens regional panel supply and competitiveness and supports broader panel market dynamics in North America.
- February 2026: Roseburg Forest Products announced strategic realignment of production at two Oregon mills, consolidating specialty plywood at Coquille and reducing staffing at Riddle Plywood by about 146 positions. The realignment influences panel-related production capacity in West Coast facilities and optimizes product mix and cost structure, potentially affecting particleboard-related supply and pricing dynamics indirectly.
- January 2026: Sonae Arauco joined EU SUSBOARD project to develop bio-based, formaldehyde-free adhesives for particleboard and MDF production. The project supports sustainability and compliance in particleboard fabrication and could affect raw-material and resin-system choices.
North America Particle Board Market Report Scope and Research Methodology
Market Definition and Coverage
For this study, the market covers particle board manufactured and consumed across North America, measured in volume terms, and used mainly in interior building and furniture related applications.
Scope exclusions: It does not include MDF, plywood, OSB, hardboard, or solid wood panels, even if they compete for the same end uses.
Segments Covered in This Report
- By Raw Material
- Wood
- Sawdust
- Shavings
- Flakes
- Chips
- Bagasse
- Other Raw Materials
- Wood
- By Application
- Furniture
- Construction
- Infrastructure
- Packaging
- Others
- By Geography
- United States
- Canada
- Mexico
Data Sources, Market Sizing, and Validation
Desk Research
Desk work started with building the demand and supply picture for particle board in the United States, Canada, and Mexico, and then aligning it to consistent units (cubic meters) so the time series can be compared cleanly. We relied on public statistics and technical references that help explain wood product output, construction activity, and trade flows, which are the three areas that tend to move particle board demand.
Sources used included, as examples, Composite Panel Association releases on shipments and capacity, US Forest Service publications on wood based panel capacity and production, US Census Bureau construction and housing indicators, and US International Trade Commission trade statistics for wood panel categories. We also used company filings and investor presentations, plus reputable press coverage for plant start ups, closures, and capacity expansions, and we validated selected items using paid subscriptions for company financials and intelligence, a patent database, and shipment level import export records. These examples are not exhaustive and many other references were checked for data collection, validation, and clarification.
Primary Interviews and Surveys
Primary discussions were used to confirm how demand moves by end use, especially furniture and interior construction, and to sanity check capacity utilization and average selling price direction during the base year. We spoke with a mix of producers, distributors, and large downstream buyers across the region so gaps left by public data could be filled and then rechecked through more than one viewpoint.
Distribution of primary research fieldwork respondents
| Company type | Respondent position |
|---|---|
| Top tier: 37% | CXOs: 18% |
| Mid tier: 42% | Functional/Unit leaders: 31% |
| Smaller Players: 21% | Managers: 51% |
Market-Sizing & Forecasting
Market sizing was reconstructed using top-down logic anchored on North American panel capacity and operating patterns, followed by adjustments using trade movements and end use demand signals that explain local consumption. The total was then corroborated with selective bottom-up checks, such as sampled mill level capacity additions or curtailments, distributor channel feedback on shipment volumes, and directional ASP checks where pricing was available.
Key inputs used in the model included particle board nameplate capacity and utilization, import export volumes for relevant panel categories, housing starts and residential remodeling indicators, furniture and cabinetry activity proxies, and the timing of mill expansions and closures that change regional supply. For the forecast, scenario analysis was applied around construction cycles and capacity changes, and the final trajectory was tempered using the consensus from interviews on utilization recovery pace and substitution pressures from other panels. Where a full bottom-up roll up was not feasible, missing pockets were handled through regional ratios tied back to capacity and shipment shares, and then revalidated through follow up calls.
Data Validation & Update Cycle
Outputs were checked against independent signals, such as capacity change announcements, association shipment direction, and import export movements, so the model does not drift away from what the market is physically able to supply. When a mismatch appeared, assumptions were reopened, interview notes were revisited, and the most sensitive inputs, like utilization and trade splits, were recalibrated before sign off.
A multi step review is followed, where one analyst rebuilds key calculations and another checks for unit consistency, unusual jumps, and region level reasonableness. The report is refreshed annually, and interim updates are made when material events occur, such as a major capacity start up or a prolonged curtailment. Before delivery, a final pass is done so clients receive the latest updated view.
Mordor Intelligence's North America Particle Board Market Sizing Compared With Other Published Estimates
Published estimates for this market often differ because the market can be counted in value or volume, and because some publishers mix particle board with nearby wood panels or include extra downstream steps like laminating. Differences also show up when authors assume different utilization rates, or when base years and unit conversions are not aligned.
Capacity and shipment signals, along with import export direction, are used to keep Mordor Intelligence's estimate tied to the realistically supplied and consumed particle board volume in North America, rather than a blended wood panel total. Another common gap driver is coverage choice, where some figures treat only the United States as the market or report aggressive recovery cases without rechecking them against operating rates. Currency effects can also appear when value is reported, but this study stays in cubic meters so price inflation and FX timing do not distort the size.
Benchmark comparison
| Source | Market Size | Gaps in Research Methodology |
|---|---|---|
| Mordor Intelligence | USD 14.67 M (2025) | |
| Trade Journal A | USD 9.39 M (2023) | Uses published nameplate capacity references that are not consistently adjusted for curtailments and downtime, which can understate effective supply in a given year. |
| Regional Consultancy B | USD 25.70 M (2025) | Appears to report a broader wood panel value pool and may blend particle board with adjacent panels or value added steps, which inflates the addressable total versus a particle board only volume scope. |
The comparison shows that the spread is mainly explained by scope boundaries and by how operating capacity is translated into usable market volume. By staying consistent on units, aligning the base year, and rechecking utilization and trade direction through repeatable signals, the estimate remains easier to audit and update as new capacity and demand data comes in.
Key Questions Answered in the Report
What is the projected volume for particle board demand in North America by 2031?
Consumption is expected to reach 19.69 million m³ by 2031, based on a 5.02% CAGR from 2026.
Which end-use segment will contribute most to incremental growth through 2031?
Furniture applications, driven by ready-to-assemble lines, will add the largest share, growing at a 5.45% CAGR.
How are state landfill-diversion mandates influencing raw-material costs?
Policies such as California’s SB 1383 are channeling demolition wood into furnish streams, reducing delivered costs for mills near urban centers.
Why is bagasse attracting interest from panel producers?
Sugarcane residues can meet ANSI A208.1 strength standards and are forecast as the fastest-growing feedstock at 5.38% CAGR, offering a hedge against sawmill-residue shortages.
How strict are current formaldehyde rules for particle board?
EPA limits emissions to 0.09 ppm and requires third-party certification, with California demanding even tighter testing frequencies.
What is the current value of the North America particle board market?
The North America particle board market size is expected to reach 15.41 million cubic meters by 2026.