Market Overview
| Study Period | 2021 - 2031 |
|---|---|
| Forecast Data Period | 2026 - 2031 |
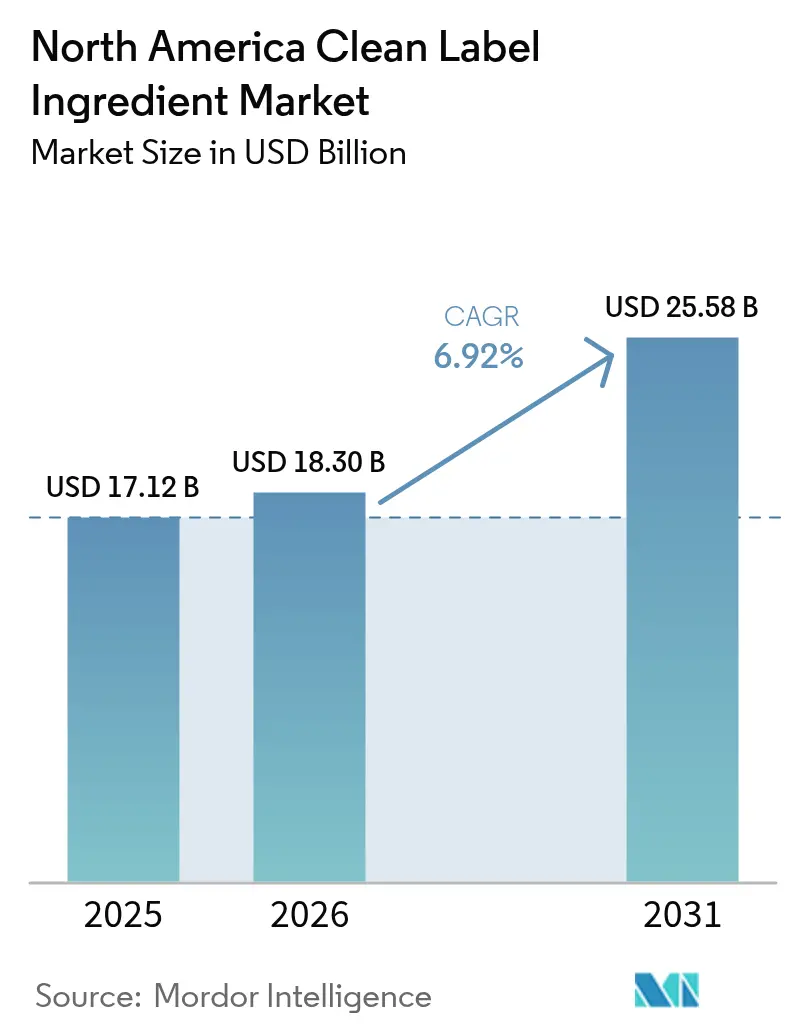
| Base Year Market Size (2025) | USD 17.12 Billion |
| Market Size (2026) | USD 18.3 Billion |
| Market Size (2031) | USD 25.58 Billion |
| Growth Rate (2026 - 2031) | 6.92% CAGR |
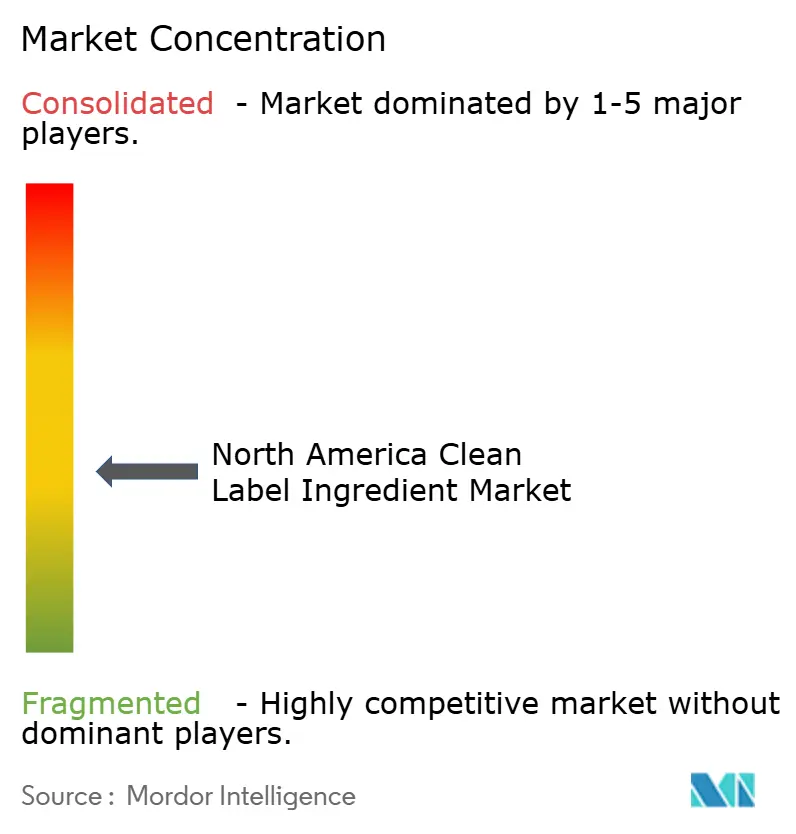
| Market Concentration | Medium |
Major Players
*Disclaimer: Major Players sorted in no particular order Image © Mordor Intelligence. Reuse requires attribution under CC BY 4.0. |
|
North America Clean Label Ingredient Market Analysis by Mordor Intelligence
The North America clean label ingredients market size is expected to grow from USD 17.12 billion in 2025 to USD 18.3 billion in 2026 and is forecast to reach USD 25.58 billion by 2031 at 6.92% CAGR over 2026-2031. Rising health awareness, regulatory tightening, and a growing demand for ingredient transparency continue to reposition the clean label ingredients market as a core enabler of food-manufacturing reform across North America. Federal initiatives such as the U.S. Food and Drug Administration’s (FDA) final “healthy” claim criteria and the pending phase-out of synthetic dyes by 2026 [1]Source: U.S. Food and Drug Administration, “Food Labeling – Regulations and Guidance,” fda.gov. Simultaneously, Canada's modernization of Food and Drug Regulations through the Canadian Food Compositional Standards framework eliminates outdated marketing authorizations while streamlining clean label compliance pathways [2]Source: Health Canada, “Food Compositional Standards Modernization,” canada.ca. As the clean label ingredients market evolves, regulatory standardization, improved biotechnology, and supply-chain localization collectively unlock opportunities for both large suppliers and agile start-ups that can deliver consistency, safety, and sensory performance without synthetics. Starting in 2024, the U.S. Department of Agriculture (USDA) is set to implement a final rule on organic labeling. This initiative underscores the significance of traceability and supply chain audits, aligning organic certification more closely with clean labeling standards. In a parallel development, food-tech start-ups are leveraging precision fermentation and enzymatic processing. They aim to craft label-friendly substitutes for traditionally synthetic additives, such as preservatives and emulsifiers.
Key report Takeaways
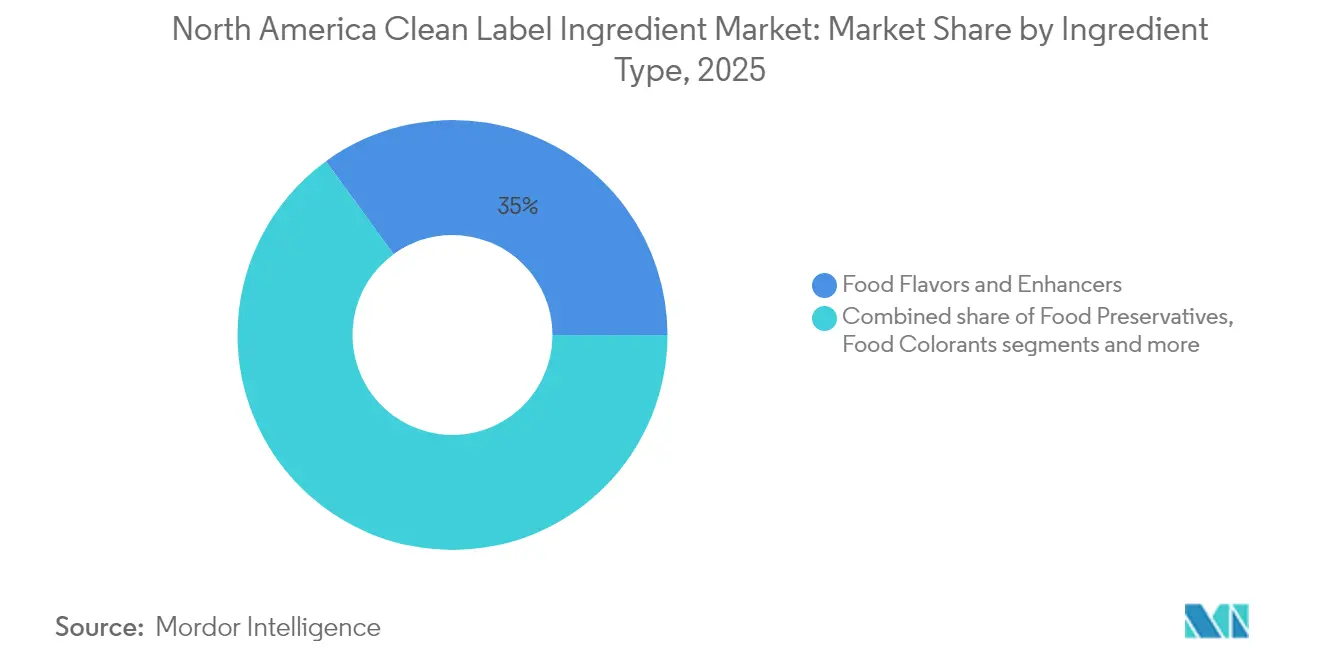
- By ingredient type, food flavors and enhancers led the North America clean label ingredients market with a 35.02% market share in 2025, and food colorants are projected to expand at a 7.27% CAGR from 2026 to 2031.
- By form, dry ingredients dominated the North America clean label ingredients market with a 57.64% share in 2025, while liquid formats are projected to grow at the fastest rate, with a 7.42% CAGR through 2031.
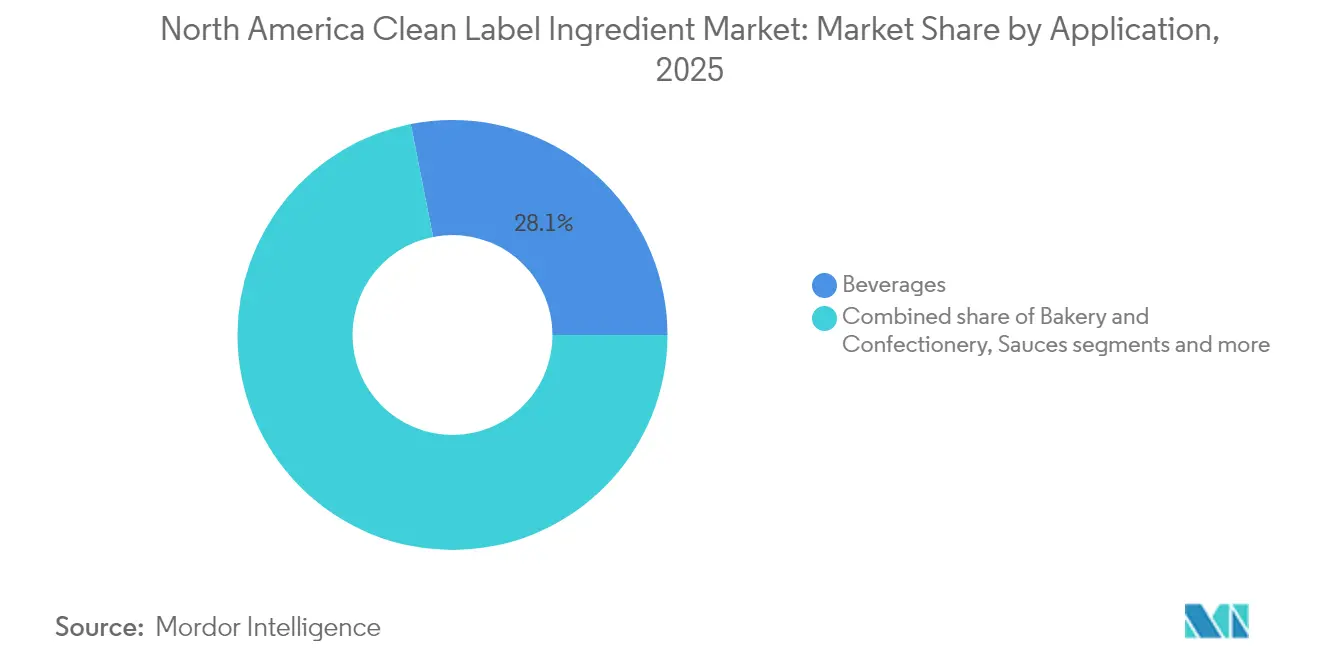
- By application, beverages accounted for 28.11% of the North America clean label ingredients market size in 2025; meat and meat products record the highest 7.66% CAGR outlook for 2026–2031.
- By geography, the United States captured 80.05% of the North America clean label ingredients market in 2025, whereas Canada is positioned for the fastest 7.98% CAGR through 2031.
Note: Market size and forecast figures in this report are generated using Mordor Intelligence’s proprietary estimation framework, updated with the latest available data and insights as of 2026.
North America Clean Label Ingredient Market Trends and Insights
Driver Impact Analysis*
| Driver | (~) % Impact on CAGR Forecast | Geographic Relevance | Impact Timeline |
|---|---|---|---|
| Consumer preference for clean-labelled foods | +1.2% | United States and Canada, expanding to Mexico | Medium term (2-4 years) |
| Rising demand for natural additives | +1.0% | North America-wide, strongest in US markets | Long term (≥ 4 years) |
| Increasing regulatory support and labelling standards | +0.8% | North America core, spillover to Mexico | Short term (≤ 2 years) |
| Inclination toward natural and plant-based Ingredients | +0.9% | North America-wide, with early gains in US, Canada | Medium term (2-4 years) |
| Popularity of sustainable and Ethical sourcing claims | +0.6% | United States and Canada markets | Long term (≥ 4 years) |
| Growing incidences food-allergies and sensitivities | +0.7% | North America-wide, concentrated in developed US and Canada | Medium term (2-4 years) |
| Source: Mordor Intelligence | |||
Consumer Preference for Clean-labelled Food Products
Consumer preference for clean-labeled food products drives fundamental shifts in purchasing behavior, where consumers prioritize clean ingredients in ready-to-drink beverages, with hydration-type drinks and juice categories leading in importance. This preference transcends simple ingredient avoidance to encompass environmental responsibility and supply chain transparency, creating a "second wave" of clean label demands that require manufacturers to demonstrate sustainable sourcing practices alongside ingredient simplification. The economic dimension reveals that nearly 90% of health-conscious consumers willingly pay premium prices for products delivering perceived health benefits, fundamentally altering pricing strategies across food categories as of 2024 [3]Source: Kemin Industries, "The Latest Condiment Trends Driving Consumer Purchasing Decisions," kemin.com.Demographic segmentation increasingly reveals that younger consumers, even amidst inflationary pressures that typically prioritize cost over quality, are placing a premium on ingredient transparency. A consumer's desire for control and clarity in food choices drives this clean label preference. Recognizable ingredients offer an emotional reassurance, a sentiment often absent with synthetic alternatives. Companies that adeptly communicate the origin and processing of their ingredients are not just gaining a competitive edge but are also fostering brand loyalty that remains steadfast, even in economically uncertain times.
Rising Demand for Natural Additives
Rising demand for natural additives accelerates as regulatory bodies systematically eliminate synthetic alternatives, with the Food and Drug Administration (FDA) approving three natural colors in 2025 to facilitate industry transition away from artificial dyes. Innovation in natural additive production leverages fermentation technologies, with companies like Phytolon achieving significant production increases through partnerships with Ginkgo Bioworks, demonstrating scalability potential for biotechnology-derived ingredients. Supply chain complexity for natural additives creates both opportunities and risks, as traditional plant-based extraction faces seasonality and quality variation challenges that fermentation-based alternatives can potentially overcome. Consumers increasingly recognize the connection between diet and health, leading them to carefully scrutinize food ingredients more thoroughly. Many consumers now make informed choices about their food consumption, actively avoiding artificial additives and preservatives commonly found in processed foods in favor of natural alternatives. According to the International Food Information Council, in 2024, 26% of respondents in the United States indicated that "Natural" best defines healthy food, while "NON-GMO" represented 14% [4]Source: International Food Information Council, "Food Insight, 2024 IFIC Food & Health SURVEY," foodinsight.org.
Increasing Regulatory Support and Labeling Standards
Regulatory bodies are tightening their grip on food labeling, reshaping how ingredients are chosen. The FDA has set a uniform compliance date of January 1, 2028, for food labeling regulations, which will be published between 2025 and 2026. In a bid to enhance transparency, the FDA has introduced front-of-package nutrition labeling requirements. These standards aim to guide consumers towards foods that meet dietary recommendations, pushing for clearer labeling and favoring 'clean label' formulations. Meanwhile, Canada is modernizing its regulations. Through the Canadian Food Compositional Standards framework, Canada is streamlining approvals for clean label ingredients by consolidating food additive provisions and removing redundant marketing authorizations. In Mexico, COFEPRIS has set forth stringent labeling mandates under NOM-051-SCFI/SSA1-2010. These include front-of-pack warnings for high nutrient content, echoing a regional push towards transparency. As countries worldwide impose taxes and marketing restrictions on ultra-processed foods, the spotlight shines on clean-label ingredients. No longer seen as mere enhancements, they're now viewed as essential compliance tools. Beyond labeling, regulatory bodies are also fast-tracking approvals for natural alternatives. The FDA's swift review of natural color additives underscores a broader commitment to transitioning from synthetic to natural ingredients.
Consumer Inclination Towards Natural and Plant-Based Ingredients
Consumer inclination towards natural and plant-based ingredients drives formulation innovations across traditional food categories, with the plant-based protein market continuing to expand as companies like NotCo utilize artificial intelligence to develop region-specific products. Mexico leads Latin America in plant-based diet preference, with the Vegan Entrepreneurs Association in Mexico (AEVM) reporting that approximately 30% of the country's population follows a flexitarian diet as of 2025. This trend creates market opportunities that extend beyond protein alternatives to encompass natural ingredient integration across food categories. Technical advancements in plant-based ingredient functionality address traditional performance limitations, exemplified by Cargill's development of plant-based cheese alternatives using pea protein and modified starches to replicate the texture and melting characteristics of dairy products. The sustainability dimension of natural ingredient preference creates competitive differentiation opportunities in the market. Innovation in natural ingredient extraction leverages non-thermal technologies, including ultrasonication and cold plasma, to preserve nutritional qualities while enhancing functional properties, particularly for hydrocolloids like chia seed mucilage that serve as natural stabilizers and fat replacers (RSC Publishing).
Restraints Impact Analysis*
| Restraint | (~) % Impact on CAGR Forecast | Geographic Relevance | Impact Timeline |
|---|---|---|---|
| High cost associated with natural ingredients | -0.9% | North America-wide, most acute in price-sensitive segments | Short term (≤ 2 years) |
| Ambiguity around clean label claims increases cost risk | -0.6% | United States and Canada regulatory jurisdictions | Medium term (2-4 years) |
| Complexity in achieving regulatory approvals for natural claims | -0.5% | North America-wide, varying by US, Canada, Mexico frameworks | Long term (≥ 4 years) |
| Inconsistent supply and quality of natural inputs | -0.8% | North America-wide, concentrated in agricultural regions | Medium term (2-4 years) |
| Source: Mordor Intelligence | |||
High Cost Associated with Natural Ingredients
High cost associated with natural ingredients creates margin pressure that forces strategic trade-offs between clean label positioning and price competitiveness, particularly as inflation drives consumers to prioritize cost over ingredient transparency. Natural ingredient production costs typically exceed synthetic alternatives by 10-15%, with additional volatility from agricultural supply chain dependencies that synthetic manufacturing processes avoid. The cost differential becomes particularly acute in commodity food categories where price sensitivity limits premium positioning opportunities, forcing manufacturers to absorb higher ingredient costs or risk market share loss to conventional alternatives. Supply chain complexity for natural ingredients requires specialized sourcing, processing, and quality control systems that generate additional operational expenses beyond raw material premiums, creating barriers to entry for smaller manufacturers lacking economies of scale. Innovation in cost reduction focuses on fermentation-based production methods that offer potential scalability advantages over traditional plant extraction, though initial capital investments and regulatory approval timelines delay cost parity achievement. The economic challenge intensifies during periods of agricultural volatility, where weather events or geopolitical disruptions can create sudden cost spikes that synthetic ingredient users can avoid through diversified chemical feedstock sources.
Ambiguity Around Clean Label Claims Increases Cost Risk
Regulatory support and evolving labeling standards are reshaping ingredient selection criteria. The Food and Drug Administration (FDA) has set January 1, 2028, as the compliance date for food labeling regulations, which will be published between 2025 and 2026. The FDA's proposed front-of-package nutrition labeling requirements aim to standardize interpretive information, guiding consumers toward foods that meet dietary recommendations. This move introduces transparency obligations, emphasizing the importance of clean label formulations. In Canada, the Canadian Food Compositional Standards framework is modernizing regulations by consolidating food additive provisions and removing redundant marketing authorizations. This accelerates the approval process for clean-label ingredients. Meanwhile, in Mexico, the Comisión Federal para la Protección contra Riesgos Sanitarios (COFEPRIS) enforces stringent labeling mandates under NOM-051-SCFI/SSA1-2010. These include front-of-pack warnings for high nutrient content, pushing for regional harmonization, and transparent ingredient strategies. Globally, there's a noticeable trend: countries are tightening oversight on ultra-processed foods, introducing taxes and marketing restrictions. This shift positions clean label ingredients as essential compliance tools rather than mere enhancements. Regulatory support isn't limited to labeling. The FDA's expedited review process for natural color additives underscores a broader commitment to transitioning from synthetic to natural ingredients.
*Our forecasts treat driver/restraint impacts as directional, not additive. The impact forecasts reflect baseline growth, mix effects, and variable interactions.
Segment Analysis
By Ingredient Type: Flavors Lead While Colors Accelerate
In 2025, food flavors and enhancers command a leading 35.02% market share, fueled by a growing preference for taste enhancement sans synthetic additives. Companies such as DSM, Givaudan, and Sensient Technologies are pioneering advanced encapsulation techniques, ensuring flavor stability and controlled release in clean label formats. Following closely, food preservatives leverage innovations like Syensqo's Riza, a rosemary-derived antioxidant, to extend shelf life in the meat, bakery, and beverage sectors. There's a consistent demand for food sweeteners, highlighted by Samyang Specialty’s Nexweet Allulose, which seamlessly replaces sugar in ice cream and other low-calorie treats. Hydrocolloids are gaining traction, with products like DSM's Gellaneer, a gellan gum, providing plant-based texture solutions as eco-friendly substitutes for carrageenan and gelatin.
Food colorants are set to be the fastest-growing segment, with projections indicating a 7.27% CAGR through 2031. This surge is largely attributed to regulatory measures phasing out petroleum-based synthetic dyes. The FDA's endorsement of natural alternatives, California's bans on synthetic colors, and the 2027 target for eliminating Red Dye No. 3 are steering manufacturers towards natural solutions. Companies like Michroma are leading the charge with fermentation-derived colors boasting enhanced stability, while Givaudan’s VegeBrite, sourced from fruits, vegetables, and algae, underscores the industry's pivot towards transparency and recognizable ingredients.


By Form: Liquid Growth Outpaces Dry Dominance
In 2025, dry ingredients command a 57.64% market share, bolstered by traditional food processing preferences and cost-effective logistics. Their extended shelf life, compatibility with current equipment, and reduced transportation costs position them as the top choice for preservatives, colorants, and flavor compounds in shelf-stable categories. This lead is particularly pronounced in the bakery and snack sectors, where dry ingredients bolster dough stability and mitigate moisture sensitivity. Furthermore, dry formulations present storage and distribution benefits, especially in export-driven markets with lengthy supply chains.
Liquid formulations, on the other hand, are on an upward trajectory, boasting a 7.42% CAGR through 2031. This growth is driven by the rise of functional beverages and processing innovations that boost solubility and ingredient stability. A prime example of this trend is LANXESS's Nagardo, a natural liquid preservative that thrives in low-pH settings, highlighting the industry's shift towards clean-label solutions. Liquid formats are increasingly favored in kombucha, probiotic beverages, and plant-based dairy products, areas where dry ingredients might impede fermentation or lead to sedimentation. Additionally, liquid formulations minimize dust exposure, enhance mixing consistency, and seamlessly fit into continuous production lines.
By Application: Beverages Dominate as Meat Products Surge
In 2025, beverages lead the pack with a commanding 28.11% market share, buoyed by surging consumer appetite for clean-label drinks and a shift towards natural colors. As regulators push to eliminate synthetic dyes, companies like PepsiCo are swiftly reformulating, pivoting to natural ingredients in their flagship products. Natural preservatives are proving their mettle, especially in acidic beverages. Solutions like Nagardo not only offer broad-spectrum microbial control but also ensure pH stability ranging from 2.5 to 7. Meanwhile, the bakery and confectionery sector, holding the second spot in market share, is witnessing a clean-label revolution.
Meat and meat products are on a growth trajectory, boasting an 7.66% CAGR through 2031. This surge is largely attributed to breakthroughs in natural preservation technologies that uphold food safety while adhering to clean-label norms. For instance, Corbion’s Origin portfolio harnesses plant-based antioxidants from rosemary and acerola extracts, extending shelf life by curbing oxidation all without the use of synthetic nitrites. In the dairy and frozen dessert realm, clean-label hydrocolloids like TIC Gums’ Ticaloid Ultrasmooth are making waves, bolstering mouthfeel and protein stability in non-GMO products. Sauces and condiments are also riding the growth wave, with manufacturers delving into natural preservation and flavor enhancement to align with clean label criteria.
Geography Analysis
The United States remains the anchor of the North America clean label ingredients market, accounting for 80.05% of regional revenue in 2025. Federal commitments to remove synthetic dyes by 2026, coupled with front-of-pack disclosures, spur widespread reformulation. Multinational food brands often upgrade entire North American portfolios to satisfy California’s stricter statutes, driving volume upside for qualified natural-ingredient vendors. Comprehensive research and development hubs across Illinois, Minnesota, and New Jersey enable rapid sensory trials, reducing commercialization timelines.
Canada is forecast to post an 7.98% CAGR during 2026-2031, the highest in North America. Health Canada’s revised Food Compositional Standards eliminate redundant approvals and align additive definitions with Codex norms, cutting dossier preparation time. Cross-border ingredient harmonization facilitates bulk purchasing, helping Canadian processors mitigate cost premiums. Retailers increasingly stock bilingual “natural” claims, enhancing consumer trust and fueling growth for both domestic and U.S. vendors in the clean label ingredients market.
Mexico, governed by NOM-051-SCFI/SSA1 and the 2024 General Law on Appropriate and Sustainable Food, adopts bold black-octagon warning labels for sugar, sodium, and trans-fat thresholds. Brands swapping synthetic stabilizers for botanical gums gain compliance and consumer favor, especially among the country’s expanding flexitarian population. Mexico’s regulatory trajectory positions it as a strategic expansion target for flavor houses and fermentation start-ups seeking first-mover advantages in Latin America.
Competitive Landscape
The North America clean label ingredients market demonstrates moderate fragmentation, with global major players such as Archer Daniels Midland, Cargill Inc., Kerry Group, and Tate & Lyle PLC holding major portfolios. The need for diversified botanical sources and complex certification schemes tempers scale advantages.
Therefore, innovation and regulatory fluency outweigh pure capacityTate & Lyle’s USD 1.8 billion purchase of CP Kelco expanded its pectin and specialty-gum capabilities, fortifying its natural-texture toolkit. Louis Dreyfus Company’s agreement to acquire BASF’s Food and Health performance ingredients underlines commodity traders’ push into value-added, label-friendly additives.
Emerging challengers exploit white-space using precision fermentation. Chromologics produces vibrant azaphilone pigments with superior pH stability, while Bountica engineers tasteless proteins that suppress Listeria through “nutritional immunity.” Strategic alliances with co-manufacturers help start-ups overcome scale barriers, reflecting a broader trend toward open-innovation consortia inside the North America clean label ingredients market.
North America Clean Label Ingredient Industry Leaders
-
Cargill Inc.
-
Archer Daniels Midland Company
-
Kerry Group PLC
-
Ingredion Incorporated
-
Tate & Lyle PLC
- *Disclaimer: Major Players sorted in no particular order

Recent Industry Developments
- April 2025: Gum Products International (GPI) established an Innovation Centre in Newmarket, Ontario, focusing on developing clean-label ingredient solutions for the gum and confectionery industry. The facility features laboratory and pilot-scale equipment to support research and development across multiple food segments, including bakery, beverages, dairy, and meat products.
- October 2024: Green Plains Inc. commissioned the first commercial Clean Sugar Technology (CST) facility in Shenandoah, Iowa. The facility, utilizing a patented process from Fluid Quip Technologies, produces dextrose and glucose syrups with up to 40% lower carbon intensity compared to conventional wet-milling methods.


North America Clean Label Ingredient Market Report Scope
The North America clean label ingredients market report includes a study on segmentation by type, which is segmented by color, flavor, starch and sweetener, natural preservative, and other types. Based on the application, the market has been segmented into beverage, bakery and confectionery, sauce and condiment, dairy and frozen dessert, processed food, and other applications. Based on the geography, the regional analysis of the clean labeled ingredients market is also being included in the report.
By Ingredient Type
| Food Preservatives |
| Food Sweeteners |
| Food Colorants |
| Food Hydrocolloids |
| Food Flavors and Enhancers |
| Other Ingredients Types |
By Form
| Dry |
| Liquid |
By Application
| Bakery and Confectionery |
| Dairy and Frozen Desserts |
| Beverages |
| Meat and Meat Products |
| Sauces, and Condiments |
| Other Applications |
By Geography
| United States |
| Canada |
| Mexico |
| Rest of North America |
| By Ingredient Type | Food Preservatives |
| Food Sweeteners | |
| Food Colorants | |
| Food Hydrocolloids | |
| Food Flavors and Enhancers | |
| Other Ingredients Types | |
| By Form | Dry |
| Liquid | |
| By Application | Bakery and Confectionery |
| Dairy and Frozen Desserts | |
| Beverages | |
| Meat and Meat Products | |
| Sauces, and Condiments | |
| Other Applications | |
| By Geography | United States |
| Canada | |
| Mexico | |
| Rest of North America |


Key Questions Answered in the Report
What is the current value of the North America clean label ingredients market?
The North America clean label ingredients market size stands at USD 18.3 billion in 2026 with a projected rise to USD 25.58 billion by 2031, reflecting a 6.92% CAGR over 2026-2031.
Which segment holds the largest share within the North America clean label ingredients market?
Food flavors and enhancers account for 35.02% of 2025 revenue, maintaining the largest slice of the market.
Why are Food Colorants the fastest-growing ingredient category?
Federal and state bans on artificial dyes require brand reformulation, boosting demand for botanically or fermentation-derived pigments and driving a 7.27% CAGR for natural colorants through 2031.
Which geographical market shows the highest growth potential?
Canada leads growth with an 7.98% CAGR outlook as regulatory harmonization and consumer health awareness align to favor natural ingredient adoption through 2031.
Page last updated on:


