
Market Overview
| Study Period | 2021 - 2031 |
|---|---|
| Forecast Data Period | 2026 - 2031 |
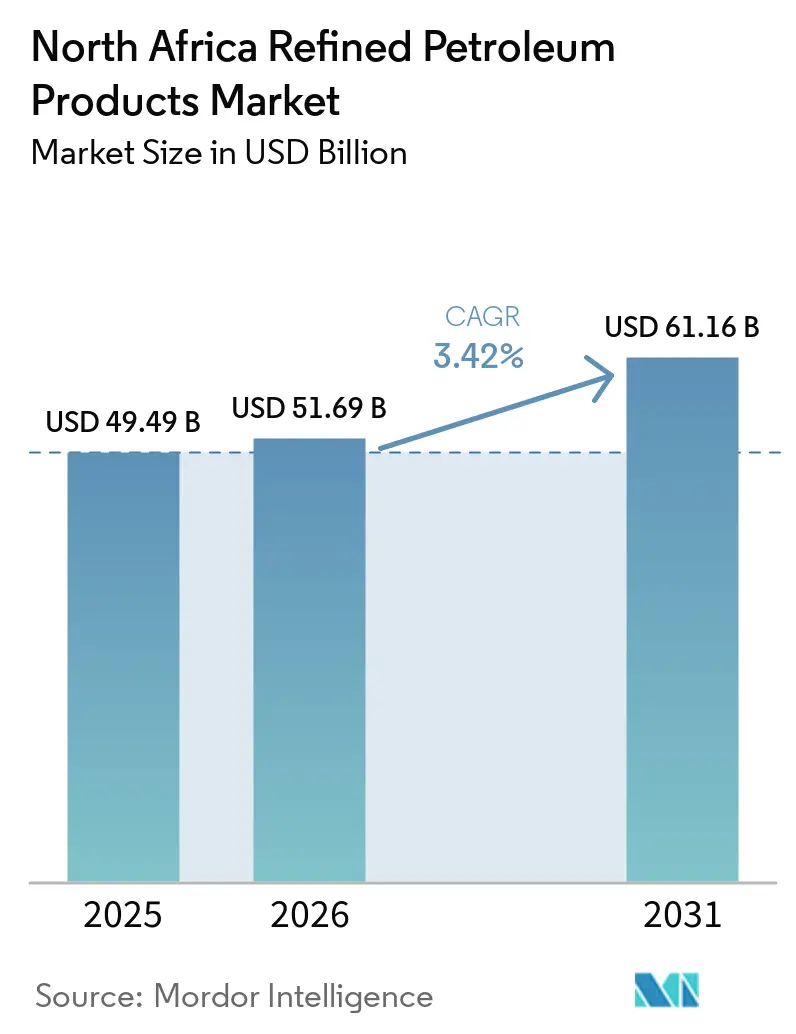
| Base Year Market Size (2025) | USD 49.49 Billion |
| Market Size (2026) | USD 51.69 Billion |
| Market Size (2031) | USD 61.16 Billion |
| Growth Rate (2026 - 2031) | 3.42 % |
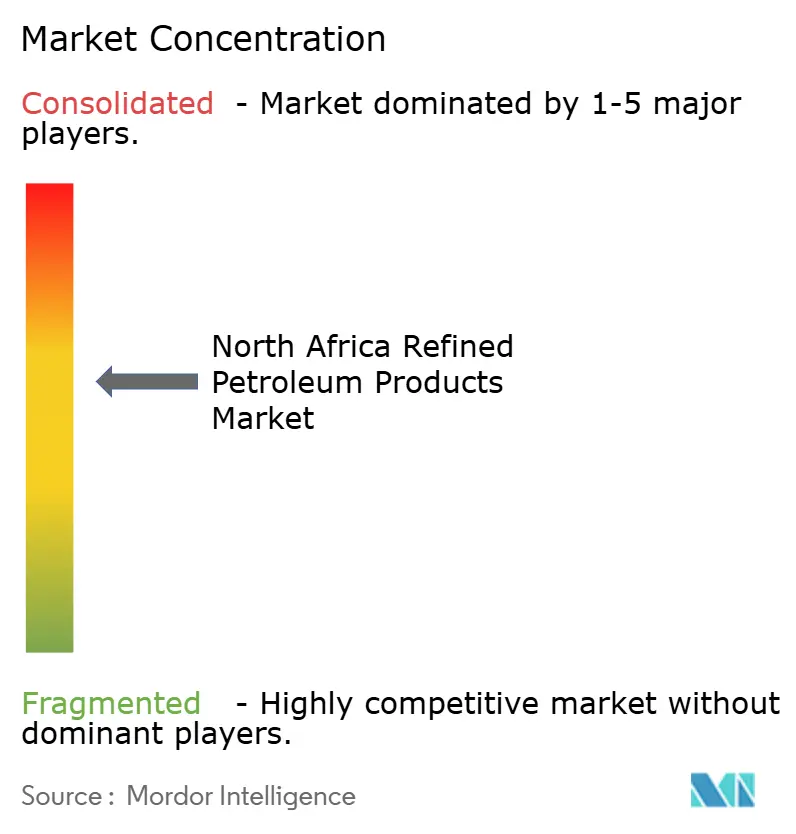
| Market Concentration | Medium |
Major Players *Disclaimer: Major Players sorted in no particular order Image © Mordor Intelligence. Reuse requires attribution under CC BY 4.0. | |
North Africa Refined Petroleum Products Market Analysis by Mordor Intelligence
The North Africa Refined Petroleum Products Market size is expected to increase from USD 49.49 billion in 2025 to USD 51.69 billion in 2026 and reach USD 61.16 billion by 2031, growing at a CAGR of 3.42% over 2026-2031. The expansion comes from refinery upgrades, subsidy reform, and new petrochemical offtake that re-route feedstock flows while cushioning upstream volatility. Egypt, Algeria, and Morocco are modernizing existing complexes, adopting Euro 5 standards, and positioning coastal ports as compliant bunkering hubs, moves that sustain demand for low-sulfur middle distillates. Aviation fuel is the fastest-growing product as passenger traffic rebounds across Cairo, Casablanca, and Marrakech airports, while diesel continues to dominate road freight and farm activity. Petrochemical integration is steadily lifting internal naphtha and LPG requirements. At the same time, rising EU and Middle-East exports keep regional pricing competitive, forcing local refiners to raise complexity and improve margin capture. Heightened geopolitical risk in Libya and deeper power-sector fuel switching to gas and renewables temper overall growth, but do not derail the upward trajectory of the North Africa refined petroleum products market.
Key Report Takeaways
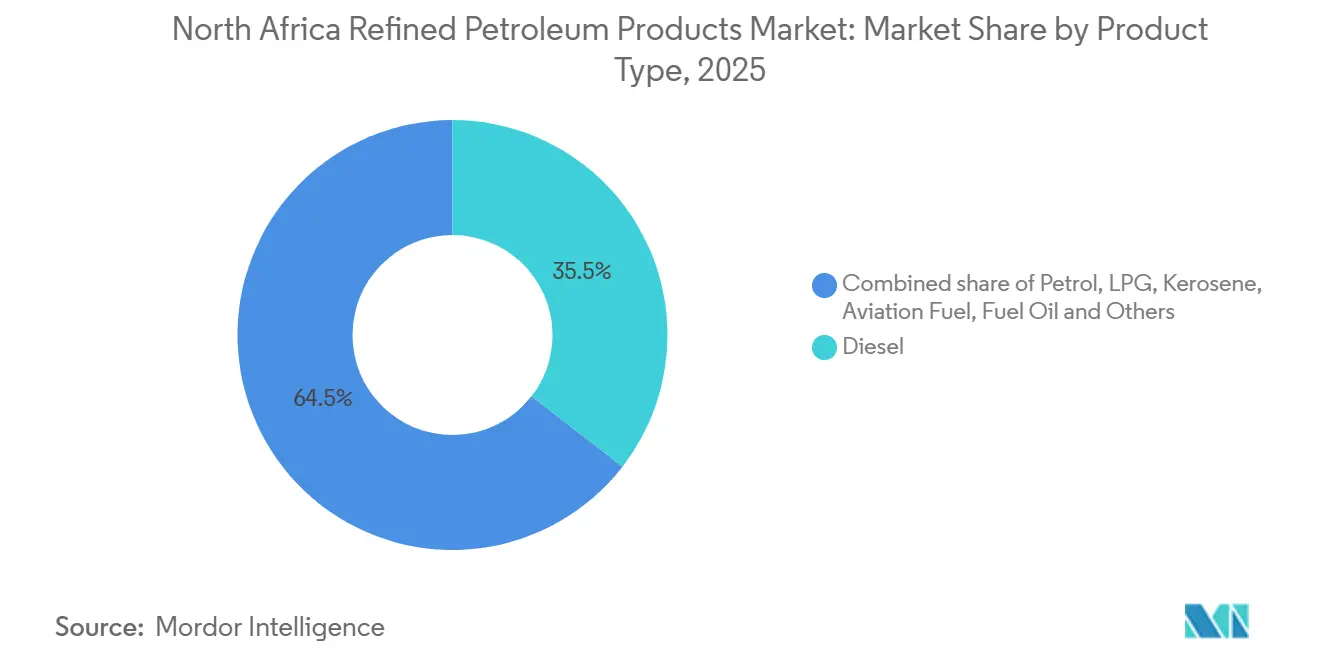
- By product type, diesel held 35.5% of the North Africa refined petroleum products market size in 2025; aviation fuel exhibits the highest projected CAGR at 6.5% to 2031.
- By sulfur content, low-sulfur grades captured 58.1% share of the North Africa refined petroleum products market size in 2025 and are advancing at a 5.3% CAGR to 2031.
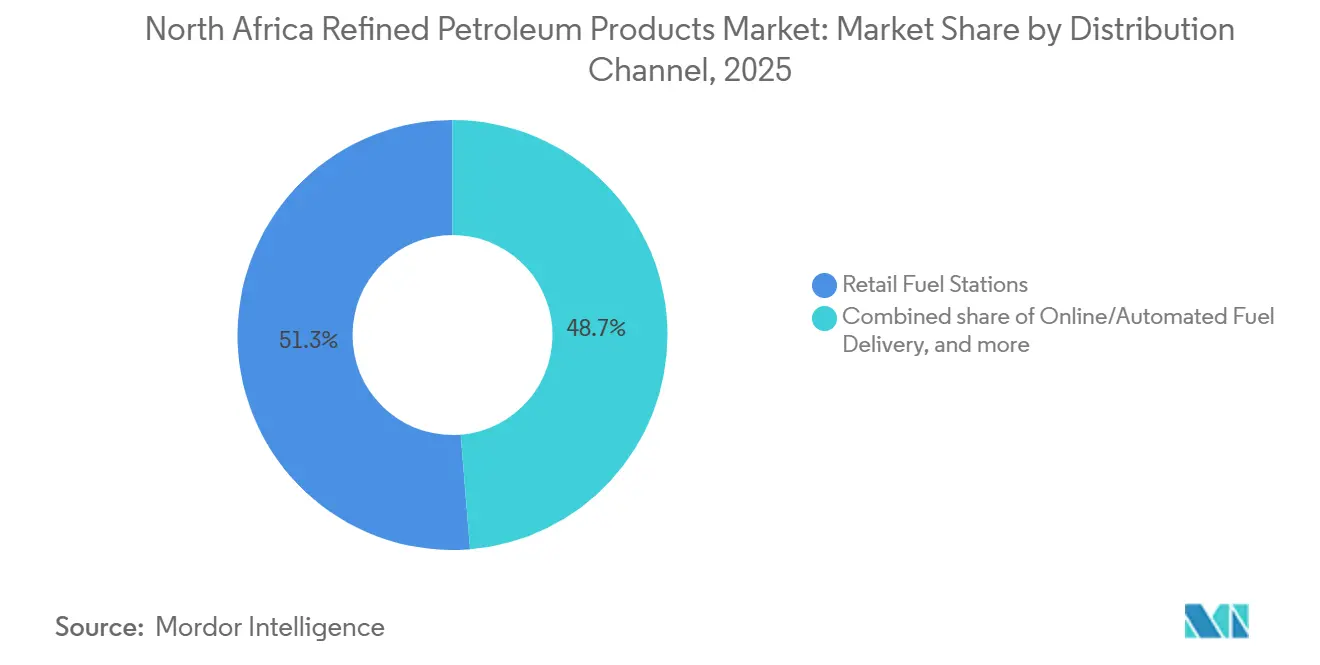
- By distribution channel, retail fuel stations controlled 51.3% of 2025 volume; online and automated delivery platforms are expanding at a 7.1% CAGR to 2031.
- By end-use sector, transportation accounted for a 55.9% share of the North Africa refined petroleum products market size in 2025, and petrochemicals are set to grow at a 6.8% CAGR through 2031.
- By geography, Egypt led with a 39.7% North Africa refined petroleum products market share in 2025, while its own segment is forecast to expand at a 5.2% CAGR through 2031.
Note: Market size and forecast figures in this report are generated using Mordor Intelligence’s proprietary estimation framework, updated with the latest available data and insights as of January 2026.
North Africa Refined Petroleum Products Market Trends and Insights
Drivers Impact Analysis*
| Driver | (~) % Impact on CAGR Forecast | Geographic Relevance | Impact Timeline |
|---|---|---|---|
| Vehicle-fleet growth boosts transport fuel demand | 1.2% | Egypt, Algeria, Morocco - urban corridors and cross-border freight routes | Medium term (2-4 years) |
| Refinery upgrades & capacity expansions (Egypt, Algeria) | 1.0% | Egypt (MIDOR, Assiut, Alexandria Petroleum), Algeria (Hassi Messaoud, Skikda) | Long term (≥ 4 years) |
| Gradual subsidy reform improving downstream economics | 0.8% | Egypt, Libya - fiscal consolidation under IMF programs | Medium term (2-4 years) |
| Port-led bunkering hub strategy post-Mediterranean ECA 0.1% S cap | 0.6% | Egypt (Alexandria, Suez, Port Said), Algeria (Oran, Skikda) | Short term (≤ 2 years) |
| New petrochemical complexes raising naphtha/LPG offtake | 0.7% | Egypt (Carbon Holdings, SIDPEC, Red Sea National Refining), Algeria (Sonatrach Arzew) | Long term (≥ 4 years) |
| Source: Mordor Intelligence | |||
Vehicle-Fleet Growth Boosts Transport Fuel Demand
Continued urbanization, stronger tourism flows, and expanding cross-border freight routes are lifting gasoline, diesel, and jet-fuel consumption. Egypt’s target of 30 million tourists by 2028 widens rental-car fleets and inter-city coach services, while Morocco’s aviation hubs posted double-digit traffic gains in 2024. Algeria’s Naftal distributed 13.3 million tonnes of fuels in 2024 and expects steady growth as it reorganizes products and channels. Fuel subsidies in Libya still absorb 35% of GDP, encouraging smuggling that artificially inflates regional demand statistics and keeps refinery throughputs elevated. Despite ongoing power fuel switching, transport remains resilient, reinforcing a positive volume outlook for the North Africa refined petroleum products market.
Refinery Upgrades and Capacity Expansions
Egypt invested roughly USD 8 billion in its downstream over the past decade, including MIDOR’s USD 2.7 billion expansion, Assiut’s USD 1.5–3 billion hydrocracker, and Alexandria Petroleum debottlenecking. Combined projects lift national capacity toward 900,000 barrels per day by 2027. Algeria’s 110,000-barrel-per-day Hassi Messaoud refinery broke ground in 2025 and complements Sonatrach’s revitalized Skikda and Arzew plants. Raised complexity boosts white-product yields and Euro 5 compliance, shrinking import dependence and setting the stage for export arbitrage within the North Africa refined petroleum products market.
Gradual Subsidy Reform Improving Downstream Economics
Egypt increased pump prices by up to 15% during 2024-25 and moved to cash transfers by mid-2025 under its IMF program. Narrower parity gaps lift refinery margins and attract private investment, such as Qalaa Holdings’ USD 200 million Mostorod Phase 2 expansion. Libya’s generous subsidy regime still distorts trade flows, while Algeria maintains low domestic prices to preserve social stability. The divergence channels capital toward Egypt and limits private initiatives elsewhere, shaping competitive dynamics in the North Africa refined petroleum products market.
Port-Led Bunkering Hub Strategy After Mediterranean 0.1% Sulfur Cap
IMO rules effective May 2025 require 0.1% sulfur marine fuel in the Mediterranean.[1] Egypt enforced compliance at Alexandria, Suez, and Port Said, leveraging its Suez Canal traffic to capture incremental bunkering demand. Established storage and blending assets allow rapid scale-up of very-low-sulfur fuel oil and marine gasoil, diverting volumes from European ports and lifting the overall CAGR of the North Africa refined petroleum products market.
Restraints Impact Analysis*
| Restraint | (~) % Impact on CAGR Forecast | Geographic Relevance | Impact Timeline |
|---|---|---|---|
| Political-security disruptions curbing Libyan crude feedstock | -0.5% | Libya (Zawiya, Ras Lanuf refineries), regional crude export terminals | Short term (≤ 2 years) |
| Import competition from surplus EU & Middle-East products | -0.4% | Morocco, Tunisia, Libya - import-dependent markets | Medium term (2-4 years) |
| Power-sector fuel-switching to gas & renewables cuts FO/diesel demand | -0.3% | Egypt, Algeria - grid-connected generation and industrial captive power | Long term (≥ 4 years) |
| Source: Mordor Intelligence | |||
Political-Security Disruptions Curbing Libyan Crude Feedstock
Zawiya refinery halted operations in December 2024 after armed clashes destroyed storage tanks, mirroring previous outages that slashed national output by 63% in August 2024. Repeated force majeure erodes feedstock supply, forces higher imports, and pushes refiners in neighboring states to source costlier barrels, hindering the growth of the North Africa refined petroleum products market.
Import Competition from Surplus EU and Middle-East Products
EU exports worth USD 3.9 billion to Libya, USD 3.1 billion to Morocco, and USD 2.0 billion to Egypt in 2023 illustrate the scale of external inflows. Oversupply from European and Gulf mega-refineries depresses regional prices and limits local expansion viability.
*Our forecasts treat driver/restraint impacts as directional, not additive. The impact forecasts reflect baseline growth, mix effects, and variable interactions.
Segment Analysis
By Product Type: Aviation Fuel Outpaces Diesel Growth
Aviation fuel volume expands at a 6.5% CAGR between 2026 and 2031 as Cairo, Casablanca, and Marrakech airports add gates and carriers. Diesel retained the largest slice at 35.5% of the North Africa refined petroleum products market size in 2025, but its 4.5% growth trails jet fuel because power-generation displacement offsets freight gains. Petrol follows overall demand, LPG holds niche cooking and rural roles, and fuel oil contracts under emission curbs. Bitumen and naphtha rise with road building and petrochemical feedstock pull. The strategic trade-off pushes refiners to maximize middle distillates, underpinning profitability across the North Africa refined petroleum products market.
Egypt’s aim for 30 million tourists by 2028 implies roughly 1.5 million tonnes of incremental jet fuel that MIDOR and Assiut must meet, encouraging further hydrotreating investments. Premium jet margins and stable airline contracts make kerosene optimization a top priority within the North Africa refined petroleum products industry.

By Sulfur Content: Low-Sulfur Dominance Reflects Regulatory Tightening
Low-sulfur grades captured 58.1% share in 2025 and are projected to expand at a 5.3% CAGR through 2031 as Egypt and Morocco enforce Euro 5 standards.[2] Algeria moves gradually yet plans full alignment post-2027, while Tunisia and Libya lag. High-sulfur fuels rise just 3.8% amid marine sulfur caps and shrinking power-sector usage. Complex refineries with hydrotreaters seize premium margins, whereas older topping plants risk stranded status unless modernized. This divergence drives technology uptake and capital flows across the North Africa refined petroleum products market.
By Distribution Channel: Digital Platforms Disrupt Retail Networks
Traditional stations still moved 51.3% of 2025 volumes, but online and automated delivery posts a 7.1% CAGR through 2031 as corporate fleets adopt cashless fuel cards and mobile apps. NaftalCard’s January 2025 launch exemplifies the shift, mirrored by pilots from Vivo Energy and TotalEnergies. Digital entrants capture data, reduce shrinkage, and rationalize logistics, eroding forecourt volumes in urban hubs. Retail operators add non-fuel conveniences and loyalty programs to defend their share in the North Africa refined petroleum products market.
By End-Use Sector: Petrochemicals Surge as Power Demand Wanes
Transportation absorbed 55.9% of 2025 demand and advances 4.8% yearly, but petrochemicals lead at 6.8% thanks to USD 14 billion of greenfield crackers in Egypt and Algeria. Power generation retreats at -1.0% CAGR as gas and renewables gain. Industrial, residential, and commercial segments post moderate 3–4% growth. Marine and bunkering climb 5.5% on ECA compliance, enhancing port revenues and consolidating Egypt’s role within the North Africa refined petroleum products market.
Geography Analysis
Egypt accounts for the largest slice of the North Africa refined petroleum products market and shows the fastest growth. Refinery capacity will reach 900,000 barrels per day by 2027 after modernization at MIDOR, Assiut, and Egyptian Refining Company.[3] Retail price alignment under subsidy rollback improves margins and crowds in private capital. Ports along the Suez Canal secure bunkering business after the 0.1% sulfur ceiling, boosting marine fuel throughput. Tourism and petrochemicals provide durable demand engines, giving Egypt a sustained 5.2% CAGR.
Algeria ranks second with roughly 28% of demand and a 4.5% CAGR. Sonatrach achieved refined-product self-sufficiency in 2023, freeing capacity for export once Hassi Messaoud starts up in 2027. Continued upstream investment by Eni and Sinopec safeguards crude supply, while inland plants extend coverage to the south. Low domestic pump prices maintain consumption, but delayed subsidy reform may restrain private downstream participation in the North Africa refined petroleum products market.
Libya contributes 18% yet rises only 3.5% annually due to chronic insecurity. Zawiya outages compel imports despite 380,000 barrels per day of nameplate capacity. The resulting reliance on European cargoes undercuts domestic margins and blunts growth prospects. Morocco holds a 10% share and grows 4.0% on tourism and mining, but the absence of refining keeps it vulnerable to global price swings. Tunisia and the rest of North Africa together account for about 6% and show sub-4% growth, given limited infrastructure and lower purchasing power.
Regulatory Landscape
Downstream regulation across North Africa is shaped by state control over licensing, pricing mechanisms, and fuel-quality compliance. In Egypt, the Ministry of Petroleum and Mineral Resources sets petroleum products pricing rules and sector governance through state holding entities such as EGPC, EGAS, and GANOPE, which influences how refiners and marketers access infrastructure and the domestic market. Fuel-specification tightening is also changing compliance requirements, including the Mediterranean Sulphur Oxides Emission Control Area (Med SOx ECA) requirement effective May 2025 for 0.1% sulfur marine fuels, which has increased the need for verifiable low-sulfur supply at bunkering ports.
In Algeria, the hydrocarbons framework under Law No. 19-13 defines the roles of ALNAFT (National Agency for the Valorisation of Hydrocarbon Resources) and the Hydrocarbon Regulatory Authority, reinforcing state-led oversight for investment approvals and operational compliance. Libya keeps centralized authority within the Ministry of Oil and Gas under Decree No. (32) of 2012, including the ability to set market policies and approve crude and product pricing rules. Morocco requires government authorization (agrement) for import, storage, and distribution of liquid petroleum products. Together, these frameworks support higher value for compliant refining upgrades, traceable distribution controls (including monitored pipelines and terminals), and documentation for import and bunkering activities across the region.
Competitive Landscape
The North Africa refined petroleum products market is moderately concentrated. State-owned Sonatrach, Egyptian General Petroleum Corporation, and Libya National Oil Corporation dominate throughput and logistics, while TotalEnergies, Shell, and Eni emphasize upstream and selective downstream links. Upgrades at MIDOR and Assiut embed Honeywell UOP and TechnipFMC technology that raises complexity and assures Euro 5 output, amplifying competitive gaps against legacy skimming plants.[4] International majors channel capital toward integrated gas and petrochemical schemes, seeking higher margins than basic fuels. Niche challengers such as Qalaa Holdings and Shard Capital focus on refining-petrochemical hybrids offering flexibility and export optionality.
Retail distribution sees Vivo Energy, Puma Energy, and Naftal scale digital solutions for fleets. Morocco and Tunisia, lacking domestic refineries, are prime targets for import-terminal or greenfield complex proposals. Success hinges on political stability, feedstock security, and alignment with tightening environmental norms that underpin value accrual in the North Africa refined petroleum products market.
North Africa Refined Petroleum Products Industry Leaders
-
Sonatrach SPA
-
Royal Dutch Shell Plc
-
Egyptian General Petroleum Corporation
-
TotalEnergies SE
-
Exxon Mobil Corporation
- *Disclaimer: Major Players sorted in no particular order
Market Opportunities and Future Outlook
North Africa's clearest opportunity is at the intersection of cleaner fuel specifications and supply security. Investments that expand hydrotreating, reforming, and blending capacity help build the low-sulfur product pool needed for compliant marine fuels following the Med SOx ECA sulfur limit (effective May 2025). Recent activity cited in the research supports this direction, including Sonatrach contracting SINOPEC Guangzhou Engineering (November 2025) for a hydrotreating and CCR reforming unit at Arzew to expand gasoline production, and Egypt pursuing multiple refinery development projects (exceeding USD 4 billion, per the Ministry of Petroleum and Mineral Resources) aimed at raising domestic output and reducing import exposure.
A second opportunity cluster is centered on rebuilding and professionalizing supply in markets that are either import-dependent or disrupted, especially Libya. Rehabilitation and project-services work has re-emerged, with KBR securing a project management and technical services contract for the South Refinery Project in Ubari in March 2026, and Libya's National Oil Corporation reclaiming full control of the Ras Lanuf refinery complex in May 2026. These steps reopen pathways for capacity restoration and more stable domestic product availability. In parallel, digitization in distribution and fleet fueling, including NaftalCard in Algeria, offers a practical way to reduce cash handling and losses in retail and commercial channels, improving throughput logistics and demand visibility for refiners and marketers.
Recent Industry Developments
- June 2026: EGPC initiated an expansion and maintenance project at a Cairo Petroleum Refining Company unit, targeting a reduction in Egypt's petrol import bill by nearly USD 70 million per month. The move shows how refinery reliability and debottlenecking are being used as near-term economic levers to support higher local supply of compliant transport fuels.
- November 2025: Sonatrach signed a contract with SINOPEC Guangzhou Engineering to build a hydrotreating unit and CCR-type reforming unit at the Arzew refinery, expanding gasoline production capacity from 550,000 tonnes to 1.2 million tonnes per year. This supports Algeria's broader upgrading program by adding capacity for higher-yield gasoline production.
- November 2024: Egyptian Refining Company (Qalaa Holdings) announced a USD 200 million Phase 2 investment to expand refining capacity by 600,000 tonnes per annum. The announcement reinforces Egypt's shift toward higher-complexity refining assets and greater domestic product availability.
Research Methodology Framework and Report Scope
Market Definition and Coverage
For this study, the market covers the sales value of refined petroleum products consumed within North Africa, priced at the point of sale through retail, bulk, or direct channels across the covered countries.
Scope exclusions: Crude oil production and upstream services are excluded, and non-fuel refinery byproducts are only counted if they are sold as refined petroleum products in-scope.
Segmentation Overview
- By Product Type
- Petrol (Gasoline)
- Diesel
- LPG
- Kerosene
- Aviation Fuel
- Fuel Oil (HSFO, VLSFO)
- Others (Bitumen, Naphtha)
- By Sulfur Content
- Low-Sulfur (Up to 10 ppm)
- High-Sulfur (Above 10 ppm)
- By Distribution Channel
- Retail Fuel Stations
- Commercial Bulk Sales
- Direct Supply Contracts
- Online/Automated Fuel Delivery
- By End-Use Sector
- Transportation
- Power Generation
- Industrial Manufacturing
- Petrochemicals
- Residential and Commercial
- Marine and Bunkering
- Agriculture and Mining
- By Geography
- Algeria
- Egypt
- Libya
- Morocco
- Tunisia
- Rest of North Africa
Data Sources, Market Sizing, and Validation
Desk Research
Desk research starts by building a clean view of the regional demand and supply context, and then narrowing it to refined product consumption and trade flows that can be tracked consistently year to year. We leaned on non-paywalled public sources such as OPEC publications, the IEA's public statistics pages, UN Comtrade trade tables, World Bank indicators, and national statistics or energy ministry releases from countries in North Africa.
These inputs are then complemented with company annual reports, investor presentations, refinery operator updates, and trusted press coverage to confirm operating changes that influence availability and pricing. In parallel, we also used paid subscriptions for company financials and intelligence, and for shipment level import and export checks where clarity was needed on product movement. The desk sources listed are indicative and not exhaustive, since many other public documents were used for data collection, cross-checks, and clarification.
Primary Interviews and Surveys
Primary work was used to pressure test the demand pool by product and country, and to verify pricing logic across retail and bulk channels before the model was finalized. We spoke with a mix of refiners, distributors, large buyers, and downstream logistics or storage stakeholders across North Africa so gaps from public datasets could be filled in a practical way.
Distribution of primary research fieldwork respondents
| Company type | Respondent position |
|---|---|
| Top tier: 37% | CXOs: 16% |
| Mid tier: 47% | Functional/Unit leaders: 24% |
| Smaller Players: 16% | Managers: 60% |
Market-Sizing & Forecasting
Sizing starts with a top-down build that reconstructs refined product demand using country level consumption signals, refinery availability, and trade balances, and then converts that demand into value using observed price ranges by product group. To keep the totals grounded, we corroborate them using selective bottom-up approximations such as sampled volume by channel, typical product mix shares, and cross-checks against distributor and refinery scale reported in public materials.
Key inputs used in the model include: refinery throughput and operating status changes, import and export volumes by product category, retail versus bulk channel split, indicative price spreads across petrol, diesel, LPG, kerosene, aviation fuel, and fuel oil, and demand movements tied to transport activity and power generation fuel use. When data is missing for a country or a specific product line, we fill gaps using nearest-neighbor proxies within North Africa and then re-test those assumptions through interview feedback.
For forecasting, scenario analysis is used so the model can reflect realistic shifts in utilization, product substitution, and price direction without overfitting thin datasets. The forward view is then tuned using what interviewees expect for supply reliability, import dependence, and demand stability in key consuming sectors over the forecast window.
Data Validation & Update Cycle
Outputs are validated through triangulation across independent signals, and then checked for spikes that do not align with known events like refinery turnarounds, policy changes, or abnormal trade swings. A second analyst review is completed for the assumptions behind volumes, channel splits, and pricing, and any large variance triggers re-contact with selected respondents to confirm what changed and why.
Reports are refreshed annually, and interim updates are made if a material event occurs that can shift regional supply or demand, such as a major outage, commissioning, or trade disruption. Before delivery, a fresh analyst pass is performed so the final numbers reflect the latest available public releases and field feedback.
Mordor Intelligence's North Africa Refined Petroleum Products Market Size Versus Other Published Estimates
Published market values for North Africa refined petroleum products can look far apart because the underlying scope and conversion logic often differ, even when the titles sound similar. Differences usually come from what is counted as a refined product sale, how retail and bulk pricing is applied, and how imports and domestic refining are reconciled.
Some estimates roll the broader downstream chain into the figure, such as storage, distribution margins, and sometimes even retail station activity. For Mordor Intelligence, the value is counted as refined petroleum product sales in North Africa, with product level pricing aligned to country demand signals and validated against trade and refinery availability checks.
Benchmark comparison
| Source | Market Size | Gaps in Research Methodology |
|---|---|---|
| Mordor Intelligence | USD 51.69 B (2026) | |
| Industry Portal A | USD 611.94 B (2021) | Uses an unusually broad value pool for the region and appears to apply high-level macro scaling without a consistent product level pricing and trade balance reconciliation, which can inflate totals and shift the base year context. |
| Industry Research Blog B | USD 50.00 B (2024) | Uses an Africa-wide headline and a simplified single value point, with limited transparency on which North Africa countries and product categories are included, and whether channel pricing differences are captured. |
The spread in the table mostly comes down to scope and how volumes are converted into value across products and channels. By tying the model to refinery availability, import and export movements, and product mix pricing checks, the final number remains easier to trace and repeat when assumptions are updated.
Key Questions Answered in the Report
What is the current value of the North Africa refined petroleum products market?
The market is valued at USD 51.69 billion in 2026 and is projected to reach USD 61.16 billion by 2031.
Which country leads demand in North Africa for refined products?
Egypt dominates with 39.7% regional demand in 2025 and posts the fastest growth at a 5.2% CAGR through 2031.
Which product segment grows the fastest?
Aviation fuel records a 6.5% CAGR from 2026 to 2031 as airport expansions and tourism lift jet-fuel demand.
How is the sulfur cap affecting marine fuels in the region?
A 0.1% sulfur limit effective May 2025 shifts bunkering to compliant ports such as Alexandria, Suez and Port Said, raising demand for very-low-sulfur grades.
What role do digital platforms play in distribution?
Online and automated channels, led by programs like NaftalCard, grow 7.1% yearly by streamlining fleet transactions and reducing cash handling.