
Marine Anti-fouling Coatings Market Size and Share
Market Overview
| Study Period | 2021 - 2031 |
|---|---|
| Market Size (2026) | USD 2.13 Billion |
| Market Size (2031) | USD 2.60 Billion |
| Growth Rate (2026 - 2031) | 4.08 % |
| Fastest Growing Market | Asia-Pacific |
| Largest Market | Asia-Pacific |
| Market Concentration | Medium |
Major Players *Disclaimer: Major Players sorted in no particular order Image © Mordor Intelligence. Reuse requires attribution under CC BY 4.0. | |
Marine Anti-fouling Coatings Market Analysis by Mordor Intelligence
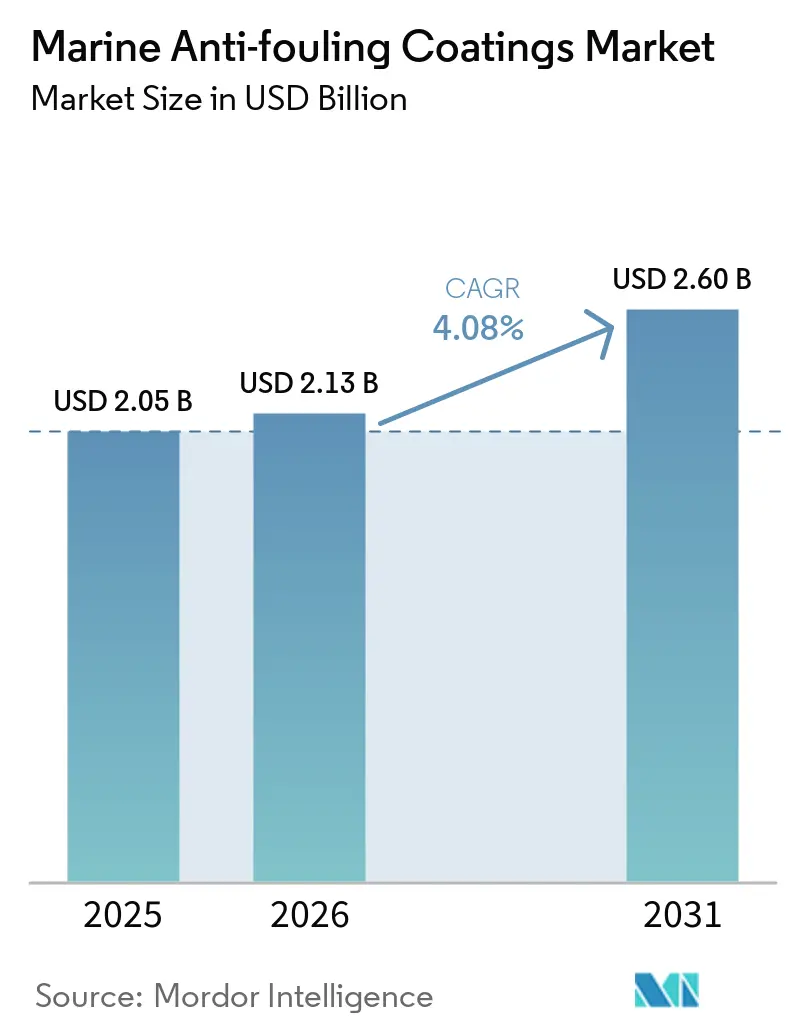
The Marine Anti-fouling Coatings Market size is projected to expand from USD 2.05 billion in 2025 and USD 2.13 billion in 2026 to USD 2.60 billion by 2031, registering a CAGR of 4.08% between 2026 to 2031. The headline expansion reflects strong demand from newbuild ship deliveries in Asia-Pacific, rising repair work on a 22.4-year-old merchant fleet, and premium pricing for nano-hybrid chemistries that cut fuel burn by keeping hulls smoother for longer periods. Red Sea reroutings in 2024–2025 raised average ton-miles and exposed vessels to warmer biomes, shortening effective coating life and lifting replacement volumes despite only modest growth in seaborne trade. Copper-based self-polishing copolymers still anchor the marine antifouling coatings market because shipowners trust their efficacy, yet regulatory caps on copper leaching and volatile cuprous-oxide prices are accelerating migration toward foul-release silicones, graphene hybrids, and self-healing systems. Competitive intensity has risen as incumbents forward-integrate into resin synthesis to secure feedstocks, while niche formulators chase offshore wind foundations and aquaculture nets where non-toxic solutions command premiums.
Key Report Takeaways
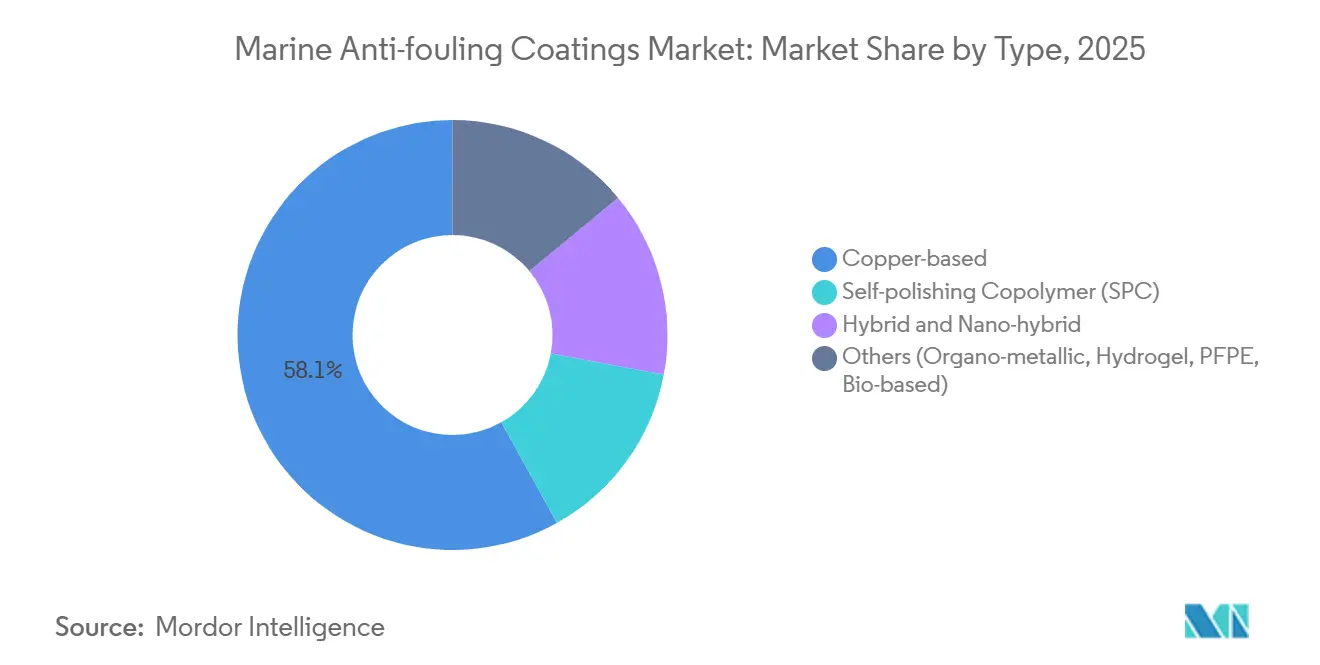
- By type, copper-based led with 58.08% of marine antifouling coatings market share in 2025, while hybrid and nano-hybrid variants posted the fastest 4.76% CAGR through 2031.
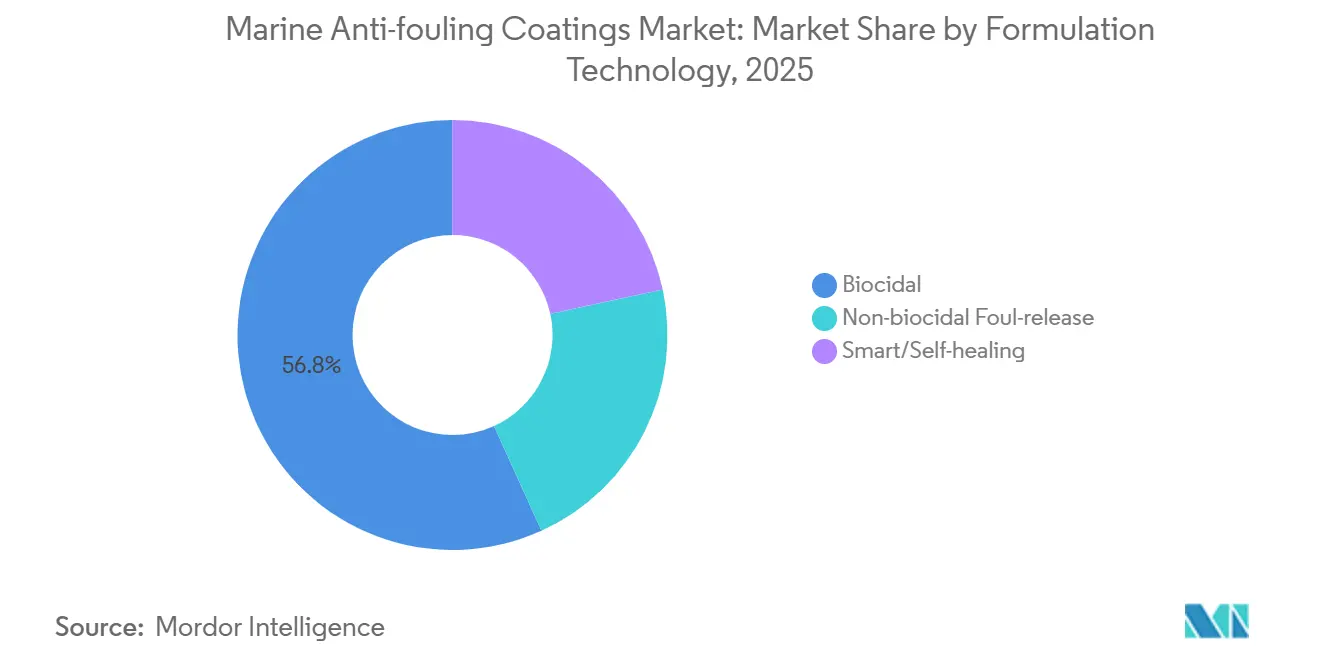
- By formulation technology, biocidal accounted for 56.78% share of the marine antifouling coatings market size in 2025; smart and self-healing coatings register the highest forecast CAGR at 5.02% to 2031.
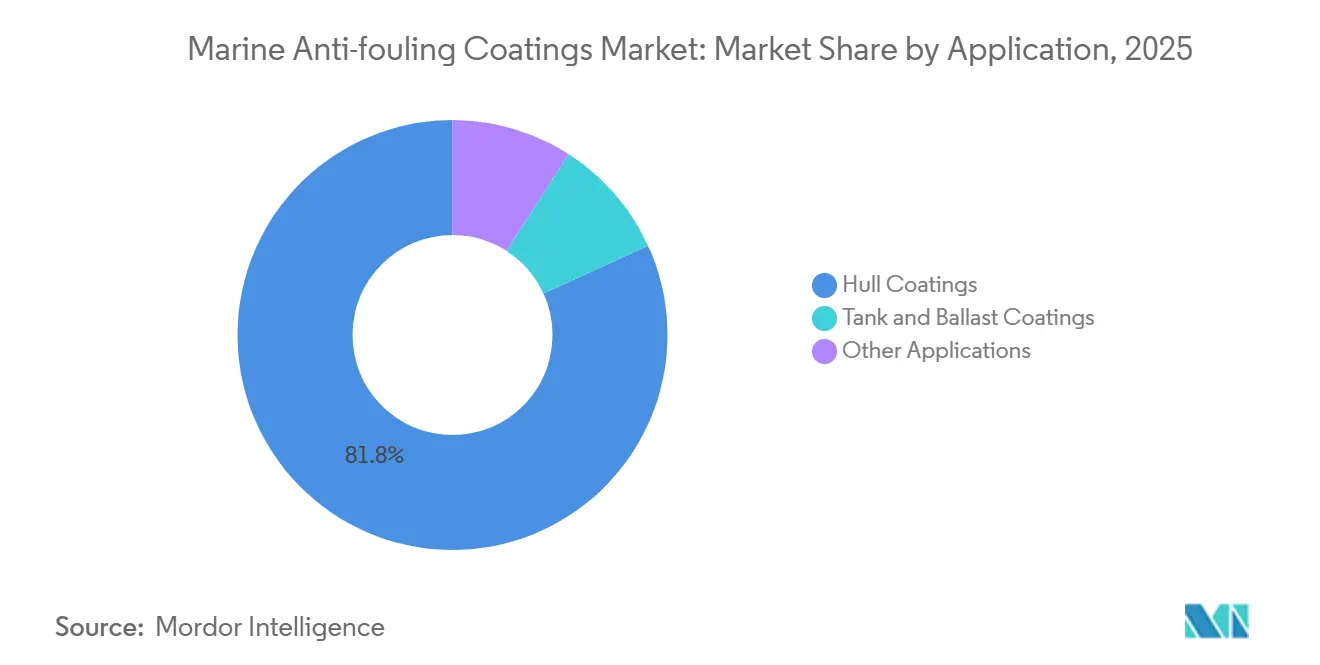
- By application, hull coatings captured 81.82% of the marine antifouling coatings market size in 2025 and are advancing at a 4.91% CAGR to 2031.
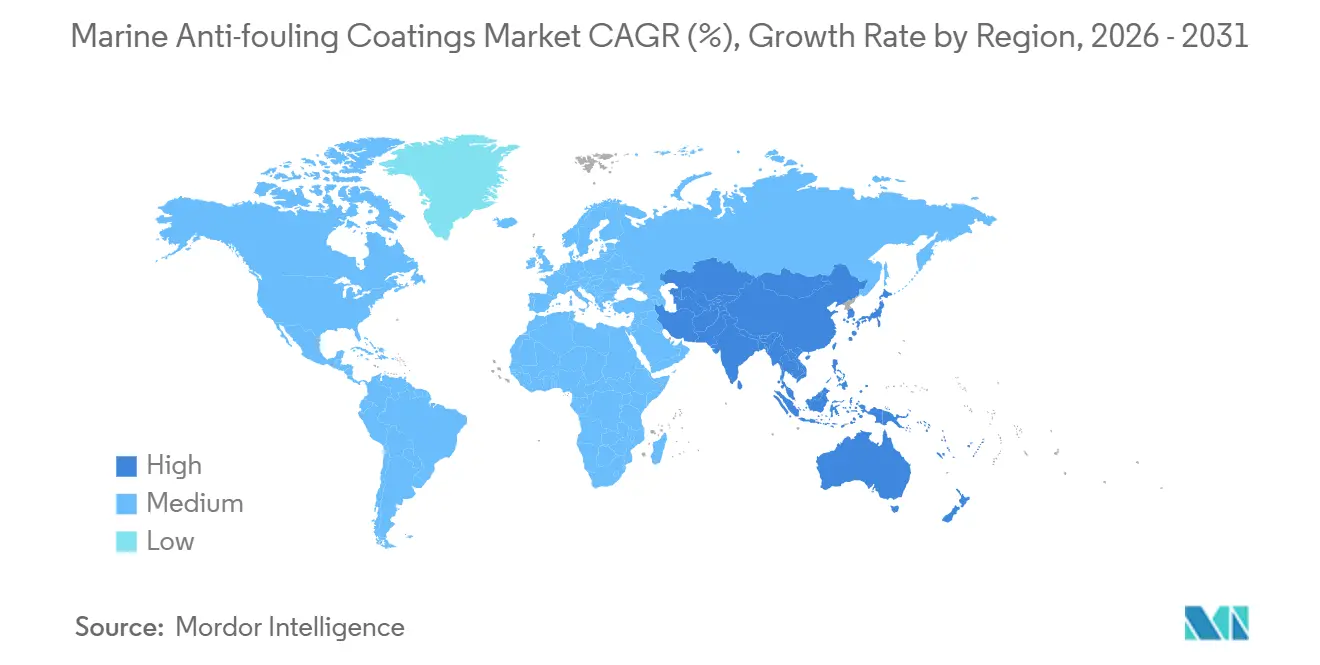
- By geography, Asia-Pacific commanded 68.90% revenue in 2025 and is projected to expand at a 4.66% CAGR through 2031.
Note: Market size and forecast figures in this report are generated using Mordor Intelligence’s proprietary estimation framework, updated with the latest available data and insights as of January 2026.
Market Trends and Insights
Drivers Impact Analysis of Marine Anti-fouling Coatings Market*
| Driver | (~) % Impact on CAGR Forecast | Geographic Relevance | Impact Timeline |
|---|---|---|---|
| Rapid Growth in Global Seaborne Trade | +1.2% | Global, with concentration in Asia-Pacific and Middle East trade lanes | Medium term (2-4 years) |
| Increasing Ship Repairs and Maintenance Activities | +0.9% | Global, particularly North America and Europe due to aging fleets | Long term (≥ 4 years) |
| Expansion of Asian Shipbuilding Capacity | +1.1% | Asia-Pacific core (China, South Korea, Japan), spill-over to Southeast Asia | Medium term (2-4 years) |
| Increasing Production of Leisure Boats and Cruise Ships | +0.4% | North America and Europe, emerging demand in Middle East | Short term (≤ 2 years) |
| Military Sonar-Friendly Stealth Coatings Demand | +0.3% | North America, Europe, Asia-Pacific (naval modernization programs) | Long term (≥ 4 years) |
| Source: Mordor Intelligence | |||
Rapid Growth in Global Seaborne Trade
Container reroutings around the Cape of Good Hope in 2025 lengthened Asia–Europe voyages by 3,500 nautical miles and lifted ton-miles 6% even though cargo volumes grew only 0.5%. Longer exposure to warmer waters accelerates barnacle settlement, cutting the service life of self-polishing copolymers from 60 months to 48 months and prompting unscheduled dry-dockings. Operators responded with a two-tier coating strategy that loads copper heavily for the first 18 months then overlays foul-release topcoats, lifting spend per hull 15%–20% but avoiding the 40% fuel penalty of severe fouling. The shift toward 24,000 TEU ultra-large container ships expands coated surface faster than cargo capacity, sustaining volume growth in the marine antifouling coatings market[1]. Diversifying trade lanes, notably intra-Asian routes, is distributing repair demand to hubs in Singapore, Dubai, and Santos, increasing just-in-time blending opportunities for suppliers.
Increasing Ship Repairs and Maintenance Activities
Average fleet age reached 22.4 years in 2024, the highest in two decades, after owners deferred scrapping amid high newbuild prices. Older hulls suffer micro-crack formation that forces touch-ups at 30–36 months, effectively doubling addressable demand for repair-grade coatings. Chinese and Southeast Asian yards captured 60% of global repair work in 2024-2025, enabling formulators to pre-position inventory and offer copper-content adjustments matched to future trading regions. Higher-sulfur fuels burned in legacy engines accelerate corrosion in ballast tanks, extending antifouling needs beyond exterior hulls. These dynamics support sustained replacement cycles that underpin the marine antifouling coatings market even as newbuild deliveries climb.
Expansion of Asian Shipbuilding Capacity
China delivered 54.6% of global tonnage in 2024 and South Korea’s USD 120 billion orderbook stretches to 2035, underpinning regional dominance. Newbuild contracts bundle coatings, and yards sign multi-year supply pacts with two or three majors to secure pricing and technical service. Eco-design vessels meeting IMO Energy Efficiency Design Index Phase 3 favor nano-hybrid coatings that reduce hull roughness 5% and fuel use 3%–4%, justifying premiums of 25%–30%. Emerging yards in Vietnam and Indonesia focus on mid-size vessels where delivery speed matters, opening share for regional formulators. Collectively, Asian capacity keeps the marine antifouling coatings market anchored in Asia-Pacific for the next decade.
Increasing Production of Leisure Boats and Cruise Ships
U.S. and European leisure-boat output accounted for 70% of global units in 2025, powered by coastal tourism and private ownership. Cruise-ship orderbooks climbed to 60 vessels with deliveries clustered in 2026-2027, each specifying coatings that combine aesthetics with fouling resistance. Marinas in California and the Mediterranean cap copper runoff, steering leisure craft toward silicone foul-release systems despite shorter maintenance intervals. Sonar-transparent coatings for naval sonar domes line up with frigate and corvette procurements, growing this niche at 8%-10% per year. Though smaller in volume, the leisure and defense segments raise average selling prices across the marine antifouling coatings market.
Restraints Impact Analysis of Marine Anti-fouling Coatings Market*
| Restraint | (~) % Impact on CAGR Forecast | Geographic Relevance | Impact Timeline |
|---|---|---|---|
| Stringent Biocide Bans | -0.6% | Europe, North America, with gradual adoption in Asia-Pacific | Medium term (2-4 years) |
| Volatility in Cuprous-Oxide Pricing | -0.4% | Global, with acute impact in Asia-Pacific due to supply-chain concentration | Short term (≤ 2 years) |
| Accelerated Uptake of Non-Coating Hull-Clean Robots | -0.3% | Europe and North America initially, expanding to Asia-Pacific | Long term (≥ 4 years) |
| Source: Mordor Intelligence | |||
Stringent Biocide Bans
The AFS Convention now ratified by 95 states restricts copper release, while the EU cut leaching limits from 200 μg cm² day⁻¹ to 150 μg cm² day⁻¹ in 2024, forcing reformulation or exit for high-copper paints. California imposes even tighter caps, effectively banning high-loading coatings in leisure harbors. Non-biocidal foul-release alternatives cost 40%-60% more and add two or three days to dry-dock schedules, squeezing budgets[2]. Owners operating globally must specify to the strictest rules or manage regional inventories, both raising complexity. The regulatory trajectory accelerates hybrid layering where a thin biocidal primer sits under a silicone topcoat, but multi-year sea trials slow mass adoption.
Volatility in Cuprous-Oxide Pricing
Cuprous-oxide prices swung 30% between Q1 2024 and Q3 2025 after Chilean mine disruptions and Indonesian smelter delays. Majors hedge half their needs but still adjust list prices quarterly, while smaller firms saw margins shrink 200-300 basis points in 2025, prompting consolidation. High copper costs push buyers toward bio-based alternatives, yet current bio-polymer yields remain far from commercial scale.
*Our forecasts treat driver/restraint impacts as directional, not additive. The impact forecasts reflect baseline growth, mix effects, and variable interactions.
Marine Anti-fouling Coatings Market Segment Analysis
By Type:
Copper Endures as Hybrids GainCopper-based held 58.08% of marine antifouling coatings market share in 2025 and still dominate newbuild specifications because their USD 8–12 per liter cost undercuts nano-hybrids and provides proven five-year protection. Hybrid and nano-hybrid coatings are posting 4.76% CAGR to 2031 as yards seek to defer first recoating by two or three years and regulators ratchet down copper leaching. The marine antifouling coatings market size for hybrids is therefore expanding faster than for legacy copper products, supported by graphene or silica nanoparticles that cut friction 20%–30% and trim fuel bills.
Advanced chemistries—zwitterionic, hydrogel, PFPE, and bio-based matrices—occupy small yet strategic niches such as polar research vessels and offshore wind monopiles where zero toxicity is paramount. PFPE faces potential PFAS restrictions from 2028, while bio-based paints cost 50%-70% more and last 24-36 months, limiting near-term uptake. Nonetheless, patent filings for these alternatives grew 40% in 2024-2025, signaling R&D commitment among leading suppliers.
By Formulation Technology:
Biocidal Incumbency Versus Smart InnovationBiocidal paints held 56.78% of marine antifouling coatings market share in 2025, anchored by cost advantages and owner familiarity. Non-biocidal foul-release systems are growing in regions that limit copper or on vessels sailing above 15 knots where hydrodynamic flow shears off organisms, yet application demands pristine surfaces, restricting use to newbuilds and full blast refits.
Smart and self-healing expand at 5.02% CAGR on the back of embedded microcapsules that release healing agents upon damage, extending life to 72 months and cutting unscheduled dry-dockings 30% in 2025 trials. Digital twins from Wärtsilä now integrate sensor readings with coating performance data, letting owners schedule maintenance only when drag rises beyond thresholds, a service that boosts value realization across the marine antifouling coatings market.
By Application:
Hull Dominance Reflects Fouling RiskHull coatings represented 81.82% of marine antifouling coatings market size in 2025 and are forecast to grow at 4.91% CAGR to 2031 owing to drag penalties that can lift fuel burn 15% over a five-year cycle. Owners are shifting to thinner 200-250 micron layers every 36 months rather than heavier films every 60 months, reinforcing annual volume demand even as service intervals tighten.
Tank and ballast coatings trail because owners defer interior work until 15-year special surveys, favoring epoxy anticorrosives over antifouling unless vessels trade in brackish waters. Offshore wind foundations and aquaculture nets form the fastest sub-segment, leveraging nano-hybrids that extend inspection cycles from three to five years and comply with discharge caps in fjords and coastal zones.
Geography Analysis
APAC Marine Anti-fouling Coatings Market
Asia-Pacific controlled 68.90% of marine antifouling coatings market share in 2025 and will post a 4.66% CAGR to 2031, anchored by Chinese and South Korean yard activity and by repair hubs in Singapore, Busan, and Shanghai. South Korea’s LNG-carrier backlog and Japan’s specialty builds demand premium nano-hybrid coatings that meet Energy Efficiency Design Index targets. India’s USD 3 billion incentive program to boost shipbuilding will add incremental volumes from 2028.
North America and Europe Marine Anti-fouling Coatings Market
North America shows bifurcated trends: copper-free rules in California push leisure boats toward silicone foul-release, while deep-sea vessels still employ biocidal SPCs. The U.S. Navy’s stealth coatings create a high-value but classified niche. Europe enforces the world’s strictest copper limits in the Baltic and Mediterranean, spurring demand for hybrid layering and robotic hull-clean systems that extend coating life.
MEA and South America Marine Anti-fouling Coatings Market
South America and the Middle East and Africa grow from offshore oil and gas, container-port expansion, and intra-regional shipping. Brazil’s pre-salt FPSOs use dual-function coatings that withstand hydrocarbon and fouling exposure at 50%-70% premiums. Dry-dock hubs in Dubai and Fujairah attract global repair work on cost and turnaround advantages, while nascent African shipyards blend imported raw materials locally for river barges and fishing fleets.
Value Chain Analysis
The value chain for marine anti-fouling coatings begins with upstream suppliers of biocides and functional additives, including copper compounds and metal-organic driers, as well as silicone and other polymer binders, solvents, pigments, and emerging bio-based inputs. Suppliers such as Umicore (metal carboxylates) and bioindustrial players such as Cargill (bio-based coating components) feed resin and intermediate manufacturers, and in some cases large coating formulators that increasingly secure critical inputs through longer-term sourcing and selective integration to reduce exposure to cuprous-oxide volatility.
Midstream, formulation and manufacturing are carried out by global marine coating specialists and regional producers, with portfolios spanning biocidal self-polishing systems, biocide-free silicone foul-release coatings, and hybrid or nano-hybrid chemistries. Downstream, distribution and service are tied closely to shipyards and dry-dock networks, where coatings are specified and applied during newbuild and repair cycles by approved applicators. Technical service teams support surface preparation, film-build control, and inspection regimes, while application process innovation, such as electrostatic application systems in dry docking, is being used to improve transfer efficiency and reduce overspray. Performance-monitoring tools and sea-trial data packages also help document fuel-efficiency and hull-condition outcomes for owners operating under tightening environmental and operational requirements. Anchor points include the April 2025 IMO guidance on in-water cleaning of ships, which standardizes cleaning compatibility and biomass capture, and PPG’s 200th dry-docking milestone using electrostatic application, illustrating the scale of integrated service capability across major dry-dock hubs.
Competitive Landscape
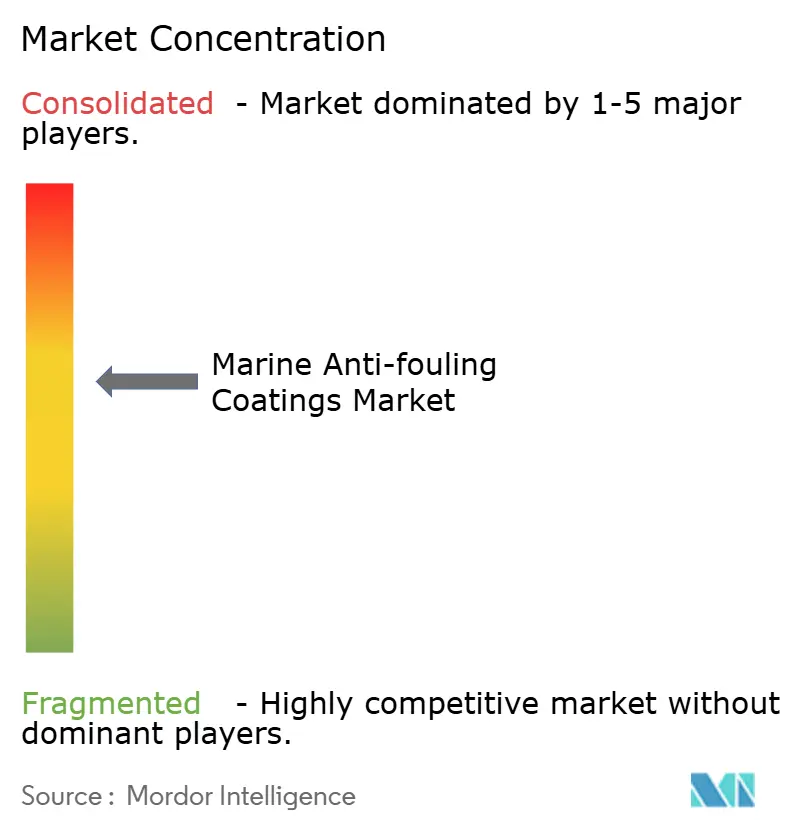
The marine antifouling coatings market is moderately concentrated. The top five suppliers—Akzo Nobel, Hempel, Jotun, PPG Industries, and Chugoku Marine Paints—command 50%-55% of global revenue, leaving room for regional challengers. Majors co-develop copper compounds with miners, operate hull-monitoring platforms, and navigate 50-plus regulatory regimes, erecting barriers for new entrants. Patent filings for graphene, zwitterionic, and bio-inspired matrices rose 40% during 2024-2025, underscoring a race to commercialize non-toxic alternatives before the next IMO biocide review in 2028.
Regional specialists target inland vessels, aquaculture nets, and leisure boats where customization trumps scale. Digital-twin alliances—Jotun’s HullSkater with Wärtsilä’s Fleet Operations Solution—offer predictive cleaning that extends coating life 20%-30% and justifies higher selling prices. Consolidation is expected as copper price volatility and multimillion-dollar regulatory testing favor vertically integrated players with global distribution.
Marine Anti-fouling Coatings Industry Leaders
-
PPG Industries Inc.
-
Hempel A/S
-
Akzo Nobel N.V.
-
Jotun A/S
-
Chugoku Marine Paints, Ltd.
- *Disclaimer: Major Players sorted in no particular order
Marine Anti-fouling Coatings Market Companies Covered in this Report
- Akzo Nobel N.V.
- Altex Coatings Ltd
- Axalta Coating Systems, LLC
- BASF
- Chugoku Marine Paints, Ltd.
- Gruppo Boero
- Hempel A/S
- Jotun A/S
- Kansai Paint Marine Co.,Ltd.
- KCC CORPORATION
- LANXESS
- Nippon Paint Marine Coatings Co., Ltd.
- PPG Industries Inc.
- RPM International Inc.
- The Sherwin-Williams Company
Market Opportunities and Future Outlook
A gap is emerging for biocide-free and lower-toxicity systems that can meet tighter discharge and leaching constraints while still delivering measurable hull-drag and maintenance benefits. The IMO has added practical guidance for biofouling management through approvals such as the April 2025 guidance on in-water cleaning of ships’ biofouling, which sets more standardized operating expectations around cleaning compatibility, capture of removed biomass, and environmental controls.
Suppliers are also sharpening commercial focus on silicone foul-release systems and advanced hybrids, supported by named deployments such as Hempel integrating Hempaguard NB into a newbuilding application process at Yangzijiang Shipyard and PPG scaling SIGMAGLIDE 2390 adoption through repeat dry-dock programs. A further opportunity is the industrialization of application and verification, where coatings suppliers add value beyond paint sales by reducing yard time, rework, and material waste while providing defensible performance evidence. PPG’s 200th dry docking milestone using electrostatic application highlights how process capabilities can differentiate suppliers in high-throughput repair hubs, particularly when owners track fuel and emissions outcomes under CII-related scrutiny. Large fleet and shipyard-linked agreements that lock in coating systems across multi-vessel newbuild series, such as Jotun COSCO Marine Coatings’ work with COSCO SHIPPING Bulk for 125 newbuilding bulk carriers, broaden the case for bundled technical service, condition monitoring, and lifecycle maintenance planning tied to anti-fouling system selection.
Recent Industry Developments in Marine Anti-fouling Coatings Market
- June 2026: PPG Industries Inc. announced a major expansion of its electrostatic coating application capability, adding a new production line to support large-drydock programs and reduce cycle times. The development expands capacity across key dry-dock hubs and aligns with operator focus on minimizing rework and emissions outcomes.
- November 2025: I-Tech AB signed an MoU with Guangdong Havey Advanced Materials Technology Co., Ltd. to collaborate on next generation high performance antifouling materials for marine coatings. The partnership pairs I-Tech's Selektope bio-repellent ingredient with Havey's biodegradable resin binder development, reflecting active supplier investment in alternatives to high copper loading approaches.
- March 2024: PPG Industries Inc. launched PPG NEXEON 810, a copper-free antifouling marine coating positioned to improve vessel performance and support emissions reduction initiatives. The launch broadened copper-free options for operators and yards facing tighter local discharge limits and evolving customer sustainability specifications.
Marine Anti-fouling Coatings Market Report Scope and Research Methodology
Market Definition and Coverage
In this methodology, the market covers anti-fouling coating products used to prevent or reduce marine organism growth on the underwater exterior surfaces of ships and boats, and similar submerged marine assets. The sizing is captured in value terms (USD) across major end-use demand pools and geographies.
Scope exclusions: this sizing does not include non-marine industrial protective coatings, nor interior marine coatings that are not applied to submerged outer surfaces.
Segments Covered in This Report
- By Type
- Copper-based
- Self-polishing Copolymer (SPC)
- Hybrid and Nano-hybrid
- Others (Organo-metallic, Hydrogel, PFPE, Bio-based)
- By Formulation Technology
- Biocidal
- Non-biocidal Foul-release
- Smart/Self-healing
- By Application
- Hull Coatings
- Tank and Ballast Coatings
- Other Applications (Offshore Structures, Aquaculture and Inland Waterways Assets)
- By Geography
- Asia-Pacific
- China
- India
- Japan
- South Korea
- Vietnam
- Malaysia
- Indonesia
- Thailand
- Rest of Asia-Pacific
- North America
- United States
- Canada
- Mexico
- Europe
- Germany
- United Kingdom
- France
- Italy
- Spain
- NORDIC Countries
- Rest of Europe
- South America
- Brazil
- Argentina
- Rest of South America
- Middle East and Africa
- Saudi Arabia
- South Africa
- Qatar
- Nigeria
- United Arab Emirates
- Rest of Middle East and Africa
- Asia-Pacific
Data Sources, Market Sizing, and Validation
Desk Research
Desk work is used to set the hard outer limits for the model, and then to keep assumptions realistic before interviews start. We reviewed public sources such as IMO conventions and updates on antifouling systems, UN Comtrade trade statistics for relevant coating and chemical categories, national ship registry and shipping statistics releases, and shipbuilding orderbook and delivery summaries from industry bodies.
To translate activity into coating demand, we also referenced vessel fleet and newbuild indicators, dry-docking and maintenance cycles discussed in port and classification society publications, and technical papers in peer-reviewed journals on coating performance and biocide regulations. For company-level context, we used annual reports, investor presentations, and reputable press, and we also relied on paid subscriptions for company financials intelligence, news and financials screening, and patent databases to check formulation direction. The sources named here are illustrative only, and many other public documents were consulted to collect, cross-check, and clarify inputs.
Primary Interviews and Surveys
Primary work focused on converting the desk assumptions into a practical model by checking what is actually used in the field. We spoke with coating producers, marine applicators, shipyards, ship operators, and industry experts to validate repaint frequency, typical coating system choices, and how pricing shifts by vessel class and region.
For a global market view, coverage was balanced across major shipbuilding hubs and large operating fleets, and follow-up outreach was done when desk indicators and early interview feedback did not align on demand direction.
Distribution of primary research fieldwork respondents
| Company type | Respondent position | Region |
|---|---|---|
| Top tier: 29% | CXOs: 16% | APAC: 42% |
| Mid tier: 50% | Functional/Unit leaders: 33% | EMEA: 33% |
| Smaller Players: 21% | Managers: 51% | Americas: 25% |
Market-Sizing & Forecasting
Sizing starts with a top-down demand pool build that ties the addressable coated surface to fleet activity, newbuild deliveries, and maintenance cycles, and then converts this into value using region-specific price bands. Once the first cut is built, we corroborate it with selective bottom-up approximations, such as sampled supplier revenue splits, channel checks with applicators, and a volume-to-value bridge using typical coverage rates and coating system thickness.
Key inputs used in the model include newbuild and retrofit activity by vessel category, dry-dock frequency and repaint intervals, average wetted surface exposure by ship size bands, the share shift between biocidal and foul-release systems driven by regulations, and regional pricing movement for key raw materials that influence finished coating pricing. Where bottom-up signals are incomplete, gaps are handled through conservative share allocation anchored to confirmed regional fleet and shipyard intensity, and then adjusted only after primary respondents confirm direction.
Forecasts are produced using scenario analysis around shipbuilding cycles, operating days, and maintenance cadence. These scenarios are then filtered through consensus ranges obtained from primary experts, so growth rates stay tied to observable fleet and shipyard signals.
Data Validation & Update Cycle
Outputs are checked through triangulation across independent signals, and the model is reviewed in steps before sign-off. We compare implied demand against fleet growth and maintenance indicators, and then re-check any sharp year-to-year changes against known drivers such as regulation timing, shipyard utilization swings, or raw material price shocks.
Variance checks are run across regions and major application pools to ensure a single assumption does not distort the total. If a key input moves outside the expected band, the team re-contacts selected respondents and re-reads the supporting public sources before updating the final view. Reports are refreshed annually, with interim updates when a material event changes the demand outlook, and a final pre-delivery pass completed so clients receive the latest adjusted numbers.
Mordor Intelligence's Marine Anti Fouling Coatings Market Estimate Compared With Other Published Estimates
Published market values for marine anti-fouling coatings often do not match, because groups do not count the same items and they also select different base years and pricing methods. In practice, the biggest differences usually come from what is treated as in-scope coating demand, how newbuild versus maintenance is weighted, and how much average selling prices are allowed to change over time.
Some published figures appear to roll in adjacent marine coating categories or apply a higher price progression that is not clearly tied to fleet activity, which can lift the total even when volumes are similar. Mordor Intelligence limits the count to anti-fouling coatings used on submerged outer surfaces and anchors the yearly pathway to fleet and dry-dock signals before building value from region-specific price bands.
Benchmark comparison
| Source | Market Size | Gaps in Research Methodology |
|---|---|---|
| Mordor Intelligence | USD 2.13 B (2026) | |
| Global Consultancy A | USD 2.12 B (2025) | Uses a different base year and may apply a faster growth pathway tied to broader market drivers, which can shift totals even when the in-scope demand pool looks similar. |
| Regional Consultancy B | USD 2.49 B (2024) | The higher value is consistent with broader inclusion (for example, counting adjacent marine coating types or a wider end-user bucket) and a less transparent price build from volume to value. |
Taken together, the spread in published values is mainly explained by scope breadth, base-year selection, and how prices and repaint cycles are converted into revenue. By keeping assumptions tied to observable fleet activity and maintenance cadence, the estimate stays repeatable and easier to audit when users revisit the inputs year over year.
Key Questions Answered in the Report
What is the size of the marine antifouling coatings market?
The marine antifouling coatings market size stands at USD 2.13 billion in 2026 and is projected to advance at a 4.08% CAGR, lifting value to USD 2.60 billion by 2031.
Which region leads demand for antifouling coatings?
Asia-Pacific accounts for 68.90% of 2025 revenue and will remain the largest consumer through 2031.
Which product type holds the highest market share?
Copper-based formulations retain the largest share at 58.08% of 2025 revenue.
What technology is growing the quickest?
Smart and self-healing coatings exhibit the fastest forecast CAGR of 5.02% as owners adopt digital-twin maintenance strategies.