Market Overview
| Study Period | 2018 - 2031 |
|---|---|
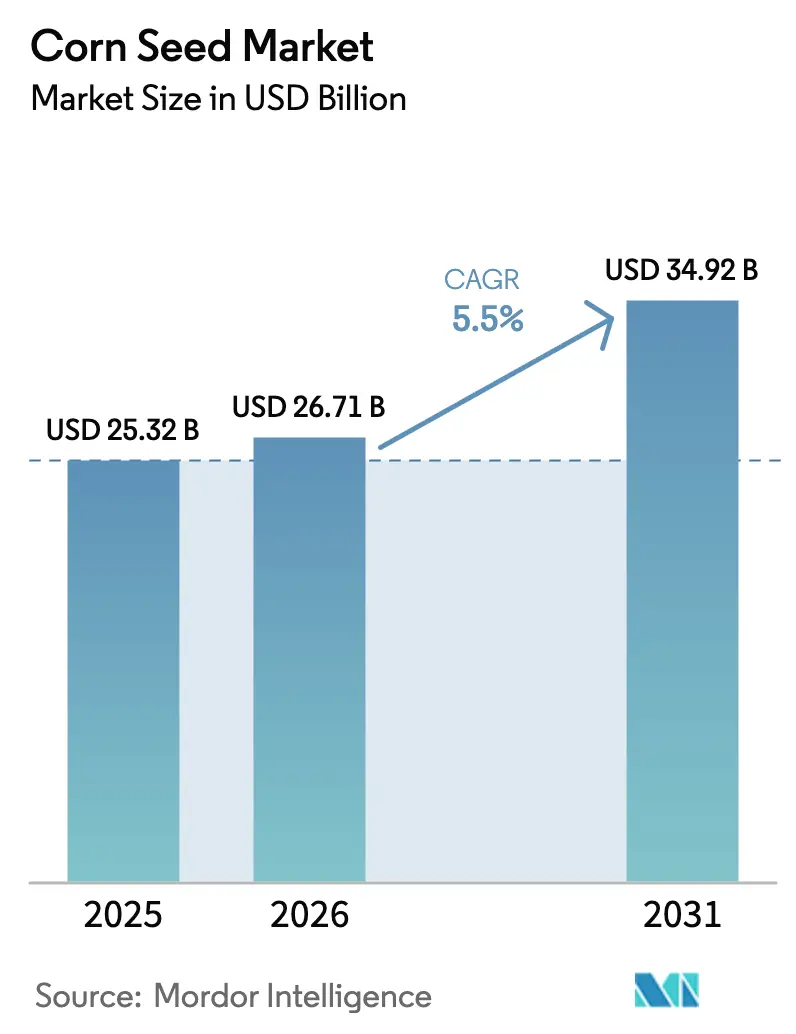
| Market Size (2026) | USD 26.71 Billion |
| Market Size (2031) | USD 34.92 Billion |
| Growth Rate (2026 - 2031) | 5.50% CAGR |
| Fastest Growing Market | North America |
| Largest Market | North America |
| Market Concentration | Medium |
Major Players *Disclaimer: Major Players sorted in no particular order Image © Mordor Intelligence. Reuse requires attribution under CC BY 4.0. | |
Corn Seed Market Analysis by Mordor Intelligence
The corn seed market size was valued at USD 25.32 billion in 2025 and estimated to grow from USD 26.71 billion in 2026 to reach USD 34.92 billion by 2031, at a CAGR of 5.50% during the forecast period (2026-2031). Hybrid replacement cycles are shortening, stacked-trait technologies are commanding premium prices, and digital agronomy services are becoming integral to seed packages, together accelerating revenue growth across all major growing regions. Climate variability is fueling demand for drought- and heat-tolerant germplasm, while faster regulatory pathways for gene-edited events are reshaping product pipelines. Precision-agriculture platforms that link genetics, prescriptions, and input logistics are deepening supplier–farmer relationships and raising switching costs. At the same time, low-cost direct-to-farmer channels are unlocking underserved smallholder segments, widening the corn seed market base.
Key Report Takeaways
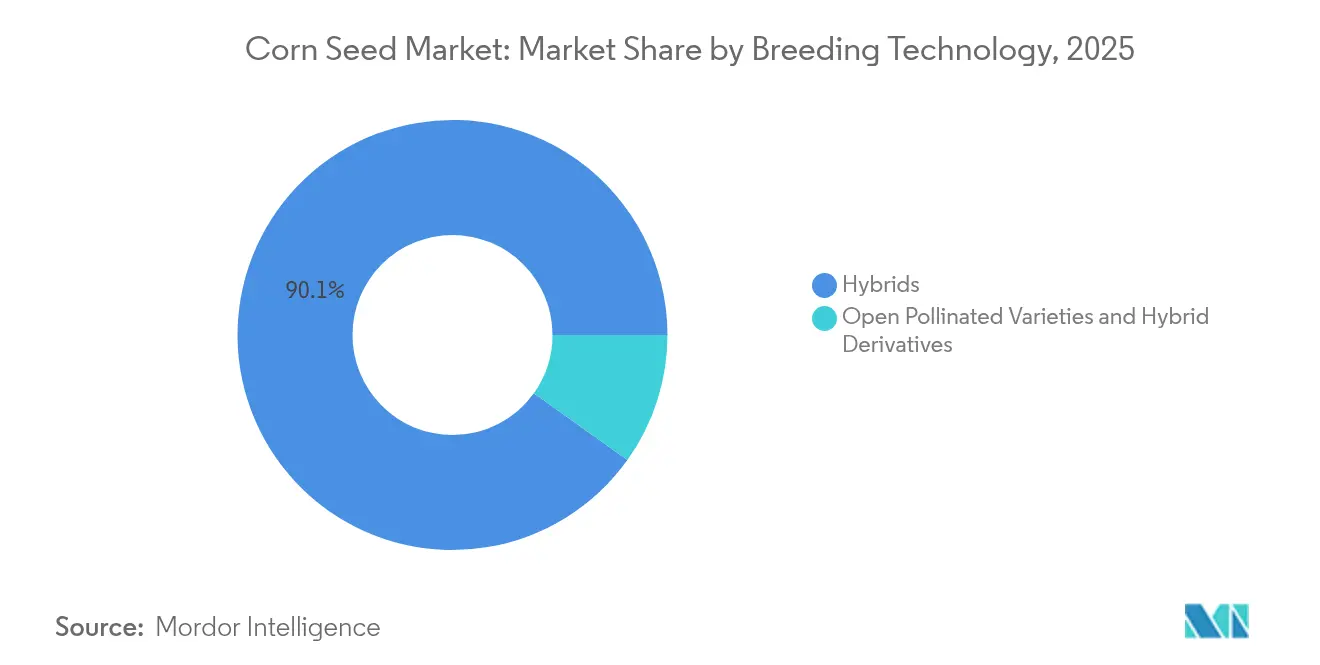
- By breeding technology, hybrids held a dominant 90.12% corn seed market share in 2025, whereas open-pollinated varieties and hybrid derivatives are projected to expand at a 5.78% CAGR through 2031.
- By region, North America accounted for 49.62% of the corn seed market size in 2025, while projected to post the fastest 7.08% CAGR to 2031.
Note: Market size and forecast figures in this report are generated using Mordor Intelligence’s proprietary estimation framework, updated with the latest available data and insights as of 2026.
Global Corn Seed Market Trends and Insights
Drivers Impact Analysis*
| Driver | (~) % Impact on CAGR Forecast | Geographic Relevance | Impact Timeline |
|---|---|---|---|
| High adoption of stacked-trait transgenic hybrids | +1.2% | North America, South America, select Asia-Pacific markets | Medium term (2-4 years) |
| Rapid mechanization and hybrid replacement cycles | +0.9% | Asia-Pacific, Eastern Europe, parts of Africa | Long term (≥ 4 years) |
| Expansion of precision-ag platforms bundling seed and digital agronomy | +0.8% | North America, Western Europe, and advanced Asia-Pacific markets | Medium term (2-4 years) |
| Accelerated regulatory fast-track for gene-edited corn varieties | +0.7% | Global, with early adoption in the United States, Canada, Argentina | Short term (≤ 2 years) |
| Climate-resilient seed demand amid rising drought and heat episodes | +1.1% | Global, particularly Sub-Saharan Africa, and parts of Asia | Long term (≥ 4 years) |
| Emergence of low-cost direct-to-farmer e-commerce seed channels | +0.5% | India, Brazil, select African markets | Medium term (2-4 years) |
| Source: Mordor Intelligence | |||
High Adoption of Stacked-Trait Transgenic Hybrids
Stacked-trait hybrids capture the maximum percentage of North American seed sales because they integrate herbicide tolerance with multiple Bt proteins that curb pest damage and simplify weed control. Bayer's SmartStax PRO platform, launched across key corn belt states, demonstrates yield advantages of 8-12% over single-trait alternatives under high pest pressure conditions[1]Source: Bayer AG, “Annual Report 2024,” bayer.com. Approval timelines in Argentina and Brazil have narrowed to roughly 24 months for products with proven safety records, hastening commercial launches. Competitive positioning now depends on stacking breadth as well as refuge-in-a-bag convenience. As more farmers prioritize agronomic simplicity, the corn seed market continues to migrate toward multi-trait packages that protect profit margins. Adoption strength in major export countries also influences trait preference in import-dependent regions that benchmark technology performance on the United States and Brazilian acreage.
Rapid Mechanization and Hybrid Replacement Cycles
India's agricultural machinery subsidies, expanded under the Sub-Mission on Agricultural Mechanization, have increased combine harvester adoption by 35% since 2022, enabling farmers to plant newer hybrid varieties with improved standability characteristics[2]Source: Ministry of Agriculture and Farmers Welfare, “Sub-Mission on Agricultural Mechanization,” agricoop.nic.in. Similar patterns are emerging in Kenya, Ghana, and Nigeria through development-bank equipment programs, stimulating fresh demand for machine-friendly hybrids with sturdy stalks and synchronized maturity. Shorter life cycles enlarge the cumulative corn seed market by prompting faster turnover of each farmer’s preferred germplasm. Breeders with robust screening programs for mechanical harvesting tolerance gain a competitive edge because farmers replace older lines more frequently. The transition also amplifies data flow on hybrid performance, reinforcing localized breeding decisions and boosting adoption of higher-value seed classes.
Expansion of Precision-Agriculture Platforms Bundling Seed and Digital Agronomy
Seed companies have integrated analytics, imagery, and prescription tools into their offerings; as a result, bundled services now cover 25% of United States corn acres. Digital platforms capture field-level data on soil health, nutrient status, and historical yield, guiding hybrid selection that raises return on seed spend by an estimated USD 40 per hectare. Subscription revenues from software and scouting complement seed margins, shifting the business model toward recurring income. Farmers who share data receive customized seeding rates and fertility advice, locking them into ecosystem services that favor the originating seed brand. Data-driven differentiation intensifies competition in the corn seed market while lowering barriers for smaller entrants offering specialized analytics tied to niche germplasm.
Accelerated Regulatory Fast-Track for Gene-Edited Corn Varieties
The (United States Department of Agriculture) USDA's SECURE rule, implemented in 2024, exempts certain gene-edited crops from lengthy regulatory reviews, accelerating commercialization of drought-tolerant and nutritionally enhanced varieties[3]Source: USDA APHIS, “Revised SECURE Rule,” aphis.usda.gov . Argentina’s flexible criteria similarly cleared 12 gene-edited events since 2022. Reduced regulatory cost encourages mid-sized firms to target traits such as enhanced nitrogen-use efficiency and elevated lysine content, intensifying technology diffusion beyond the largest incumbents. Gene editing sidesteps many intellectual-property constraints that characterize traditional transgenics, expanding trait-stacking diversity. As approvals scale, the corn seed market incorporates edits that address both agronomic and end-use quality priorities, potentially transforming premium-protein feed segments.
Restraints Impact Analysis*
| Restraint | (~) % Impact on CAGR Forecast | Geographic Relevance | Impact Timeline |
|---|---|---|---|
| Trait-royalty concentration pushing retail seed prices upward | -0.8% | Global, particularly impacting price-sensitive markets | Medium term (2-4 years) |
| Escalating pest resistance to Bt toxins driving costly R&D cycles | -0.6% | North America, South America, parts of Asia | Long term (≥ 4 years) |
| Stringent GMO restrictions and coexistence rules | -0.9% | Europe, parts of Africa, select Asian markets | Long term (≥ 4 years) |
| Proliferation of counterfeit seed undermines trust in certified channels | -0.4% | India, Sub-Saharan Africa, parts of Southeast Asia | Short term (≤ 2 years) |
| Source: Mordor Intelligence | |||
Trait-Royalty Concentration Pushing Retail Seed Prices Upward
Patent clustering among three biotechnology leaders increased trait royalty fees between 2020 and 2024, driving retail seed prices beyond the reach of smallholders in emerging economies. Licensing costs now account for shelf prices in premium transgenic hybrids, limiting volume expansion in cost-constrained regions. Antitrust probes in Brazil and India highlight competition concerns but have yet to yield remedies, sustaining pricing power for incumbents. As farmers weigh input costs, some revert to conventional hybrids or saved seed, tempering growth in technology-intensive tiers of the corn seed market. End-user pushback is influencing public-sector breeding programs to develop royalty-free alternatives for marginal zones.
Escalating Pest Resistance to Bt Toxins Driving Costly R&D Cycles
Documented resistance to Cry1Ab and Cry1F proteins spans 12 countries, forcing seed firms to invest in novel modes of action such as RNA interference and Vip3A stacks. R&D budgets have increased since 2022 to keep ahead of evolving pest biotypes, stretching commercialization timelines to as long as ten years. Resistance-management requirements mandate refuge acreage and trait rotation, complicating farmer compliance and reducing perceived convenience. Smaller companies without deep R&D reserves face competitive headwinds, leading to potential consolidation that could reshape the corn seed industry landscape. Persistent resistance threats underline the imperative for integrated pest-management partnerships between breeders, crop-protection suppliers, and extension services.
*Our forecasts treat driver/restraint impacts as directional, not additive. The impact forecasts reflect baseline growth, mix effects, and variable interactions.
Segment Analysis
By Breeding Technology: Hybrid Dominance and Open-Pollinated Momentum
Hybrid seed commanded 90.12% of total sales in 2025, confirming its position as the cornerstone of the corn seed market. Transgenic hybrids with stacked herbicide-tolerant and insect-resistant traits constitute this category, leveraging multi-trait packages that simplify in-field weed and pest control. Adoption spreads fastest among commercial growers in the United States, Brazil, and Argentina, where digital agronomy tools validate hybrid return on investment through geospatial mapping. Non-transgenic hybrids retain relevance in organic systems and GMO-regulated zones, anchored by strong demand across select European states. Meanwhile, premium protein and waxy corn variants are carving out specialty niches, aided by gene-editing edits that avoid transgenic triggers.
Open-pollinated varieties plus hybrid derivatives are expanding at a 5.78% CAGR, propelled by seed-saving benefits and lower capital requirements for subsistence farmers. Public-sector breeding programs contribute royalty-free germplasm that private dealers distribute through informal networks, extending reach into remote geographies. Combined, these dynamics keep the corn seed market diversified across technology classes, balancing high-margin biotech lines with volume-oriented traditional seeds.


Geography Analysis
North America held 49.62% of the corn seed market share in 2025, and Asia-Pacific holds a modest share in the market. Chinese policy that now encourages foreign joint ventures, opening access to proprietary traits while maintaining local germplasm stewardship. In India, dealer-network expansion, coordinated with state subsidies, moved hybrid adoption, lifting average yields by nearly over traditional cultivars. Emerging economies such as Indonesia and Vietnam are transitioning to disease-tolerant tropical hybrids as feed demand for poultry and aquaculture intensifies. Regional breeding focus centers on downy mildew resistance, ear rot tolerance, and stability under monsoon variability, underpinning the sustained dominance of Asia-Pacific in the corn seed market.
North America is projected to grow at a 7.08% CAGR through 2031, the fastest among all regions, as precision-ag depth, gene-editing approvals, and agronomic service bundling reinforce premium pricing power. Mexico’s dual structure accommodates both biotech-intensive commercial farms and native landrace cultivation, requiring suppliers to manage discrete product lines for divergent customer bases.
Regulatory clarity around gene-editing fosters rapid commercial rollout of traits like elevated amino-acid content, which taps feed-mill demand for nutrient-dense corn. Canada’s warming prairie climate is extending corn suitability zones, further enlarging the corn seed market size in temperate latitudes. While Europe, South America, Africa, and the Middle East exhibit diverse demand patterns shaped by policy and climate, their combined uptake highlights the need for regionalized germplasm, tailored stewardship, and flexible licensing terms.


Competitive Landscape
The corn seed industry remains moderately concentrated, with the top five players controlling a modest share of global revenue. Competitive dynamics pivot around breeding-program scale, proprietary trait portfolios, and the breadth of integrated digital services. Patent expirations for first-generation biotech traits are lowering entry barriers for regional firms marketing off-patent events, thereby heightening price competition in mature markets. Major incumbents are countering by accelerating (Clustered Regularly Interspaced Short Palindromic Repeats) CRISPR-derived trait deployment; Corteva’s filings for drought-tolerance edits showcase how gene editing is becoming a central competitive lever.
Digital-ag acquisitions and partnerships are redefining differentiation as data ownership becomes as critical as germplasm. Leading companies analyze billions of data points on soil, moisture, and disease pressure, translating insights into customized seed recommendations that enhance customer stickiness. In parallel, e-commerce channels level the playing field for smaller breeders by bypassing dealer margins, but they must still ensure germination standards to retain farmer trust. The resulting ecosystem favors agile operators that combine strong R&D pipelines with omnichannel reach and robust agronomic support.
Strategic moves since late 2024 reflect this convergence. Bayer set aside funds for U.S. production upgrades targeting gene-edited hybrids, while Corteva’s purchase of Sementes Guerra advanced its tropical germplasm access. Syngenta secured Chinese approval for Agrisure Viptera, enhancing royalties in a previously gated market, and KWS joined forces with Kaveri Seeds to blend European genetics with South Asian adaptation. These moves illustrate how geographic expansion, trait access, and production scale intertwine to shape competitive advantage in the corn seed market.
Corn Seed Industry Leaders
Advanta Seeds - UPL
Bayer AG
Corteva Agriscience
KWS SAAT SE & Co. KGaA
Syngenta Group
- *Disclaimer: Major Players sorted in no particular order


Recent Industry Developments
- September 2025: GDM, a global plant genetics company, acquired 100% ownership of AgReliant Genetics, a North American corn seed supplier. This acquisition strengthened GDM's North American market position and established it as the fourth-largest corn genetics provider worldwide.
- June 2025: Advanta Seeds acquired corn assets from K-Adriatica, including temperate-corn germplasm and hybrid varieties adapted to European growing conditions. This acquisition expanded Advanta's presence in the European corn seed market and enhanced its germplasm diversity.
- March 2025: Bayer established a corn seed facility in Kabwe, Zambia. The facility plans to triple the company's corn seed production capacity in Zambia by 2025, supporting corn consumption for approximately 30 million people.


Global Corn Seed Market Report Scope
Hybrids, Open Pollinated Varieties & Hybrid Derivatives are covered as segments by Breeding Technology. Africa, Asia-Pacific, Europe, Middle East, North America, South America are covered as segments by Region.Breeding Technology
| Hybrids | Non-Transgenic Hybrids | |
| Transgenic Hybrids | Herbicide Tolerant Hybrids | |
| Insect Resistant Hybrids | ||
| Other Traits | ||
| Open Pollinated Varieties and Hybrid Derivatives | ||
Geography
| Africa | By Breeding Technology | |
| By Country | Egypt | |
| Ethiopia | ||
| Ghana | ||
| Kenya | ||
| Nigeria | ||
| South Africa | ||
| Tanzania | ||
| Rest of Africa | ||
| Asia-Pacific | By Breeding Technology | |
| Australia | ||
| Bangladesh | ||
| China | ||
| India | ||
| Indonesia | ||
| Japan | ||
| Myanmar | ||
| Pakistan | ||
| Philippines | ||
| Thailand | ||
| Vietnam | ||
| Rest of Asia-Pacific | ||
| Europe | By Breeding Technology | |
| France | ||
| Germany | ||
| Italy | ||
| Netherlands | ||
| Poland | ||
| Romania | ||
| Russia | ||
| Spain | ||
| Turkey | ||
| Ukraine | ||
| United Kingdom | ||
| Rest of Europe | ||
| Middle East | By Breeding Technology | |
| Iran | ||
| Saudi Arabia | ||
| Rest of Middle East | ||
| North America | By Breeding Technology | |
| Canada | ||
| Mexico | ||
| United States | ||
| Rest of North America | ||
| South America | By Breeding Technology | |
| Argentina | ||
| Brazil | ||
| Rest of South America | ||
| Breeding Technology | Hybrids | Non-Transgenic Hybrids | |
| Transgenic Hybrids | Herbicide Tolerant Hybrids | ||
| Insect Resistant Hybrids | |||
| Other Traits | |||
| Open Pollinated Varieties and Hybrid Derivatives | |||
| Geography | Africa | By Breeding Technology | |
| By Country | Egypt | ||
| Ethiopia | |||
| Ghana | |||
| Kenya | |||
| Nigeria | |||
| South Africa | |||
| Tanzania | |||
| Rest of Africa | |||
| Asia-Pacific | By Breeding Technology | ||
| Australia | |||
| Bangladesh | |||
| China | |||
| India | |||
| Indonesia | |||
| Japan | |||
| Myanmar | |||
| Pakistan | |||
| Philippines | |||
| Thailand | |||
| Vietnam | |||
| Rest of Asia-Pacific | |||
| Europe | By Breeding Technology | ||
| France | |||
| Germany | |||
| Italy | |||
| Netherlands | |||
| Poland | |||
| Romania | |||
| Russia | |||
| Spain | |||
| Turkey | |||
| Ukraine | |||
| United Kingdom | |||
| Rest of Europe | |||
| Middle East | By Breeding Technology | ||
| Iran | |||
| Saudi Arabia | |||
| Rest of Middle East | |||
| North America | By Breeding Technology | ||
| Canada | |||
| Mexico | |||
| United States | |||
| Rest of North America | |||
| South America | By Breeding Technology | ||
| Argentina | |||
| Brazil | |||
| Rest of South America | |||


Market Definition
- Commercial Seed - For the purpose of this study, only commercial seeds have been included as part of the scope. Farm-saved Seeds, which are not commercially labeled are excluded from scope, even though a minor percentage of farm-saved seeds are exchanged commercially among farmers. The scope also excludes vegetatively reproduced crops and plant parts, which may be commercially sold in the market.
- Crop Acreage - While calculating the acreage under different crops, the Gross Cropped Area has been considered. Also known as Area Harvested, according to the Food & Agricultural Organization (FAO), this includes the total area cultivated under a particular crop across seasons.
- Seed Replacement Rate - Seed Replacement Rate is the percentage of area sown out of the total area of crop planted in the season by using certified/quality seeds other than the farm-saved seed.
- Protected Cultivation - The report defines protected cultivation as the process of growing crops in a controlled environment. This includes greenhouses, glasshouses, hydroponics, aeroponics, or any other cultivation system that protects the crop against any abiotic stress. However, cultivation in an open field using plastic mulch is excluded from this definition and is included under open field.
| Keyword | Definition |
|---|---|
| Row Crops | These are usually the field crops which include the different crop categories like grains & cereals, oilseeds, fiber crops like cotton, pulses, and forage crops. |
| Solanaceae | These are the family of flowering plants which includes tomato, chili, eggplants, and other crops. |
| Cucurbits | It represents a gourd family consisting of about 965 species in around 95 genera. The major crops considered for this study include Cucumber & Gherkin, Pumpkin and squash, and other crops. |
| Brassicas | It is a genus of plants in the cabbage and mustard family. It includes crops such as carrots, cabbage, cauliflower & broccoli. |
| Roots & Bulbs | The roots and bulbs segment includes onion, garlic, potato, and other crops. |
| Unclassified Vegetables | This segment in the report includes the crops which don’t belong to any of the above-mentioned categories. These include crops such as okra, asparagus, lettuce, peas, spinach, and others. |
| Hybrid Seed | It is the first generation of the seed produced by controlling cross-pollination and by combining two or more varieties, or species. |
| Transgenic Seed | It is a seed that is genetically modified to contain certain desirable input and/or output traits. |
| Non-Transgenic Seed | The seed produced through cross-pollination without any genetic modification. |
| Open-Pollinated Varieties & Hybrid Derivatives | Open-pollinated varieties produce seeds true to type as they cross-pollinate only with other plants of the same variety. |
| Other Solanaceae | The crops considered under other Solanaceae include bell peppers and other different peppers based on the locality of the respective countries. |
| Other Brassicaceae | The crops considered under other brassicas include radishes, turnips, Brussels sprouts, and kale. |
| Other Roots & Bulbs | The crops considered under other roots & bulbs include Sweet Potatoes and cassava. |
| Other Cucurbits | The crops considered under other cucurbits include gourds (bottle gourd, bitter gourd, ridge gourd, Snake gourd, and others). |
| Other Grains & Cereals | The crops considered under other grains & cereals include Barley, Buck Wheat, Canary Seed, Triticale, Oats, Millets, and Rye. |
| Other Fibre Crops | The crops considered under other fibers include Hemp, Jute, Agave fibers, Flax, Kenaf, Ramie, Abaca, Sisal, and Kapok. |
| Other Oilseeds | The crops considered under other oilseeds include Ground nut, Hempseed, Mustard seed, Castor seeds, safflower seeds, Sesame seeds, and Linseeds. |
| Other Forage Crops | The crops considered under other forages include Napier grass, Oat grass, White clover, Ryegrass, and Timothy. Other forage crops were considered based on the locality of the respective countries. |
| Pulses | Pigeon peas, Lentils, Broad and horse beans, Vetches, Chickpeas, Cowpeas, Lupins, and Bambara beans are the crops considered under pulses. |
| Other Unclassified Vegetables | The crops considered under other unclassified vegetables include Artichokes, Cassava Leaves, Leeks, Chicory, and String beans. |


Research Methodology
Mordor Intelligence follows a four-step methodology in all our reports.
- Step-1: IDENTIFY KEY VARIABLES: In order to build a robust forecasting methodology, the variables and factors identified in Step-1 are tested against available historical market numbers. Through an iterative process, the variables required for market forecast are set and the model is built on the basis of these variables.
- Step-2: Build a Market Model: Market-size estimations for the forecast years are in nominal terms. Inflation is not a part of the pricing, and the average selling price (ASP) is kept constant throughout the forecast period.
- Step-3: Validate and Finalize: In this important step, all market numbers, variables and analyst calls are validated through an extensive network of primary research experts from the market studied. The respondents are selected across levels and functions to generate a holistic picture of the market studied.
- Step-4: Research Outputs: Syndicated Reports, Custom Consulting Assignments, Databases, and Subscription Platforms


