Market Overview
| Study Period | 2020 - 2031 |
|---|---|
| Forecast Data Period | 2026 - 2031 |
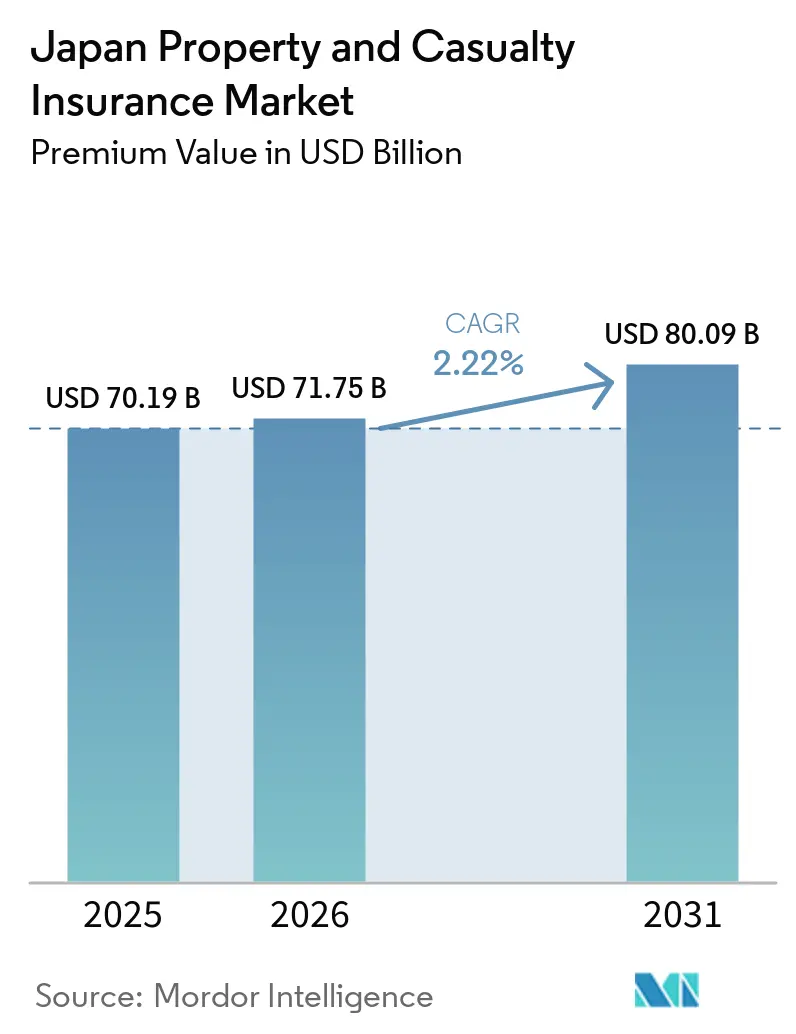
| Base Year Market Size (2025) | USD 70.19 Billion |
| Market Size (2026) | USD 71.75 Billion |
| Market Size (2031) | USD 80.09 Billion |
| Growth Rate (2026 - 2031) | 2.22% CAGR |
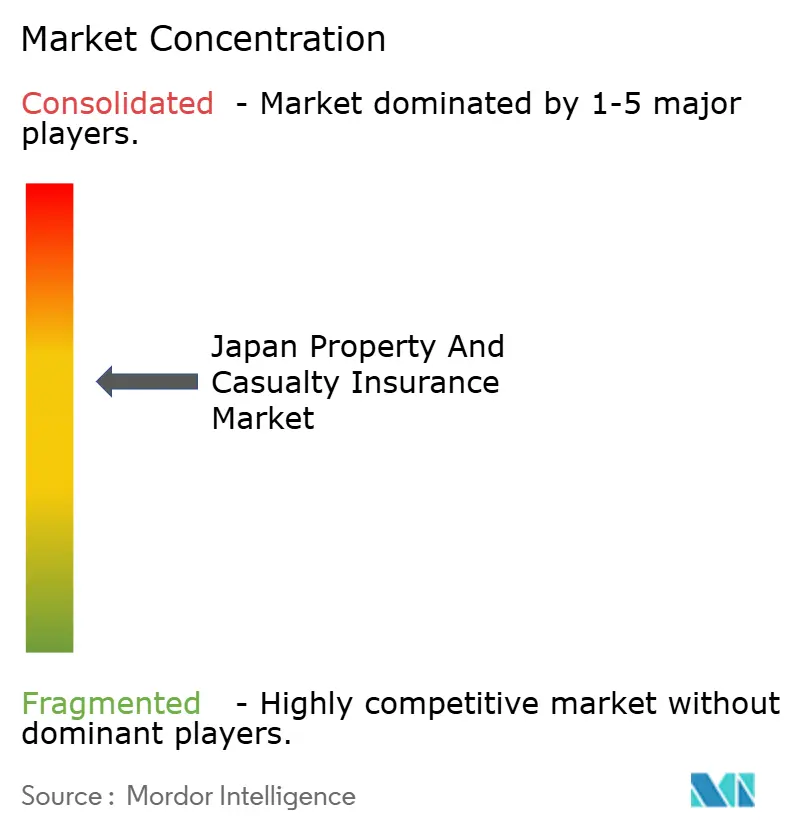
| Market Concentration | Medium |
Major Players *Disclaimer: Major Players sorted in no particular order Image © Mordor Intelligence. Reuse requires attribution under CC BY 4.0. | |
Japan Property and Casualty Insurance Market Analysis by Mordor Intelligence
The Japan Property And Casualty Insurance Market size in terms of premium value is projected to be USD 70.19 billion in 2025, USD 71.75 billion in 2026, and reach USD 80.09 billion by 2031, growing at a CAGR of 2.22% from 2026 to 2031.
The Japan property and casualty insurance market shows steady expansion in 2026, as carriers rebalance pricing and coverage terms after several intense catastrophe seasons that reset risk appetites and underwriting standards. The Japan property and casualty insurance market is also adapting to a new regulatory capital regime, with the Financial Services Agency implementing an economic value-based solvency framework by March 2026 that heightens capital discipline and disclosure requirements. Loss experience from 2024 events, including the Noto Peninsula earthquake and severe convective storms, continues to influence property rate adequacy and deductibles as claim settlements progress through 2025. New embedded and affinity pathways in payments and real estate transactions are widening reach in personal lines through point-of-sale integration and paperless onboarding that aligns with consumer expectations for digital convenience. Strategic moves by leading groups, including a definitive merger plan at MS&AD and an international acquisition by Sompo, signal active portfolio optimization and inorganic growth to support resilience in the Japan property and casualty insurance market.
Key Report Takeaways
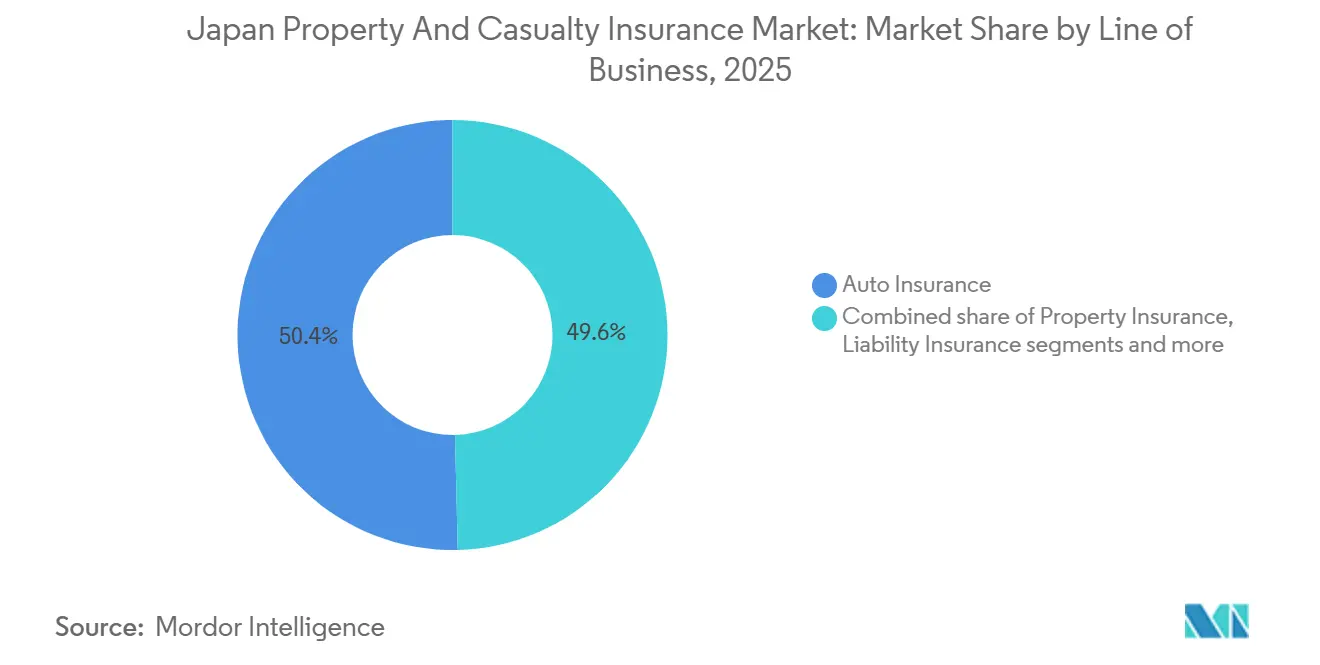
- By line of business, automobile led with 50.38% of the Japan property and casualty insurance market share in 2025, while cyber is projected to expand at a 17.38% CAGR through 2031.
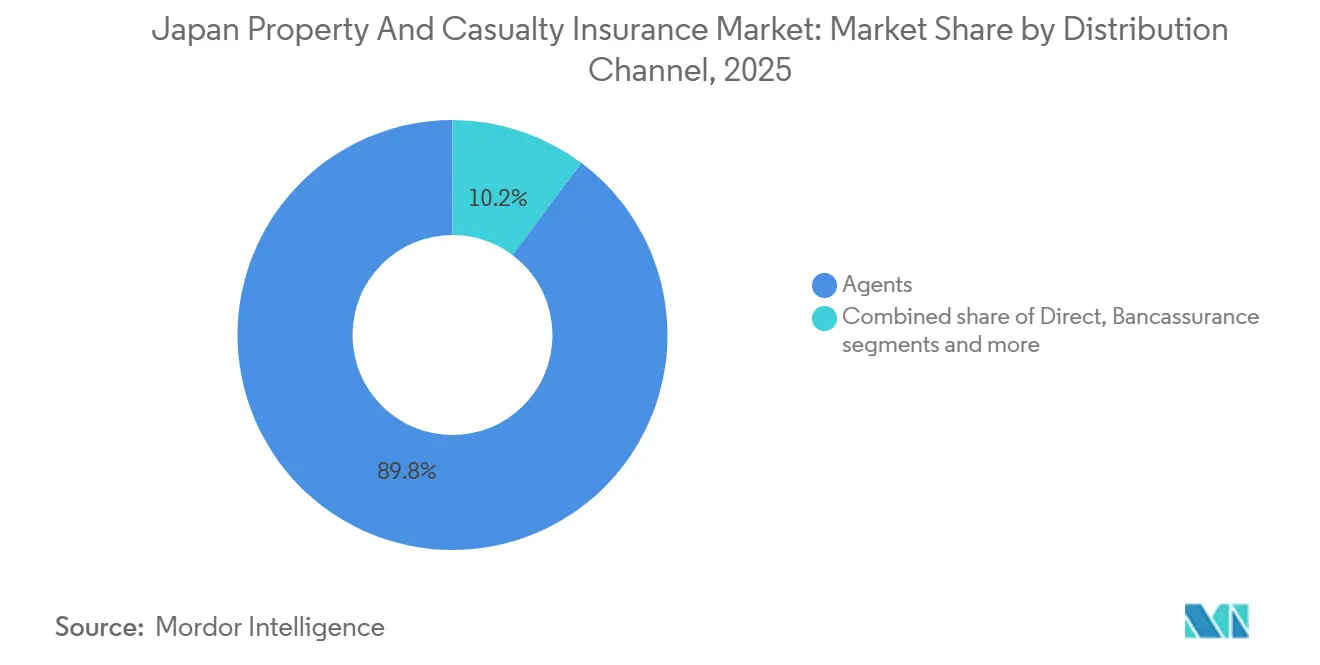
- By distribution channel, agencies held the largest share at 89.78% of the Japan property and casualty insurance market share in 2025, while affinity and embedded partnerships are projected to grow at a 13.84% CAGR through 2031.
- By end-user, individuals accounted for 73.73% of the Japan property and casualty insurance market share in 2025, while SMEs are projected to grow at a 7.33% CAGR through 2031.
- By geography, Kanto led with a 35.38% of the Japan property and casualty insurance market share in 2025, while Kyushu and Okinawa are projected to grow at a 5.84% CAGR through 2031.
Note: Market size and forecast figures in this report are generated using Mordor Intelligence’s proprietary estimation framework, updated with the latest available data and insights as of 2026.
Japan Property and Casualty Insurance Market Trends and Insights
Drivers Impact Analysis*
| Driver | (~) % Impact on CAGR Forecast | Geographic Relevance | Impact Timeline |
|---|---|---|---|
| Telematics-driven auto adoption accelerates premium growth | +0.4% | National, with early gains in Kanto, Chubu | Medium term (2-4 years) |
| Sustained repricing in fire/property from natural catastrophe and repair-cost inflation | +0.6% | National, heightened in Kyushu, Shikoku, and Hokkaido | Short term (≤ 2 years) |
| Economic value-based solvency transition tightens capital discipline | +0.3% | Global framework, concentrated impact on major insurers in Tokyo | Medium term (2-4 years) |
| Earthquake add-on penetration and stable state-backed capacity lift homeowner cover | +0.2% | National, especially Pacific-facing prefectures | Long term (≥ 4 years) |
| Embedded and affinity distribution unlock new micro-covers | +0.5% | National, spillover to urban centers | Medium term (2-4 years) |
| Data-led natural catastrophe claims to enable parametric products | +0.2% | National, pilot deployments scaling from Kanto | Long term (≥ 4 years) |
| Source: Mordor Intelligence | |||
Telematics-Driven Auto Adoption Accelerates Premium Growth
Usage-based and behavior-based programs continue to scale in 2026, supported by an expanding installed base and proven safety outcomes that help stabilize motor loss experience in the Japan property and casualty insurance market. Cambridge Mobile Telematics reported surpassing 1 million active drivers on its platform in Japan by mid-2025, and partner programs recorded crash frequency reductions and improved customer satisfaction among enrolled drivers [1]Cambridge Mobile Telematics, “Cambridge Mobile Telematics Crosses 1 Million Drivers in Japan,” Cambridge Mobile Telematics, cmtelematics.com. The General Insurance Rating Organization of Japan introduced a model-specific vehicle classification that segments automobiles into 17 classes, which supports more granular risk pricing and aligns with telematics insights used by leading carriers. Several insurers are expanding capabilities for in-vehicle incident video and real-time alerts to improve claims adjudication and enhance road safety, with product updates scheduled into 2026. Rising distraction-related crash statistics reinforce the value of behavior scoring and driver coaching, which underpins ongoing investment in telematics by insurers seeking more stable results in the Japan property and casualty insurance market.
Sustained Repricing in Fire/Property from Natural Catastrophe and Repair-Cost Inflation
Carriers continued to adjust fire and property pricing in late 2024 and through 2025 after a series of severe events, with loss experience and higher repair inputs requiring stricter underwriting in the Japan property and casualty insurance market. Claims from the January 2024 Noto Peninsula earthquake totaled USD 0.67 billion (JPY 104.8 billion) across 126,698 policies, and a large hail event in Hyogo in April 2024 generated USD 0.87 billion (JPY 135.96 billion) in claims across 149,612 policies. Typhoon Shanshan in 2024 added USD 0.35 billion (JPY 54.9 billion) in claims, with a large proportion borne by fire insurance, which further pressured underwriting margins. The Financial Services Agency’s second climate scenario analysis indicates that average annual claim payments for typhoons and floods increase in higher warming paths, which supports continued repricing and capacity calibration by insurers. Leading carriers responded with targeted actions, including the identification and remediation of unprofitable policies and more selective deployment of capacity in risk-sensitive property classes, which supports resilience in the Japan property and casualty insurance market.
Earthquake Add-On Penetration and Stable State-Backed Capacity Lift Homeowner Cover
Japan Earthquake Reinsurance reported that the system maintains a total liability cap of USD 76.82 billion (JPY 12.0 trillion) per event, with the government absorbing approximately 99.7% of claims beyond USD 2.57 billion (JPY 410.5 billion), which stabilizes the market during large events [2]Japan Earthquake Reinsurance Co., Ltd., “Earthquake Insurance in Japan,” Japan Earthquake Reinsurance, nihonjishin.co.jp. Premium determination uses updated damage projections and official probabilistic seismic hazard maps, with discounts applied for seismic isolation and earthquake-resistant construction attributes, which incentivize mitigation. Accumulated risk reserves at year-end fiscal 2024 indicate significant buffers at both company and government levels, supporting long-term sustainability that benefits the Japan property and casualty insurance market.
Data-Led Natural Catastrophe Claims Enable Parametric Products
Parametric earthquake insurance gained regulatory approval in 2025 for a product offered by HDI Global and Descartes Underwriting, which provides transparent triggers tied to official seismic intensity measures and delivers swift, fixed payouts without deductibles. The design aims to close gaps left by traditional indemnity coverage by addressing property damage, direct and contingent business interruption, and certain intangible impacts under clear policy terms. Tokio Marine is scaling data-driven resilience tools, including real-time flood monitoring and AI-assisted claims routing, to speed event response and sharpen exposure management for the Japan property and casualty insurance market [3]Tokio Marine Holdings, Inc., “Integrated Annual Report 2025,” Tokio Marine Holdings, tokiomarinehd.com. The group also implemented a customer inquiry response system that has cut response times and started advanced damage confirmation using AI-analyzed quotes, which supports faster settlement after large events. These capabilities lower friction in claims, enable targeted capacity deployment, and encourage the development of simpler, event-triggered products for the Japan property and casualty insurance market.
Restraints Impact Analysis*
| Restraint | (~) % Impact on CAGR Forecast | Geographic Relevance | Impact Timeline |
|---|---|---|---|
| Auto claims inflation and parts/repair bottlenecks pressure loss ratios | -0.3% | National, acute in metropolitan areas | Short term (≤ 2 years) |
| Catastrophe aggregation and earthquake cover caps create protection gaps | -0.2% | Pacific coastal prefectures and high seismic-risk zones | Long term (≥ 4 years) |
| Heavy agent dependence amid compliance tightening slows channel shifts | -0.4% | National | Medium term (2-4 years) |
| Corporate coinsurance scrutiny and cartel fallout elongate placement cycles | -0.3% | National, concentrated in large corporate segments | Short term (≤ 2 years) |
| Source: Mordor Intelligence | |||
Heavy Agent Dependence Amid Compliance Tightening Slows Channel Shifts
The sector features a large multi-agency footprint that has historically anchored personal and SME sales, which can slow the pace of digital channel substitution in the Japan property and casualty insurance market. The Financial Services Agency has strengthened supervisory guidance that requires insurers to enhance governance, ensure appropriate sales practices, and manage conflicts of interest more rigorously at shared agencies. Carriers are revising partner oversight, separating claims functions from sales, and refining commission frameworks to prioritize quality and compliance outcomes, which takes time to implement at scale. The transition requires training, new controls, and better data integration across carriers and intermediaries, which temporarily limits the speed of channel mix change in the Japan property and casualty insurance market. Over time, these measures are designed to restore trust, improve customer outcomes, and enable healthier competition.
Corporate Coinsurance Scrutiny and Cartel Fallout Elongate Placement Cycles
Enforcement actions and supervisory reviews stemming from past corporate premium-setting issues increased documentation and oversight requirements for placements, which lengthened cycle times in some large accounts in the Japan property and casualty insurance market. Business improvement orders connected to information management and sales practices prompted carriers to submit remediation plans and reinforce internal controls in 2025. The Financial Services Agency’s Strategic Priorities for 2025 to 2026 emphasize rebuilding trust, strengthening competitive fairness, and ensuring proper information governance by insurers and intermediaries. Underwriters are also recalibrating portfolio exposure and appetite in select commercial lines based on risk-adjusted returns, which influences limit sizes and pricing during renewal negotiations. These steps aim to align placement quality with supervisory expectations and improve long-term resilience in the Japan property and casualty insurance market.
*Our forecasts treat driver/restraint impacts as directional, not additive. The impact forecasts reflect baseline growth, mix effects, and variable interactions.
Segment Analysis
By Line of Business: Automobile Anchors, Cyber Accelerates
Automobile insurance accounted for 50.38% of the Japan property and casualty insurance market size in 2025, which reflects mandatory coverages and the large in-force vehicle base that drives premium volume in personal lines. Cyber, grouped under other P&C lines, is projected to grow at a 17.38% CAGR through 2031, making it the fastest expanding line by growth rate in the Japan property and casualty insurance market. Property pricing remained firm into 2025 after repeated catastrophe years, and carriers pivoted capacity toward risks with better resilience attributes and clearer catastrophe mitigation features. Earthquake coverage attached to household fire policies continued to gain traction, supported by stable reinsurance capacity and risk-sharing mechanisms that enhance system durability. These dynamics are influencing product design, deductibles, and endorsements as insurers balance affordability and sustainability in the Japan property and casualty insurance industry.
Carriers are refining auto underwriting with vehicle-level risk classes and telematics, which tighten alignment between premium and expected loss and support the stability of the Japan property and casualty insurance market. In property, underwriting has tightened around older structures and exposures with adverse loss experience, paired with support for mitigation steps that qualify for discounts or favorable terms. Cyber adoption is accelerating across SMEs and mid-market corporates that face operational risk from ransomware and business interruption, with insurers investing in preventive controls and response services as part of bundled offerings. Data-enabled claims management, satellite imagery, and drone assessments are improving cycle times and cost accuracy after events, which reduces leakage and enhances customer experience within the Japan property and casualty insurance market. Across lines, the regulatory shift to economic value-based solvency is reinforcing capital discipline and transparency that shape product and portfolio decisions in the Japan property and casualty insurance industry.


By Distribution Channel: Agencies Dominate, Embedded Partnerships Surge
Agencies remained the dominant channel with 89.78% share in 2025, while affinity and embedded partnerships are projected to grow at 13.84% CAGR over 2026 to 2031 as digital ecosystems create new points of sale in the Japan property and casualty insurance market. Direct channels benefit from brand extensions and simplified products, and carriers continue to invest in user experience and digital tools that lower acquisition costs for select personal lines. Bancassurance workflows are being modernized through paperless onboarding and data sharing that speed up quotes and issuance for basic P&C needs connected to property purchases. Embedded partnerships are broadening access to micro-covers for travel, payments, and mobility, which opens incremental growth pockets outside traditional agency reach in the Japan property and casualty insurance market. The resulting channel mix supports better segmentation, as carriers align distribution with risk complexity and service expectations.
Agency networks are also evolving under tighter supervisory expectations around customer-oriented conduct, conflict management, and information handling, which affects capacity for rapid change in the Japan property and casualty insurance market. Insurers are rebalancing their support to emphasize quality standards, clearer task allocation, and better controls between sales and claims, guided by formal improvement plans where required. Direct and embedded channels are positioned to capture digitally native customers who prefer instant quotes and straight-through issuance, which complements, not replaces, the agency core in the Japan property and casualty insurance industry. Over time, this multi-route approach should reduce distribution risk concentration and improve reach to underinsured segments. Carriers are sequencing investments to ensure that compliance readiness keeps pace with digital growth, which supports a durable channel transition in the Japan property and casualty insurance market.
By End-User: Retail Individuals Lead, SME Segment Compounds at 7 Percent
Individuals accounted for 73.73% of 2025 premiums, while SMEs are projected to grow at a 7.33% CAGR through 2031 as targeted covers for cyber, supply chain, and weather risks gain traction in the Japan property and casualty insurance market. For retail customers, earthquake endorsements on homeowner policies continue to expand, supported by risk-sharing with Japan Earthquake Reinsurance and tax incentives that encourage take-up. Government and public sector entities maintain consistent procurement for fleet and facility exposures, with a focus on continuity of essential services during extreme events. Large corporations are rationalizing program structures to manage catastrophe aggregation and liability exposure across global operations, while seeking more rapid catastrophe response tools for business interruption. These patterns shape a more risk-informed product mix that underpins durable growth in the Japan property and casualty insurance industry.
For SMEs, simplified cyber packages and bundled risk services are being prioritized to close protection gaps created by digitalization and climate variability, which supports steady expansion within the Japan property and casualty insurance market. Carriers are aligning underwriting with the new solvency regime and strengthening asset-liability management to ensure sustainable capacity for end-user segments across cycles. Paperless journeys for property-related covers, including online fire insurance applications, streamline issuance for individuals and small businesses tied to real estate transactions. Earthquake add-ons and risk-based discounts for resilient construction improve affordability and broaden access for households and microbusinesses. The resulting mix provides a base for the Japan property and casualty insurance market to grow through 2031 while improving coverage quality for core customer groups.
Geography Analysis
Kanto held 35.38% of premiums in 2025, reflecting the concentration of head offices, financial infrastructure, and higher value property exposures that anchor growth in the Japan property and casualty insurance market. Earthquake insurance penetration in the Tokyo Metropolitan area reached 35.9% coverage as of 2025, slightly above the broader Great Kanto zone, which underscores steady adoption in high-risk urban centers. Ongoing regulatory modernization, including the solvency shift, places additional emphasis on governance and risk management practices among large carriers headquartered in Tokyo, which supports market stability. Loss experience from 2024 events continues to shape underwriting in metropolitan corridors, where claims volumes from hail and seismic shocks inform updated pricing and deductibles. These dynamics reinforce Kanto’s role as a center of product innovation and capital allocation in the Japan property and casualty insurance market.
Kyushu and Okinawa are projected to grow at a 5.84% CAGR through 2031, the fastest among regions, aided by infrastructure investment and risk awareness after Typhoon Shanshan’s 2024 impact that drove USD 0.35 billion (JPY 54.9 billion) in insured losses. The region’s exposure to typhoons supports expanded take-up of property cover and risk mitigation add-ons that encourage resilience upgrades in buildings and supply chains. Government scenario analysis indicates higher average annual payouts under certain warming pathways, which informs underwriting and capacity decisions in coastal zones of the Japan property and casualty insurance market. Local businesses and municipalities are increasing emphasis on continuity and disaster prevention solutions, supported by carrier-led tools for real-time monitoring and exposure control. This trajectory supports above-average regional growth through the forecast period in the Japan property and casualty insurance market.
In Chubu, premium demand is shaped by manufacturing clusters with higher asset values and complex supply chains, where revised reference rates have supported risk-based property pricing for older buildings in fire-resistant classes. Kansai recorded heavy claims from a 2024 hail event centered in Hyogo, which totaled USD 0.87 billion (JPY 135.96 billion) across 149,612 policies, reinforcing regional sensitivity to convective storms for property and auto lines in the Japan property and casualty insurance market. Shikoku faces elevated seismic probability along the Nankai Trough corridor, where earthquake penetration remains in the mid-30% range, which highlights ongoing protection gaps. Hokkaido and Tohoku maintain exposure to seismic activity along the Pacific boundary, with recent events helping sustain awareness and add-on purchases for households. These regional patterns confirm that catastrophe exposure and mitigation incentives will remain central to geographic performance in the Japan property and casualty insurance market.
Competitive Landscape
The Japan property and casualty insurance market is anchored by three major groups that set standards for underwriting, risk governance, and investment in digital tools that shape industry practices. MS&AD announced a definitive agreement in February 2026 to merge Mitsui Sumitomo Insurance and Aioi Nissay Dowa Insurance in April 2027, with plans for IT integration, agency rationalization, and governance reinforcements at the holding level. Sompo completed the acquisition of Aspen Insurance Holdings in February 2026, gaining access to Lloyd’s platforms and additional specialty capabilities that diversify its earnings and risk footprint. These moves reflect a broader strategy to strengthen resilience and capture growth outside Japan while staying aligned with domestic supervisory priorities in the Japan property and casualty insurance market.
Tokio Marine continued its program of targeted acquisitions to enhance risk solutions and specialty reach, including the purchase of ID&E Holdings in May 2025 and Agrihedge in November 2025, with integration efforts focused on expanding disaster mitigation and agricultural services. The group also scaled a suite of disaster prevention tools that combine real-time hazard intelligence with AI-enabled claims processing to improve post-event response and customer experience in the Japan property and casualty insurance market. Sony Assurance continued to expand direct auto while preparing fire as a second growth pillar through segmentation-informed pricing and marketing strengths, which illustrates how digital carriers can broaden product scope. Small Amount and Short Term Insurance operators increased to 122 companies in 2024, focusing on renters, pet, and pecuniary covers distributed through real estate and digital platforms, which adds competitive diversity in the Japan property and casualty insurance market.
Specialty and reinsurance-linked innovation is also reshaping corporate propositions. HDI Global, in collaboration with Descartes, launched approved parametric earthquake protection in 2025 with simple triggers and pre-agreed payouts, distributed across brokers and agencies with major reinsurer support. Japan Post Insurance agreed to invest USD 2 billion in a Global Atlantic vehicle in 2025, adding reinsurance-driven diversification and access to international spread opportunities. Digital Garage launched an online fire insurance application platform that automates data transfer for quotes and onboarding, which demonstrates the multipartner digital pathways expanding in the Japan property and casualty insurance market. These developments complement supervisory efforts to strengthen conduct, information governance, and competition, providing a stable base for innovation and growth through 2031.
Japan Property and Casualty Insurance Industry Leaders
Tokio Marine & Nichido Fire Insurance Co., Ltd.
Mitsui Sumitomo Insurance Co., Ltd.
Aioi Nissay Dowa Insurance Co., Ltd.
Sompo Japan Insurance Inc.
AIG General Insurance Company, Ltd. (AIG Japan)
- *Disclaimer: Major Players sorted in no particular order

Recent Industry Developments
- February 2026: Sompo Holdings completed the acquisition of Aspen Insurance Holdings through its subsidiary Sompo International, securing 100% of Class A ordinary shares to expand in the United Kingdom and access Lloyd’s platforms, while adding alternative capital capabilities through Aspen Capital Markets.
- February 2026: MS&AD Insurance Group Holdings signed a final agreement to merge Mitsui Sumitomo Insurance and Aioi Nissay Dowa Insurance, effective April 1, 2027, with integration plans covering IT, agency networks, and a governance shift to a company with an audit and supervisory committee that includes many outside directors.
- July 2025: Japan Post Insurance, KKR, and Global Atlantic signed definitive agreements for Japan Post Insurance to invest USD 2 billion in a new reinsurance vehicle sponsored by Global Atlantic, expected to commence operations in the first half of 2026 to support portfolio diversification and spread income.
- July 2025: HDI Global SE’s Japan branch, in collaboration with Descartes Underwriting, received approval to launch a parametric earthquake insurance product with Shindo intensity triggers and no deductibles, distributed via networks of brokers and agencies and supported by a major reinsurer.


Research Methodology Framework and Report Scope
Market Definitions and Key Coverage
Our study frames Japan's property and casualty (P&C) insurance market as all gross written premiums collected by licensed non-life carriers for products that protect physical assets or indemnify third-party liabilities, including voluntary auto, fire, marine, transit, and general liability covers. According to Mordor Intelligence, the market behaves in line with domestic catastrophe exposure, motorization trends, and ongoing regulatory reforms.
Scope Exclusions: life, medical, reinsurance, and surety lines are outside this study's remit, as are policies written by foreign branches beyond Japan.
Segmentation Overview
- By Line of Business
- Property Insurance
- Auto Insurance
- Liability Insurance
- Marine, Aviation & Transit Insurance
- Personal Accident & Miscellaneous Casualty
- Other P&C Lines (incl. emerging Cyber, D&O, etc.)
- By Distribution Channel
- Agency Network
- Direct
- Bancassurance
- Brokers
- Affinity & Embedded Partnerships
- Other Channels
- By End-User
- Individuals
- SMEs
- Large Corporations
- Government & Public Sector
- By Geography
- Hokkaido & Tohoku
- Kanto
- Chugoku
- Kyushu & Okinawa
- Rest of Japan
Detailed Research Methodology and Data Validation
Primary Research
Mordor analysts interviewed underwriting managers, brokers, fleet owners, and consumer advocates across Kanto, Kansai, Kyushu, and Hokkaido to validate growth drivers, catastrophe loadings, and channel shifts, complemented by short online surveys targeting SMEs and urban motorists.
Desk Research
We began with freely available authorities such as the General Insurance Association of Japan, the Financial Services Agency, Japan Earthquake Reinsurance statistics, and customs filings to map premium flows and loss ratios, while annual reports and 10-Ks from the listed non-life groups enriched underwriting and investment data. Press releases tracking post-typhoon rate hikes added timely color.
To bridge gaps, our team tapped D&B Hoovers for company financials, Dow Jones Factiva for headline shock events, and Questel patent feeds for telematics product launches. These sources created the backbone of our trend library, yet they are illustrative only; many other open and subscription resources informed data collection and cross-checks.
Market-Sizing & Forecasting
We reconstructed the market value through a top-down gross-premium pool starting with FSA net-premium disclosures, which are then adjusted for retention and offshore placements before being further filtered through average written premium per policy derived from interviews. Selective channel commission roll-ups acted as bottom-up guardrails. Key variables include new vehicle registrations, repair-cost inflation, catastrophe frequency indices, economic-value-based solvency rules, and digital direct-sales penetration. A multivariate regression with ARIMA overlays projects each driver and yields a growth rate, aligning closely with expert consensus.
Data Validation & Update Cycle
Outputs undergo three-layer variance checks, peer review, and a final analyst audit before release. Reports refresh annually, with interim updates triggered by material regulatory changes or catastrophe losses that exceed one standard deviation.
Why Mordor's Japan Property & Casualty Insurance Baseline Earns Trust
Published estimates often diverge; alternate providers may mix personal accident or health lines, apply static currency conversions, or refresh less frequently.
Mordor's scope stays disciplined around statutory non-life classes, our base year aligns to fiscal 2025 yen filings converted at the average Bank of Japan rate, and our yearly refresh captures post-typhoon rate revisions that others miss, which naturally leads to differing totals.
Benchmark comparison
| Market Size | Anonymized source | Primary gap driver |
|---|---|---|
| USD 70.19 B (2025) | Mordor Intelligence | - |
| USD 110.20 B (2024) | Global Consultancy A | Includes accident and health; uses gross premium without retention adjustments |
| USD 53.59 B (2024) | Regional Consultancy B | Counts only property covers; conservative spot FX rate applied |
These contrasts show our figure sits between aggressive and conservative views, giving decision-makers a balanced, transparent baseline anchored to clear variables and repeatable steps.


Key Questions Answered in the Report
How big is Japan's property and casualty insurance in 2026, and where is it headed by 2031?
It stands at USD 71.75 billion in 2026 and is projected to reach USD 80.09 billion by 2031 at a 2.22% CAGR.
Which line leads and which is the fastest growing in Japan P&C?
Auto holds a 50.38% share in 2025, while cyber is projected to post a 17.38% CAGR from 2026 to 2031.
How will the FSA's economic value-based solvency rules affect Japanese non-life carriers in 2026?
The rules take effect for fiscal years ending March 31, 2026, aligning capital to risk and tightening disclosure, which pushes stronger asset-liability management and reinsurance use.
Which regions are driving demand in Japan's P&C?
Kanto led with a 35.38% share in 2025, while Kyushu and Okinawa recorded the fastest growth at a 5.84% CAGR through 2031.
What is changing in Japans distribution for non-life products?
Agencies retain 89.78% share in 2025, but embedded partnerships are expected to grow at 13.84% CAGR as paperless, point-of-sale journeys expand.
What deals and launches were most significant in 2025 and 2026?
Sompo completed the Aspen acquisition in February 2026, MS&AD announced an April 2027 merger of MSI and ADI in February 2026, and Tokio Marine added ID&E and Agrihedge in 2025, while HDI Global and Descartes launched parametric earthquake cover in 2025.
Page last updated on:


