
Market Overview
| Study Period | 2020 - 2031 |
|---|---|
| Forecast Data Period | 2026 - 2031 |
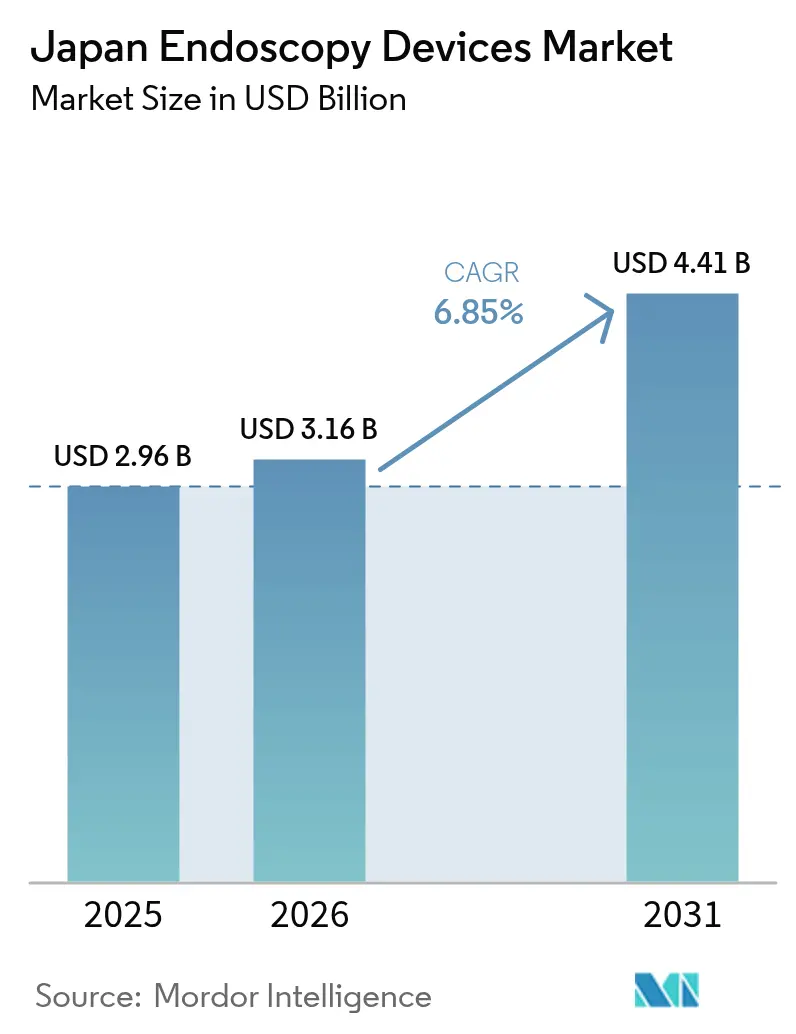
| Base Year Market Size (2025) | USD 2.96 Billion |
| Market Size (2026) | USD 3.16 Billion |
| Market Size (2031) | USD 4.41 Billion |
| Growth Rate (2026 - 2031) | 6.85 % |
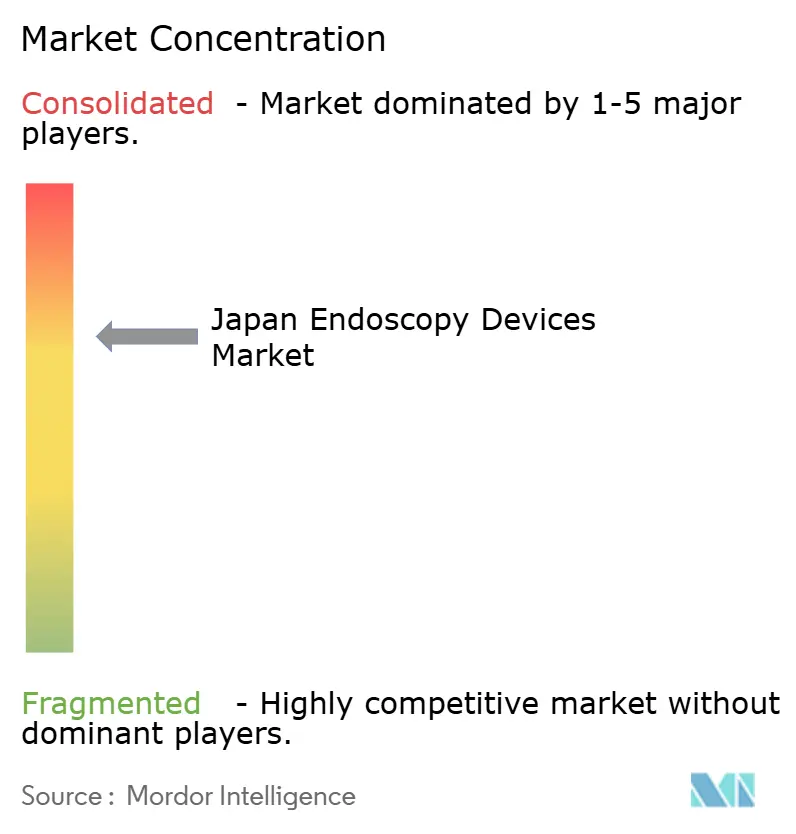
| Market Concentration | Medium |
Major Players *Disclaimer: Major Players sorted in no particular order Image © Mordor Intelligence. Reuse requires attribution under CC BY 4.0. | |
Japan Endoscopy Devices Market Analysis by Mordor Intelligence
The Japan endoscopy devices market size was valued at USD 2.96 billion in 2025 and estimated to grow from USD 3.16 billion in 2026 to reach USD 4.41 billion by 2031, at a CAGR of 6.85% during the forecast period (2026-2031). Japan’s universal health insurance, a rapidly aging population, and rising demand for minimally invasive care together fuel sustained procedure growth. Robot-assisted platforms, AI-guided visualization, and 4K/8K imaging upgrades keep capital expenditure high while enabling earlier lesion detection and more precise therapeutic intervention. Ambulatory surgical centers (ASCs) are scaling quickly as cost-efficient hubs, shifting routine diagnostic work away from hospitals and stimulating demand for compact, high-throughput systems. Domestic champions Olympus, Fujifilm, and Hoya (Pentax) currently dominate, yet foreign entrants leverage AI modules and single-use accessories to gain share, intensifying competitive technology cycles. Forward-looking providers view advanced endoscopy suites as revenue generators rather than cost centers as reimbursement codes for AI-enhanced procedures outpace standard tariffs.
Key Report Takeaways
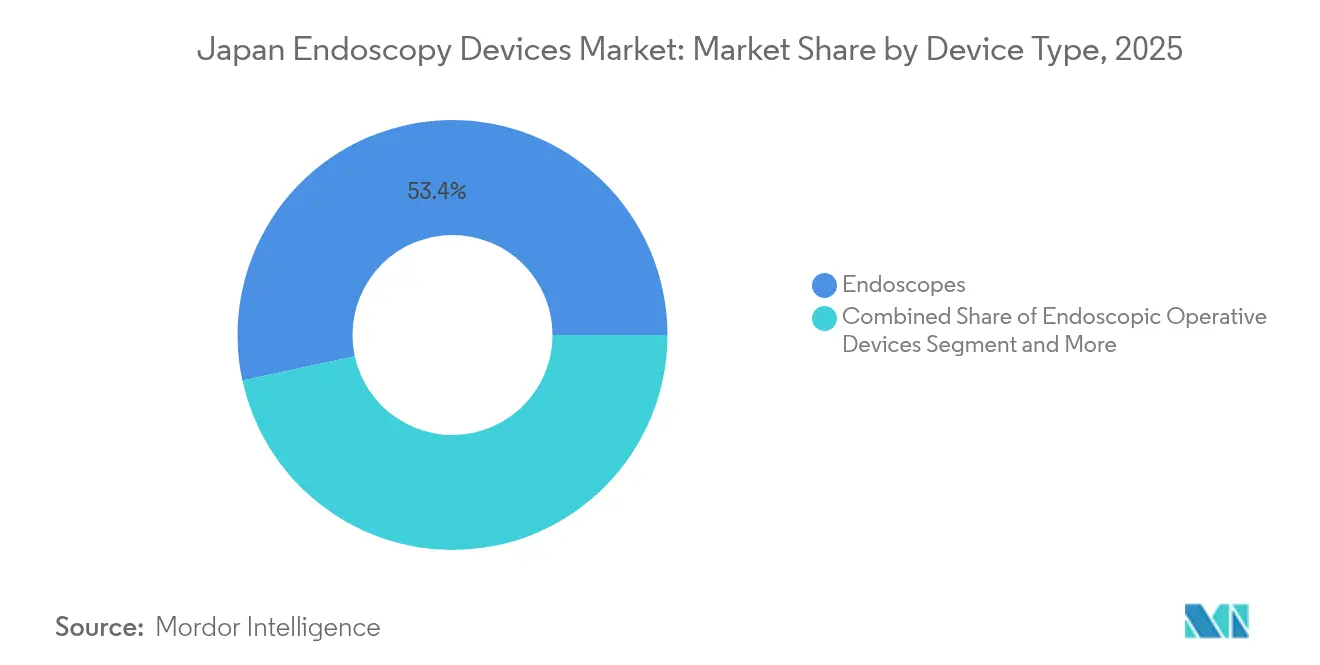
- By device type, conventional flexible endoscopes led with a 53.40% revenue share in 2025; robot-assisted endoscopes are forecast to expand at a 14.1% CAGR to 2031.
- By application, gastroenterology accounted for 60.35% of the Japan endoscopy devices market size in 2025, while urology records the fastest projected growth at 11.7% CAGR through 2031.
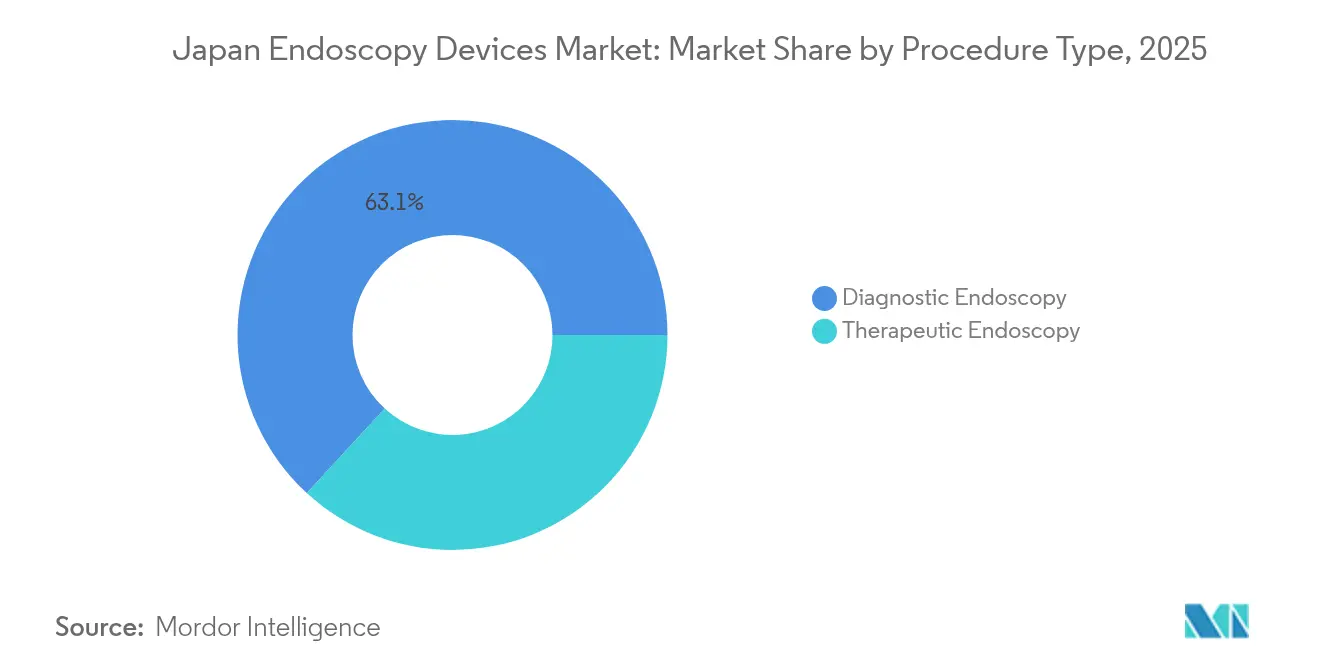
- By procedure type, diagnostic work held 63.15% of the Japan endoscopy devices market share in 2025 and therapeutic procedures are advancing at an 10.6% CAGR to 2031.
- By end user, hospitals captured a 71.10% share of the Japan endoscopy devices market size in 2025, whereas ASCs show the highest growth trajectory at 10% CAGR through 2031.
Note: Market size and forecast figures in this report are generated using Mordor Intelligence’s proprietary estimation framework, updated with the latest available data and insights as of 2026.
Japan Endoscopy Devices Market Trends and Insights
Drivers Impact Analysis*
| Driver | (~) % Impact on CAGR Forecast | Geographic Relevance | Impact Timeline |
|---|---|---|---|
| Universal healthcare reimbursement | +1.8% | National (urban focus) | Medium term (2-4 years) |
| Government cancer-screening mandates | +2.1% | National | Long term (≥ 4 years) |
| ASC network expansion | +1.5% | Urban then regional | Medium term (2-4 years) |
| AI-enabled CADe/CADx adoption | +1.9% | National (university first) | Short term (≤ 2 years) |
| Rising lifestyle-linked GI disorders | +1.2% | National | Long term (≥ 4 years) |
| Source: Mordor Intelligence | |||
Universal Healthcare Coverage Driving Advanced Endoscopy Adoption
Japan’s 2024 revision of National Health Insurance introduced enhanced reimbursement codes for AI-assisted procedures, boosting hospital revenue by up to 30% compared with conventional scopes[1]Michihiro Misawa, “Implementation of Artificial Intelligence in Colonoscopy Practice in Japan,” JMA J, jmaj.jp. Facilities consequently accelerate equipment upgrades to maintain tariff eligibility. Academic hospitals moved first, but regional centers now follow as capital budgets align with higher billings. The policy favors early detection, thereby pushing demand for CADe-enabled colonoscopy that lifts adenoma detection rates and reduces repeat visits. Vendors respond by bundling analytics software with new towers to streamline purchasing decisions. Over the medium term, reimbursement alignment is expected to standardize AI-guided visualization across most prefectures.
Government-Led Cancer Screening Mandates Elevating Procedure Volumes
Biennial gastric and colorectal screenings for citizens older than 50 became compulsory in 2024, driving a 23% jump in total endoscopic procedures that year and a further 18% rise expected in 2025. The mandates particularly boost endoscopic resection volumes, with gastric ESD cases already climbing to 57% of tumor resections. Provincial clinics expand capacity to meet quotas, prompting bulk procurement of visualization towers and high-definition scopes. The government links subsidy allocation to throughput metrics, incentivizing real-time data reporting via the Japan Endoscopy Database. Over the long term, the screening policy anchors a stable procedure pipeline that underpins the Japan endoscopy devices market.
Ambulatory Surgical Centers Expansion Transforming Care Delivery
ASCs performed 22% of Japan’s endoscopic workload in 2024, up from 14% the prior year, as health-policy reforms encourage outpatient care. Purpose-built suites complete 35% more cases per room than hospital units, pushing demand for compact towers and simplified workflow software. Leading vendors target this channel with turnkey packages that include leasing, training, and AI modules optimized for high throughput. Urban saturation guides the next ASC wave into regional hubs, supported by mobile cart systems that require minimal infrastructure. Medium-term growth remains robust as payers benchmark procedure tariffs against inpatient costs.
AI Integration Revolutionizing Diagnostic Capabilities
EndoBRAIN’s 2024 regulatory clearance marked Japan’s first reimbursement-approved CADe solution, unlocking commercial scale-up. Early adopters report 12-15% higher adenoma detection and up to 30% fewer missed lesions. By early 2025, 43% of university hospitals and 28% of regional hospitals had deployed AI-assisted systems. Vendors bundle cloud analytics, predictive maintenance, and training dashboards to justify premium pricing. Short-term impact on CAGR is notable as procurement cycles accelerate ahead of budget resets. Rapid evidence accumulation further validates AI’s clinical and economic value, securing wider reimbursement traction.
Restraints Impact Analysis*
| Restraint | (~) % Impact on CAGR Forecast | Geographic Relevance | Impact Timeline |
|---|---|---|---|
| High capital cost & NHI price controls | -1.3% | National (small facilities) | Medium term (2-4 years) |
| Shortage of certified staff | -1.7% | National (rural acute) | Long term (≥ 4 years) |
| Environmental concerns over single-use scopes | -0.8% | National (eco-focused) | Short term (≤ 2 years) |
| Source: Mordor Intelligence | |||
Capital Costs and Price Controls Creating Investment Barriers
A high-definition system with advanced imaging costs JPY 30-45 million (USD 200,000-300,000)[2]Yusuke Koide et al., “Capital Cost Trends in Japan,” Springer, springer.com. Biennial NHI revisions trim standard-procedure tariffs by 4.2%, stretching payback periods, especially for clinics with limited volume. Subsidies favor new technology, yet smaller providers struggle to raise upfront capital, widening the digital gap. Group purchasing and manufacturer leasing schemes partially mitigate hurdles, but medium-term impact on market CAGR remains negative.
Workforce Shortages Limiting Procedural Capacity
Japan currently lacks about 3,200 certified endoscopists and faces a 42% vacancy rate in rural regions. One-third of practitioners are over 60, raising succession concerns. Nursing deficits complicate sedation safety and instrument reprocessing. Robotic scrub-nurse prototypes show promise but remain experimental. Unless training pipelines expand, capacity constraints will cap procedure growth even as demand rises.
*Our forecasts treat driver/restraint impacts as directional, not additive. The impact forecasts reflect baseline growth, mix effects, and variable interactions.
Segment Analysis
By Device Type: Robot-Assisted Platforms Redefine Precision
Robot-assisted systems represent the fastest-growing category, expanding at a 14.1% CAGR on a small base, while flexible scopes hold the largest revenue share at 53.40% in 2025, underpinning the Japan endoscopy devices market size for visualization hardware. The Hinotori system’s expanded 2024 approval illustrates clinical momentum and vendor commitment. Advanced articulation and tremor reduction support complex ESD and NOTES procedures. Meanwhile, 4K/8K towers spur replacement demand among hospitals aiming to meet AI-module image-quality minima. Accessories enjoy steady pull-through, sustaining margin even as tower pricing faces NHI pressure. Digital Twin integration promises pre-operative simulation that could shorten procedure time and support outcome auditing.
Robot systems command premium pricing, yet leasing models target ASCs eager for differentiation. Capsule devices gain urban traction due to patient preference for non-invasive GI screening, though reimbursement coverage remains limited. Over the forecast, continual optical upgrades, robotics, and connected-care analytics keep this segment central to the Japan endoscopy devices market.



By Application: Gastroenterology Dominates While Urology Accelerates
Gastroenterology contributes 60.35% of revenue, sustained by government screening that locks in high colonoscopy and ESD volumes. Urology, the fastest-advancing application, is growing at 11.7% CAGR as single-port robots enable scar-minimizing nephrectomies and prostatectomies. Orthopedics maintains a steady arthroscopy pipeline, while cardiology leverages intracardiac imaging for ablation guidance. ENT and gynecology climb modestly on the back of specialty scopes and the Dexter robot’s laparoscopic hysterectomy feasibility.
The Japan endoscopy devices market share for gastroenterology is expected to remain dominant through 2031, but incremental revenue will increasingly stem from urology and crossover applications. Vendors thus prioritize modular platforms capable of multi-disciplinary use to maximize return on capital.
By Procedure Type: Therapeutic Endoscopy Gaining Momentum
Diagnostic procedures still generated 63.15% of Japan endoscopy devices market revenue in 2025, yet therapeutic cases now rise at an 10.6% CAGR. Updated 2024 guidelines for colorectal ESD and EMR harmonized technique adoption and credentialing. AI-assisted imaging elevates lesion characterization, allowing “diagnose-and-treat” workflows that blur procedural boundaries. The Japan endoscopy devices market share for therapeutic accessories grows accordingly, supporting disposables such as electrosurgical knives and hemostatic powders.
Hospitals invest in hybrid ORs equipped for advanced intervention, while ASCs focus on high-volume polypectomy and mucosal resection. Over the forecast, payer preference for single-session therapy and patient demand for rapid recovery keep therapeutic expansion ahead of diagnostic growth.
By End User: Hospitals Lead While ASCs Expand Rapidly
Hospitals held 71.10% revenue share in 2025, reflecting comprehensive infrastructure, multi-disciplinary teams, and ability to finance premium systems. The Japan endoscopy devices market size generated by ASCs, however, rises swiftly at a 10% CAGR as outpatient economics align with national cost-containment goals. The Shizuoka Cancer Center demonstrates high-throughput design with 10 procedure rooms and 30 recovery beds.
Hospitals retain complex therapeutic caseloads involving EUS, ERCP, and NOTES, while ASCs capture routine colonoscopies and gastroscopies. Specialty clinics remain niche players focusing on targeted services. The Ministry’s 2024 directive encouraging outpatient care should continue to shift routine work toward ASCs, spurring demand for portable towers and subscription-based AI analytics.
Geography Analysis
Tokyo, Osaka, and Nagoya collectively account for roughly 64.20% of Japan endoscopy devices market revenue thanks to concentrated tertiary hospitals, research institutes, and early-adopter budgets. University centers in these metros reached 43% AI-system penetration by early 2025, versus 28% nationwide. Urban density supports higher screening uptake, creating steady tower replacement cycles every five years.
Regional variation persists: Tottori posts 1,236 gastric resections per million residents, while Okinawa logs just 251, underscoring disparities in specialist supply and screening adherence. Government outreach funds mobile suites and tele-operation pilots leveraging the Hinotori system’s remote capabilities. Such programs aim to narrow diagnostic gaps by 2028.
Rural prefectures house a larger elderly share, elevating procedure demand yet facing acute staffing shortages. Subsidized training and locum incentives aim to add 500 certified endoscopists to underserved areas over the next four years. The Japan Endoscopy Database, expanded in 2024, helps policymakers map resource needs and monitor quality metrics, fostering more equitable market growth across regions.
Regulatory Landscape
Endoscopy devices in Japan are regulated under the Pharmaceuticals and Medical Devices Act (PMD Act). Market entry requires a pathway aligned to device risk class (approval, third-party certification, or notification), with the Pharmaceuticals and Medical Devices Agency (PMDA) conducting the scientific review and the Ministry of Health, Labour and Welfare (MHLW) granting final marketing authorization. For advanced endoscopy platforms that incorporate diagnostic support software, Japan generally treats these modules as Software as a Medical Device (SaMD), which increases the focus on performance evaluation and clinical evidence during review.
Manufacturers and marketing authorization holders must comply with Japan QMS requirements under MHLW Ministerial Ordinance No. 169 (2004), aligned with ISO 13485:2016. This covers design, production, post-market surveillance, and supplier controls. In 2025, Japan passed amendments to the PMD Act (May 14, 2025), with industry implementation and interpretation continuing into 2026. This supports the need for early PMDA consultations for innovative endoscopic imaging, AI-based lesion detection support, and therapeutic devices, where clinical data and documentation expectations can affect review timelines.
Competitive Landscape
Olympus, Medtronic, Boston Scientific Corporation, and others control significant domestic revenue, reflecting decades of optical innovation and entrenched hospital relationships. Olympus’s 2024 Elevate initiative strengthens compliance processes and refreshes its platform range with AI-native towers[3]Olympus Corporation, “Integrated Report 2024,” olympus-global.com. Fujifilm emphasizes 4K imaging with linked AI modules, while Hoya’s pending 2026 spin-off of PENTAX Medical aims to accelerate device-level decision-making and international growth.
Foreign firms attack niche pain points. Boston Scientific expands AXIOS and endoluminal surgery portfolios to capture therapeutic accessory demand. Medtronic leverages GI Genius AI to wedge into visualization sales. Ambu touts sterile single-use scopes that eliminate reprocessing, while AI Medical Service licenses lesion-detection software to multiple hardware OEMs, positioning itself as platform-agnostic.
Future competition will hinge on AI breadth, sustainability credentials, and tailored ASC solutions. Environmental design differentiators, such as recyclable polymers and low-energy light sources, could become purchasing criteria as green-procurement guidelines tighten. Robotics specialists and cloud-analytics vendors are likely collaborators rather than standalone entrants given the capital intensity of core endoscopy hardware.
Japan Endoscopy Devices Industry Leaders
Medtronic PLC
Boston Scientific Corp.
Johnson & Johnson (Ethicon Endo-Surgery)
Olympus Corp.
Cook Group Inc.
- *Disclaimer: Major Players sorted in no particular order

Market Opportunities and Future Outlook
The clearest white space is where reimbursement-aligned AI capabilities intersect with higher screening throughput requirements, since many hospitals and ASCs look for integrated workflows rather than stand-alone hardware replacements. Japan already has a policy-backed procedural pipeline from compulsory biennial gastric and colorectal cancer screening for citizens over 50 (implemented in 2024), and providers are actively upgrading imaging stacks to qualify for AI-enabled clinical pathways. Olympus activities also map to this shift, including the start of Japan sales of the EVIS X1 system with combined NBI+TXI observation mode (November 2025), plus the publication of clinical evidence for its cloud-based CADe application (EAGLE Trial, February 2026), which provides a structured basis for AI adoption discussions with clinicians and administrators.
Regulatory change adds another commercialization lane for innovators working on unmet clinical needs. The PMD Act amendment effective May 2026 expands conditional registration-type pathways for certain devices and IVDs with strong clinical evidence but limited alternatives, which can be relevant for advanced therapeutic endoscopy tools and software-driven adjuncts that do not fit existing certification norms. In parallel, PMDA review points for AI-based lesion detection and SaMD controls push manufacturers toward auditable datasets, performance documentation, and QMS-ready software lifecycle practices, creating room for companies that can package compliant AI modules alongside endoscopy towers, EUS systems, and serviceable subscription models aimed at high-throughput sites.
Recent Industry Developments
- June 2026: Olympus introduced new 4K LCD monitors for the Japanese market to improve endoscopic visualization. The launch supports replacement demand in visualization equipment and complements broader upgrade cycles tied to higher-resolution imaging and AI-ready workflows in endoscopy suites.
- December 2025: Covidien Japan received PMDA approval for an improved version of the PillCam COLON 2 capsule endoscopy system. The update strengthens the capsule endoscopy option for colorectal assessment in settings where noninvasive or lower-resource screening pathways are prioritized.
- January 2024: Canon Medical Systems and Olympus agreed to collaborate on endoscopic ultrasound (EUS) systems, with Japan among the initial launch regions. The partnership aligns a major imaging OEM with a leading endoscopy platform provider, supporting integrated EUS system development and procurement appeal for GI centers expanding advanced diagnostic and therapeutic capabilities.


Research Methodology Framework and Report Scope
Market Definition and Coverage
For this study, the Japan endoscopy devices market is counted as the revenue generated from devices used to perform diagnostic and therapeutic endoscopic procedures in Japan. This includes endoscopes (scopes), visualization equipment, operative devices, and the related accessories and consumables sold for these procedures.
Scope exclusions: This sizing excludes procedure fees, physician services, and general hospital infrastructure that is not sold as endoscopy-specific devices.
Segmentation Overview
- By Device Type
- Endoscopes
- Rigid Endoscope
- Flexible Endoscope
- Capsule Endoscope
- Robot-assisted Endoscope
- Endoscopic Operative Devices
- Visualization Equipment
- Endoscopic Camera
- SD Visualization System
- HD Visualization System
- 4K/8K UHD Visualization System
- Accessories & Consumables
- Endoscopes
- By Application
- Gastroenterology
- Orthopedic Surgery
- Cardiology
- ENT Surgery
- Gynecology
- Urology
- By Procedure Type
- Diagnostic Endoscopy
- Therapeutic Endoscopy
- By End User
- Hospitals
- Ambulatory Surgical Centers (ASCs)
- Specialty Clinics
Data Sources, Market Sizing, and Validation
Desk Research
Desk work starts by compiling a fact base on Japan healthcare delivery and procedure demand, then mapping how endoscopy device sales are reported across public channels. We typically rely on public sources such as Japan Ministry of Health, Labour and Welfare statistics, OECD health data, WHO health indicators, and peer reviewed clinical journals that track screening and procedure volumes.
To convert demand signals into revenue, we also review regulatory and product context using sources such as PMDA safety updates and device approval listings. Trade association publications and hospital or academic society guidance on endoscopy adoption are used to understand category level uptake. Company annual reports, investor presentations, and local press help confirm product mix direction, for example shifts toward high definition visualization and growth in therapeutic use. Where needed, paid subscriptions for company financials, news, patent databases, and import export shipment level data are used only to cross-check units, pricing direction, and timing. The sources listed here are illustrative, and many other public and paid references were used for data collection, validation, and research clarification.
Primary Interviews and Surveys
Primary discussions were run with a mix of manufacturers, distributors, hospital procurement teams, and clinicians who routinely use endoscopy systems. This helps the model reflect both supply side realities and clinical utilization in Japan. We use these inputs to validate the splits across scopes, visualization, operative devices, and recurring accessories, then to pressure test pricing and replacement cycles across care settings in Japan.
Distribution of primary research fieldwork respondents
| Company type | Respondent position |
|---|---|
| Top tier: 28% | CXOs: 17% |
| Mid tier: 55% | Functional/Unit leaders: 25% |
| Smaller Players: 17% | Managers: 58% |
Market-Sizing & Forecasting
Sizing begins with a top-down build that reconstructs the addressable demand pool from Japan procedure activity and the care setting mix, then ties it to category level device spending patterns. Inputs that tend to matter most include diagnostic versus therapeutic procedure share, installed base and replacement cycle for flexible and rigid endoscopes, penetration of HD and 4K visualization stacks, disposable accessory usage intensity per procedure, and the shift of eligible cases toward ambulatory surgical centers.
These totals are then cross checked with selective bottom-up approximations, such as rolling up representative supplier revenues in Japan, using sampled ASP x unit ranges for key device classes, and validating channel markups through distributor checks. When gaps show up, for instance limited public visibility for certain accessories and consumables, assumptions are filled through interview-led ranges and then narrowed using hospital procurement patterns and typical per procedure consumption. For forecasting, scenario analysis is used around procedure growth, replacement timing, and pricing progression, and the final trajectory is aligned to what experts expect on upgrade cycles and reimbursement sensitivity.
Data Validation & Update Cycle
Validation is done through multiple passes that compare the model output with independent signals, and then exceptions are investigated before sign off. We check for sharp year to year jumps, inconsistent shares across device classes, and any mismatch between procedure growth and implied device demand.
A second analyst review is used to re-test the key assumptions, and follow up calls are triggered when interview feedback or new public disclosures change a critical variable such as ASP direction or replacement cadence. Reports are refreshed annually, and interim updates are made when material events occur, such as major regulatory actions, technology shifts in visualization standards, or demand shocks. Before delivery, a final refresh pass is completed so clients receive the latest updated view.
Mordor Intelligence's Japan Endoscopy Devices Market Size Compared With Other Published Estimates
Published market values for Japan endoscopy devices do not always match, and the gaps usually come from differences in product coverage, different base years, and different ways of converting procedure signals into device revenue. Some sources also mix broader minimally invasive surgery tools into the same bucket, which can inflate totals, and the forecast trend can look smoother than what procurement cycles typically show.
A common difference is whether recurring accessories and consumables are fully counted, and how robot-assisted systems and visualization stacks are treated when they are sold as part of a bundled setup. Some external estimates lean heavily on a single base year and keep pricing constant, and then currency timing and update cadence create additional spread. Some studies also use a narrower definition that focuses mainly on endoscopes, which reduces the stated size and changes the growth profile. In Mordor Intelligence, we count only endoscopy-specific scopes, visualization equipment, operative devices, and related accessories and consumables sold into Japan. We also refresh procedure mix and replacement timing as new signals appear.
Benchmark comparison
| Source | Market Size | Gaps in Research Methodology |
|---|---|---|
| Mordor Intelligence | USD 2.96 B (2025) | |
| Global Consultancy A | USD 2.47 B (2024) | Uses an earlier base year and appears to rely more on product type splits with limited clarity on how accessories and consumables are valued, which can understate recurring revenue. |
| Industry Publisher B | USD 2.39 B (2022) | Uses an older starting year and may emphasize endoscope and visualization system revenues more than operative devices and full consumables pull through, which reduces the total and changes the mix. |
Overall, the spread is mostly explained by base year choice and what is included beyond the core scopes. By keeping the scope tied to endoscopy-specific device categories and then checking the totals against procedure mix and replacement behavior, the final market size stays traceable to clear inputs and repeatable steps.


Key Questions Answered in the Report
How fast will demand for robot-assisted scopes grow in Japan?
Robot-assisted endoscopes are projected to expand at a 14.1% CAGR between 2026 and 2031, the highest among all device categories.
Which clinical area drives the largest share of Japanese endoscope spending?
Gastroenterology represents 60.35% of national revenue in 2025 due to mandatory gastric and colorectal screenings.
Why are ASCs important for equipment vendors?
ASCs already perform 22% of procedures and grow at a 10% CAGR, creating a high-throughput customer base for compact, AI-ready systems.
What limits wider roll-out of single-use endoscopes?
Environmental waste concerns and higher per-procedure cost discourage adoption despite infection-control advantages.
How is AI changing routine colonoscopy?
CADe and CADx modules boost adenoma detection by up to 15% and cut missed lesions 30%, leading to favorable reimbursement and rapid hospital uptake.
Which regions in Japan face the greatest endoscopy access gaps?
Rural prefectures, notably Okinawa, still show low procedure rates due to specialist shortages, spurring policy-backed mobile and tele-endoscopy programs.
Page last updated on:


 Your data is secure and never sold or shared.


