
Indonesia Social Commerce Market Size and Share
Market Overview
| Study Period | 2020 - 2031 |
|---|---|
| Forecast Data Period | 2026 - 2031 |
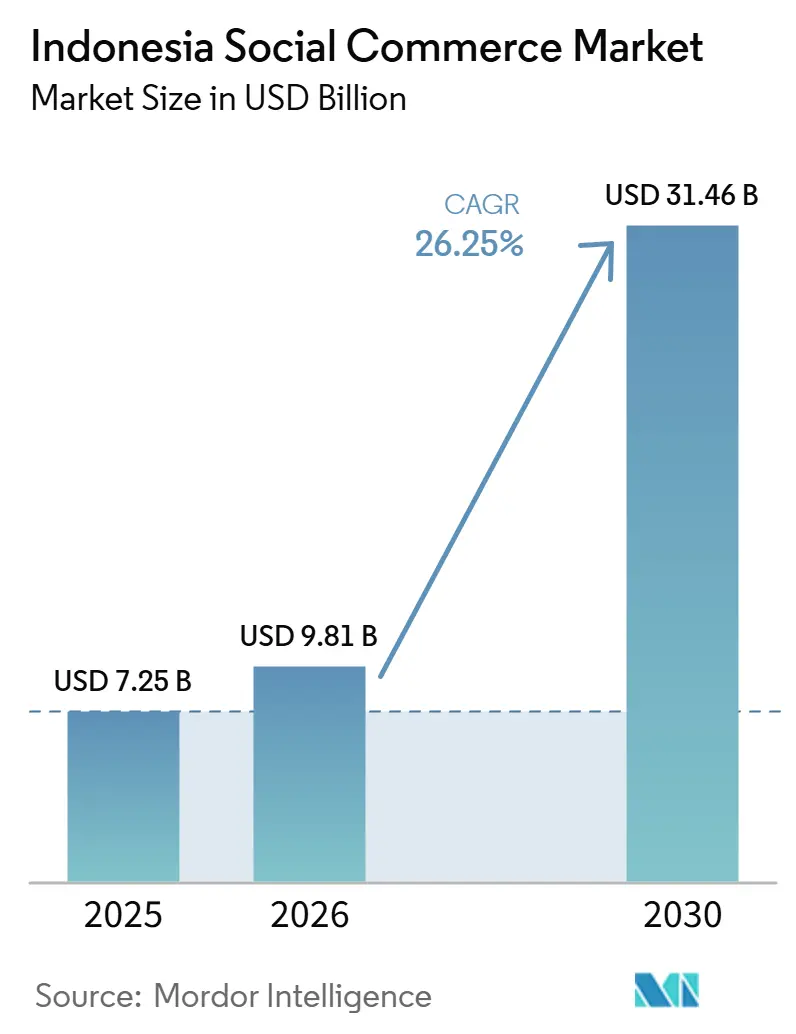
| Base Year Market Size (2025) | USD 7.25 Billion |
| Market Size (2026) | USD 9.81 Billion |
| Market Size (2031) | USD 31.46 Billion |
| Growth Rate (2026 - 2031) | 26.25 % |
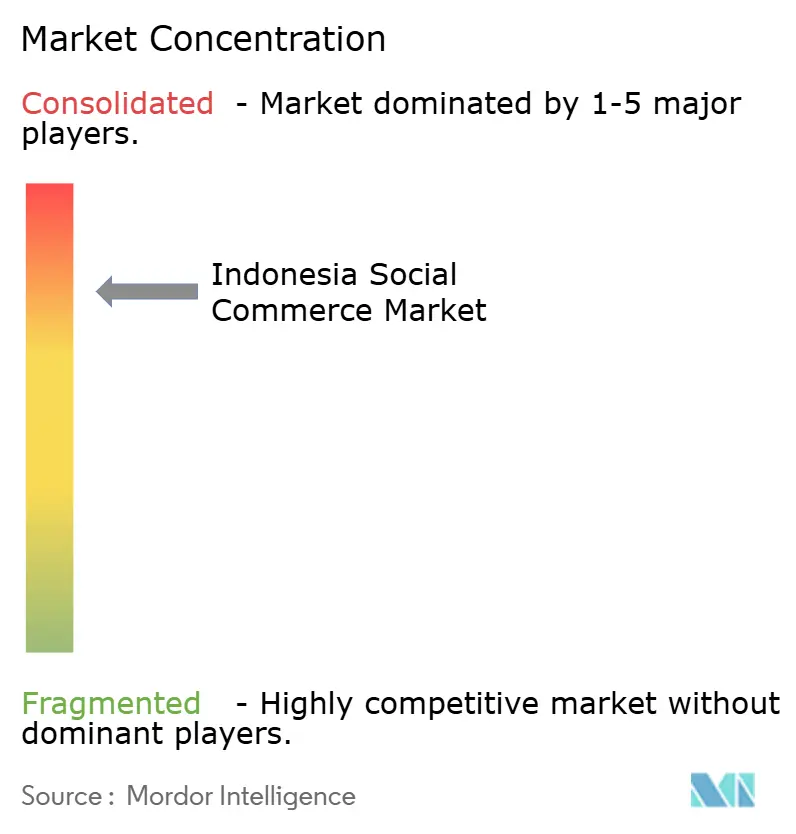
| Market Concentration | High |
Major Players *Disclaimer: Major Players sorted in no particular order Image © Mordor Intelligence. Reuse requires attribution under CC BY 4.0. | |
Indonesia Social Commerce Market Analysis by Mordor Intelligence
The Indonesia social commerce market size was valued at USD 7.25 billion in 2025 and is estimated to grow from USD 9.81 billion in 2026 to USD 31.46 billion by 2031, at a CAGR of 26.25% during the forecast period 2026-2031. Mobile-led shopping, short-form video, and live selling are converging product discovery and purchase decisions into a single consumer journey. The Indonesia social commerce market benefits from a large, connected population, wider adoption of digital payment methods, and a retail culture that responds to creator recommendations. Platforms are competing for creators, affiliate sellers, and local merchants because these groups determine content supply and customer reach. Regulatory separation between social media and transactional functions, delivery costs outside major islands, and trust in affiliates will shape how quickly Indonesia's social commerce market develops.
Key Report Takeaways
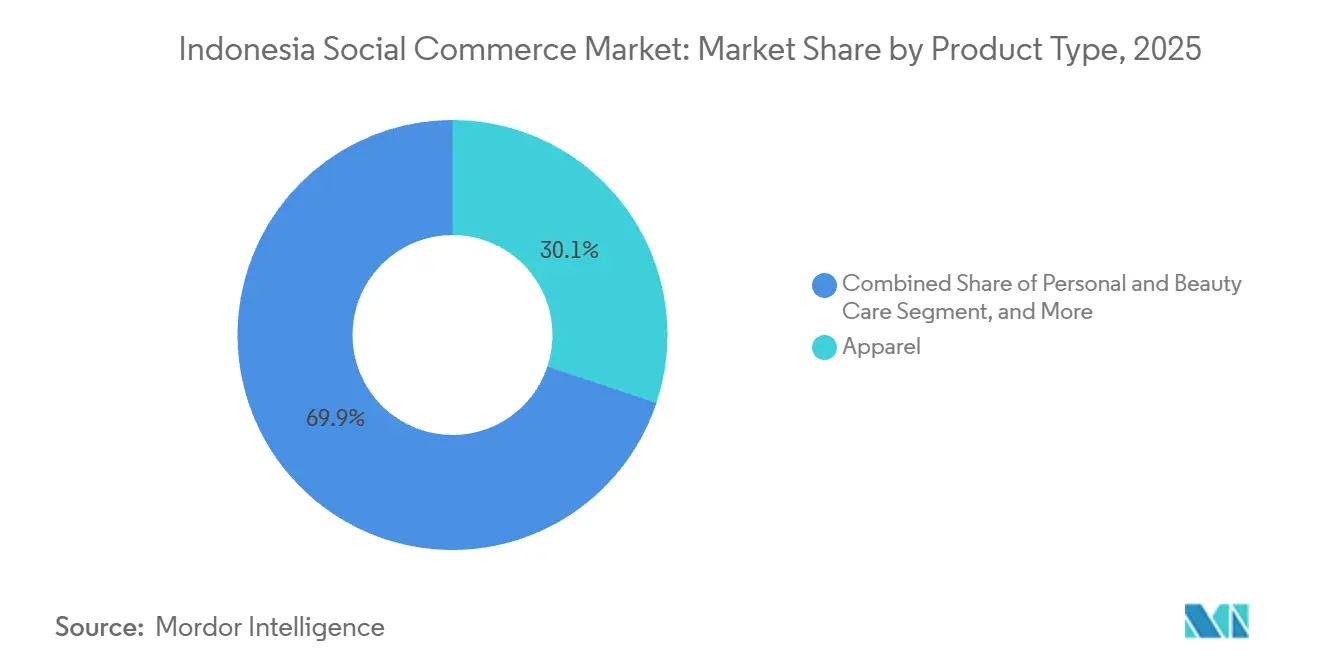
- By product type, apparel held 30.12% of the Indonesia social commerce market in 2025, while personal and beauty care is projected to expand at a CAGR of 26.28% through 2031.
- By device, smartphones accounted for 81.52% of the Indonesia social commerce market in 2025 and are projected to grow at a CAGR of 27.51% through 2031.
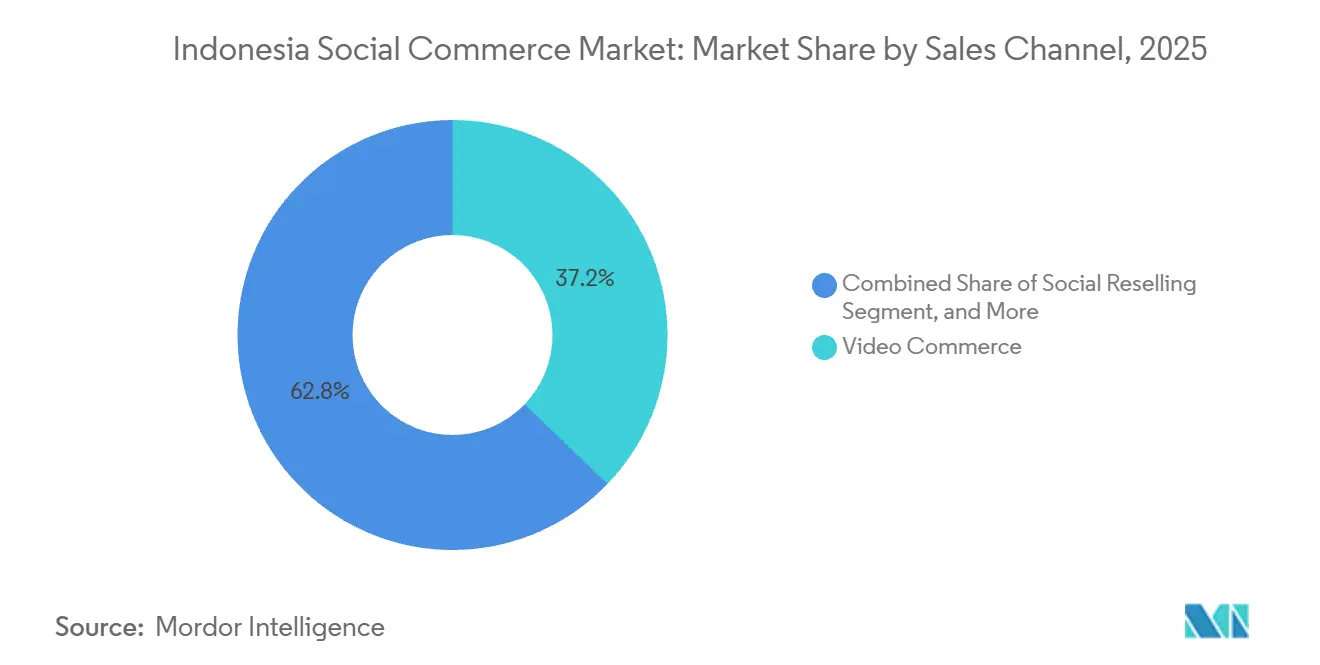
- By sales channel, video commerce held 37.18% of the Indonesia social commerce market in 2025, while social reselling is projected to grow at a CAGR of 28.19% through 2031.
Note: Market size and forecast figures in this report are generated using Mordor Intelligence’s proprietary estimation framework, updated with the latest available data and insights as of January 2026.
Indonesia Social Commerce Market Trends and Insights
Drivers Impact Analysis*
| Driver | (~) % Impact on CAGR Forecast | Geographic Relevance | Impact Timeline |
|---|---|---|---|
| Live Video Commerce and Creator-Led Product Demonstration | +5.5% | National, with peak activity in Java, Sumatra, and Sulawesi | Short term (≤ 2 years) |
| Smartphone-First Shopping and Low-Friction Discovery | +4.8% | National, extending into Tier 2-4 cities in Kalimantan and Sumatra | Short term (≤ 2 years) |
| Digital Payments and Embedded Checkout Expansion | +4.2% | National core, expanding to outer islands through QRIS merchant onboarding | Medium term (2-4 years) |
| Mainstreaming of Affiliate and Social Reselling Models | +3.8% | National, strongest in Tier 2-4 cities across Java and Sumatra | Medium term (2-4 years) |
| MSME Digitization and Community-Based Distribution | +3.2% | Tier 2-4 cities across Java, Kalimantan, Sulawesi, and Sumatra | Medium term (2-4 years) |
| Platform-Integrated Retail Media and Personalization | +2.5% | Jakarta, Surabaya, Bandung, and Medan urban cores | Long term (≥ 4 years) |
| Source: Mordor Intelligence | |||
Live Video Commerce and Creator-Led Product Demonstration
Video commerce has changed how consumers assess products in the Indonesia social commerce market. Live sessions let creators show fit, use, and product details while answering questions before a buyer completes an order. Indonesia recorded 2.6 billion video commerce transactions in 2025, up 90% from the prior year, while the number of active video-selling merchants rose 75% to 800,000. The format gives small merchants a way to present products without the cost of a physical retail presence or a large advertising budget. Indonesia ranked first in Southeast Asia in video commerce transaction volume in 2025, underscoring the role of entertainment-led retail in the country. Low order values of USD 4.5 and USD 6 can still produce substantial platform volume when repeat purchases and creator-led traffic occur at scale.
Smartphone-First Shopping and Low-Friction Discovery
The Indonesia social commerce market is built around consumers who use smartphones as their main internet device. Smartphones accounted for 84.31% of internet access among Indonesia's 235 million internet users in 2026, while e-commerce and digital transactions accounted for 18.7% of online activity. A short video can lead to a product page, then to a wallet payment, within a single mobile session. This flow reduces the steps between discovery and purchase compared with desktop-based shopping. First-time users in outer-island areas and in Tier 2 and 4 cities enter online retail through affordable handsets rather than by moving from computers. A 2026 study of Indonesian Generation Z found that perceived influencer authenticity was positively associated with purchase behavior, reinforcing the importance of creator-led mobile discovery.
Digital Payments and Embedded Checkout Expansion
Digital payment interoperability supports repeat purchases across the Indonesia social commerce market. QRIS reached 42 million registered merchants and processed 13.66 billion transactions during 2025, supported by 59 million active users.[1] QRIS enables buyers to use a compatible wallet without a separate payment setup for each merchant. GoPay, OVO, DANA, ShopeePay, and LinkAja can operate through this common payment framework. From March 31, 2026, non-bank payment service providers became eligible to join BI-FAST as indirect participants under PADG 3/2026. The zero Merchant Discount Rate for qualifying micro-business payments below IDR 500,000 (USD 27.84) also gives small sellers a reason to adopt digital checkout tools.
Mainstreaming of Affiliate and Social Reselling Models
Affiliate and reselling models broaden the seller base in Indonesia social commerce market. They allow individuals to promote products, earn commissions, and build customer relationships without carrying inventory. Shopee stated that local product sales from Shopee Video and Shopee Live increased by more than 50% in 2025 as affiliate activity expanded.[2] This model is particularly relevant in smaller cities, where community contacts can support product discovery and delivery coordination. Lazada committed USD 100 million annually to LazAffiliate in 2025 and joined Meta's affiliate partnership program in July 2026, allowing creators to tag Lazada products on Instagram and Facebook. As more affiliates compete for similar audiences, platforms will need commission structures that reward reliable content and sustained sales.
Restraints Impact Analysis*
| Restraint | (~) % Impact on CAGR Forecast | Geographic Relevance | Impact Timeline |
|---|---|---|---|
| Separation of Social Media and E-Commerce Transactions | -2.8% | National, particularly affecting integrated social commerce platforms | Short term (≤ 2 years) |
| Archipelagic Last-Mile Cost and Service Variability | -2.2% | Outer islands, Papua, Maluku, Nusa Tenggara, and eastern Kalimantan | Long term (≥ 4 years) |
| Creator Trust, Product Authenticity, and Return-Rate Risk | -1.6% | National, more acute in beauty, health supplements, and apparel | Medium term (2-4 years) |
| Platform Dependency and Volatile Commission Economics | -1.4% | National | Medium term (2-4 years) |
| Source: Mordor Intelligence | |||
Separation of Social Media and E-Commerce Transactions
The separation of social media and payment activity adds a compliance constraint to the Indonesian social commerce market. Permendag 31/2023 prevents social media platforms from directly facilitating payment transactions within their own interfaces. The rule required TikTok Shop to suspend in-app transactions in 2023 and later operate through its Tokopedia arrangement. The required handoff from social discovery to a marketplace checkout can interrupt a purchase journey that depends on speed and convenience. KPPU began an investigation into TikTok Shop's business operations in August 2026 concerning suspected violations of Law No. 5/1999. New entrants must therefore account for local transaction rules and customer acquisition costs.[3]
Archipelagic Last-Mile Cost and Service Variability
Indonesia's island geography creates a continuing delivery challenge for the Indonesia social commerce market. Delivering low-value orders to eastern provinces can absorb a significant share of merchant and platform margin. Government Regulation No. 8/2025 required courier companies to operate in at least 50% of Indonesia's 38 provinces within 12 to 18 months and limited promotional discount days to 3 per month.[4] The requirement should improve coverage, but Papua, Maluku, Nusa Tenggara, and parts of Kalimantan still face service gaps. These gaps can raise delivery fees and delay orders for customers outside the major urban centers. Platforms that expand local fulfillment and coordinate community sellers can reduce this constraint without relying only on broad shipping subsidies.
*Our forecasts treat driver/restraint impacts as directional, not additive. The impact forecasts reflect baseline growth, mix effects, and variable interactions.
Segment Analysis
By Product Type: Apparel Anchors Revenue While Beauty Accelerates
Apparel held 30.12% of Indonesia social commerce market share in 2025, making it the largest product category. Live selling suits apparel because creators can show fabric, fit, color, and styling in real time. Casual and streetwear were prominent in TikTok Shop Indonesia apparel sales during the first quarter of 2025. Oversized fits, headscarves, and affordable daily wear supported frequent purchases at relatively low basket values. Accessories, home products, health supplements, and food and beverages completed the category mix.
Personal and beauty care is projected to record the highest CAGR, at 26.28%, among product categories from 2026 to 2031. The Indonesia social commerce industry has favorable conditions for this category because tutorials and product reviews can explain use, texture, and results in a direct format. idEA described beauty and personal care as a leading online shopping category in 2025, and BPS data identified personal care as one of the goods most frequently purchased online during the third quarter. Indonesia's beauty sector recorded 12% 15% same-store growth in 2025, while overall retail growth remained below 5%. Indonesian Generation Z respondents viewed micro-influencers as more authentic than macro-influencers in the beauty context.

By Device: Smartphone Consolidates Its Structural Lead
Smartphones commanded 81.52% of Indonesia social commerce market share in 2025 and are projected to grow at a CAGR of 27.51% through 2031. The device supports browsing, livestream viewing, creator interaction, payments, and delivery tracking within a single workflow. New users in Tier 2 4 cities and outer-island areas often begin their online retail activity on mobile devices. This pattern reinforces the smartphone's position as the principal customer access point. Mobile hardware can now support video, payment, and merchant tools that once required a desktop.
Laptops and desktops represented the remaining 18.48% of device-based access in 2025. These devices retain a practical role for merchant operations rather than consumer discovery. Sellers use larger screens to manage product listings, inventory, live-stream schedules, and campaign reporting. Business buyers may also prefer desktop devices for larger or more detailed transactions. Brand teams can use these devices to supervise creator programs and affiliate activity.
By Sales Channel: Video Commerce Leads While Social Reselling Gains Ground
Video commerce accounted for 37.18% of the Indonesia social commerce market size in 2025, making it the leading sales channel. Its growth reflects the move from static product pages to live sessions and short-form product demonstrations. Video commerce contributed 25% of Indonesia's total e-commerce GMV in 2025, compared with less than 5% in 2022. Social network-led commerce facilitates the discovery of fashion and fast-moving consumer goods through services such as Instagram Shopping and Facebook Marketplace. Product review platforms support higher-consideration purchases, including health supplements and consumer electronics, by providing a source of product research.
Social reselling is projected to grow at a CAGR of 28.19% from 2026 to 2031, the strongest channel growth rate. Evermos reported more than 1.1 million active resellers in 2024, of whom 86% were women, and said its network supported more than 600 active MSMEs across 1,800 cities and towns in 34 provinces. This approach helps communities access products in locations where conventional e-commerce delivery can be expensive. The Indonesia social commerce industry also uses affiliate models to create flexible income opportunities for individuals. In February 2026, Shopee Indonesia and the Ministry of Manpower launched a Training of Trainers affiliate program to develop certified affiliate trainers.
Geography Analysis
The Indonesia social commerce market is concentrated in Greater Jakarta, Surabaya, Bandung, and Medan, where smartphone use, purchasing power, and delivery networks are well established. National internet penetration reached 81.72% in 2026. Major Java cities have internet access above the national level, while Maluku and Papua remain below it. This difference creates two distinct operating environments for merchants and platforms. The urban core has dense demand and more frequent content-led shopping activity.
Ramadan 2026 activity across TikTok Shop, Shopee Live, and Tokopedia reached IDR 28.5 trillion (USD 1.73 billion) during the pre-Ramadan and Lebaran period. The value was 34% higher than Ramadan 2025. Livestreaming accounted for 41% of total social commerce GMV during the period, compared with 27% in Ramadan 2025. These figures show the importance of high-intent seasonal retail in Java and major cities in Sumatra. The Indonesia social commerce market size in these urban areas is supported by concentrated logistics capacity and large creator audiences.
Tier 2: 4 cities and outer-island provinces offer a different growth path. Evermos reached 1,800 underserved cities and towns across 34 provinces, demonstrating that community reselling can serve areas where standard delivery models are difficult to operate. Smartphone penetration is projected to reach 91.3% by 2028, extending the potential buyer base in Kalimantan, Sulawesi, and Nusa Tenggara. Courier coverage rules can gradually narrow the delivery gap outside Java.
Competitive Landscape
The Indonesia social commerce market is moving toward a structure centered on Shopee and TikTok Shop by Tokopedia. Shopee had a 47.5% user access rate in 2026, while TikTok Shop increased from 27.4% in 2025 to 33.4% in 2026. Lazada declined from 9.1% to 6.2% over the same period. This shift highlights the advantage of platforms that combine product choice with live, creator-led discovery. Competition is increasingly based on the ability to attract merchants and creators rather than product assortment alone.
Shopee has expanded its Shopee Live co-hosting, allowing 2 creators to co-host a session. TikTok Shop relies on short-form video discovery and its Tokopedia transaction structure to maintain its Indonesian presence. Lazada committed USD 100 million annually to LazAffiliate and later joined Meta's affiliate partnership program in July 2026. The Indonesia social commerce market is also supported by specialist firms that provide social reselling, omnichannel selling, and creator campaign services.
Evermos serves the social reselling model, while SIRCLO supports omnichannel enablement, and AnyMind Group provides creator monetization infrastructure. Meta contributes to product discovery through Instagram Shopping and Facebook Marketplace. The KPPU investigation of TikTok Shop creates regulatory uncertainty for a major platform and may increase seller attention to platform dependency. Sellers will consider commission transparency, payment disbursement, and access to portable business data when choosing a platform.
Indonesia Social Commerce Industry Leaders
-
Sea Limited
-
TikTok Ltd.
-
Lazada South East Asia Pte. Ltd.
-
PT Global Digital Niaga Tbk
-
PT Bukalapak.com Tbk
- *Disclaimer: Major Players sorted in no particular order
Recent Industry Developments
- August 2026: Indonesia's Commission for the Supervision of Business Competition, KPPU, commenced a formal investigation into TikTok Shop's business operations for suspected violations of Articles 14, 17, 19, and 20 of Law No. 5/1999 on the Prohibition of Monopolistic Practices and Unfair Business Competition. The probe focused on TikTok Shop's seller relationship practices and alleged attempts at market dominance through the TikTok Shop-Tokopedia commercial structure.
- July 2026: Lazada South East Asia officially joined Meta's Facebook Affiliate Partnerships program, enabling content creators across Indonesia to tag Lazada products directly on Instagram and Facebook and earn commissions on completed purchases. This move followed Lazada's USD 100 million annual LazAffiliate program commitment announced in 2025.
- March 2026: Bank Indonesia's PADG 3/2026 regulation enabled non-bank payment service providers to join BI-FAST as indirect participants from March 31, 2026. BI-FAST recorded 1.529 billion transactions valued at IDR 3,777 trillion (USD 210.2 billion) in the second quarter of 2026, representing 38.09% year-on-year growth.
- February 2026: Shopee Indonesia and Indonesia's Ministry of Manpower launched a Training of Trainers affiliate program, producing certified trainers to build Indonesia's creator commerce workforce. The program produced verified affiliate earners with documented commission income from fashion product promotion within 5 months of launch.
Indonesia Social Commerce Market Report Scope
The Indonesia social commerce market refers to the ecosystem of buying and selling goods and services directly through social media platforms, influencer networks, and community-driven channels within Indonesia. This market encompasses transactions facilitated via video commerce, social network-led storefronts, social reselling, group buying, and product discovery platforms. By integrating e-commerce capabilities directly into social experiences on smartphones and desktops, social commerce enables brands and retailers in Indonesia to shorten the customer journey from product discovery to purchase, leveraging interactive content, live streaming, and peer recommendations to drive sales.
The Indonesia Social Commerce Market Report is Segmented by Product Type (Apparel, Personal and Beauty Care, Accessories, Home Products, Health Supplements, Food and Beverages, and Other Product Types), Device (Laptops and Desktops, and Smartphone), and Sales Channel (Video Commerce, Social Network-Led Commerce, Social Reselling, Group Buying / Team Purchase, and Product Review and Discovery Platforms). The Market Forecasts are Provided in Terms of Value (USD).
| Apparel |
| Personal and Beauty Care |
| Accessories |
| Home Products |
| Health Supplements |
| Food and Beverages |
| Other Product Types |
| Laptops and Desktops |
| Smartphone |
| Video Commerce |
| Social Network-Led Commerce |
| Social Reselling |
| Group Buying / Team Purchase |
| Product Review and Discovery Platforms |
| By Product Type | Apparel |
| Personal and Beauty Care | |
| Accessories | |
| Home Products | |
| Health Supplements | |
| Food and Beverages | |
| Other Product Types | |
| By Device | Laptops and Desktops |
| Smartphone | |
| By Sales Channel | Video Commerce |
| Social Network-Led Commerce | |
| Social Reselling | |
| Group Buying / Team Purchase | |
| Product Review and Discovery Platforms |
Key Questions Answered in the Report
What is the size of the Indonesia social commerce market?
The Indonesia social commerce market was valued at USD 7.25 billion in 2025, is estimated at USD 9.81 billion in 2026, and is forecast to reach USD 31.46 billion by 2031. The outlook reflects a mobile-led retail environment where video discovery, creator content, and embedded payment tools are closely linked.
What growth rate is projected through 2031?
The sector is projected to grow at a CAGR of 26.25% from 2026 to 2031. Growth depends on continued consumer use of smartphones, wider digital payment access, and seller participation in video and affiliate programs.
Which product category leads social commerce sales in Indonesia?
Apparel led product sales with a 30.12% share in 2025, supported by live demonstrations, styling content, and frequent purchases. Apparel is well suited to real-time product presentation because viewers can see fit, color, and styling before ordering.
Which sales channel is growing fastest in Indonesia?
Social reselling is projected to grow at a CAGR of 28.19% through 2031, supported by affiliate tools and community-based seller networks. The channel gives individuals a route to earn commissions without holding stock, while helping merchants reach smaller cities.
Why are smartphones important for online social purchasing?
Smartphones represented 81.52% of device-based access in 2025 and support discovery, livestream viewing, payment, and delivery tracking in one workflow. This matters because many new internet users outside the largest cities begin online retail activity on a mobile device.
What limits adoption outside Indonesia's major cities?
Higher last-mile delivery costs, uneven courier coverage, and lower connectivity in eastern provinces remain important constraints. Community-based reselling and local content can help reach these areas, but they do not remove the underlying delivery cost challenge.