
Market Overview
| Study Period | 2020 - 2031 |
|---|---|
| Forecast Data Period | 2026 - 2031 |
| Base Year Market Size (2025) | 1.20 Billion liters |
| Market Volume (2026) | 1.23 Billion liters |
| Market Volume (2031) | 1.41 Billion liters |
| Growth Rate (2026 - 2031) | 2.71 % |
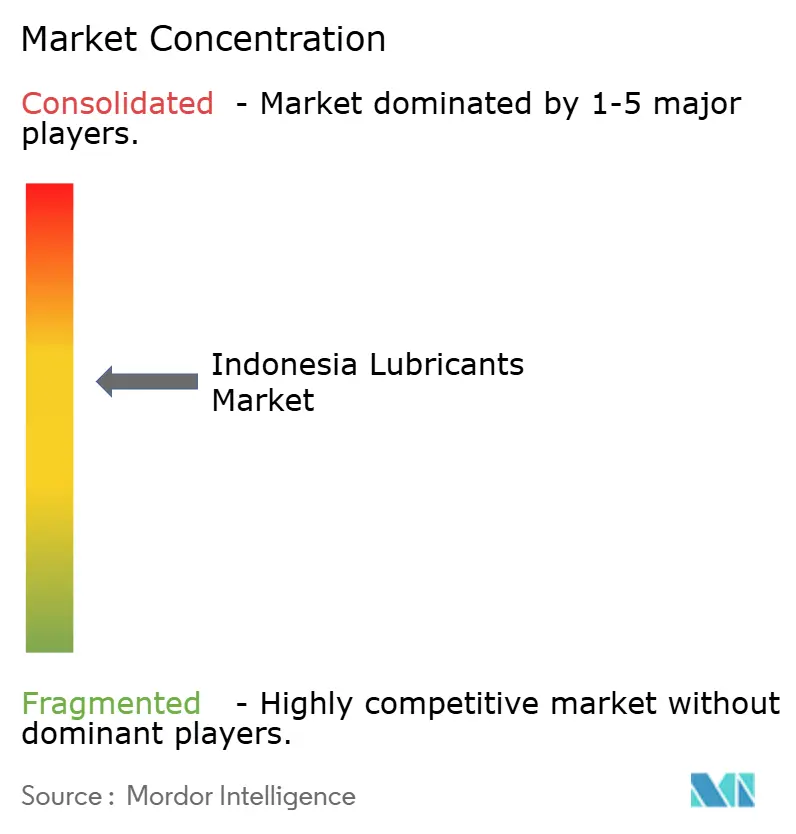
| Market Concentration | Medium |
Major Players
*Disclaimer: Major Players sorted in no particular order Image © Mordor Intelligence. Reuse requires attribution under CC BY 4.0. |
|
Indonesia Lubricants Market Analysis by Mordor Intelligence
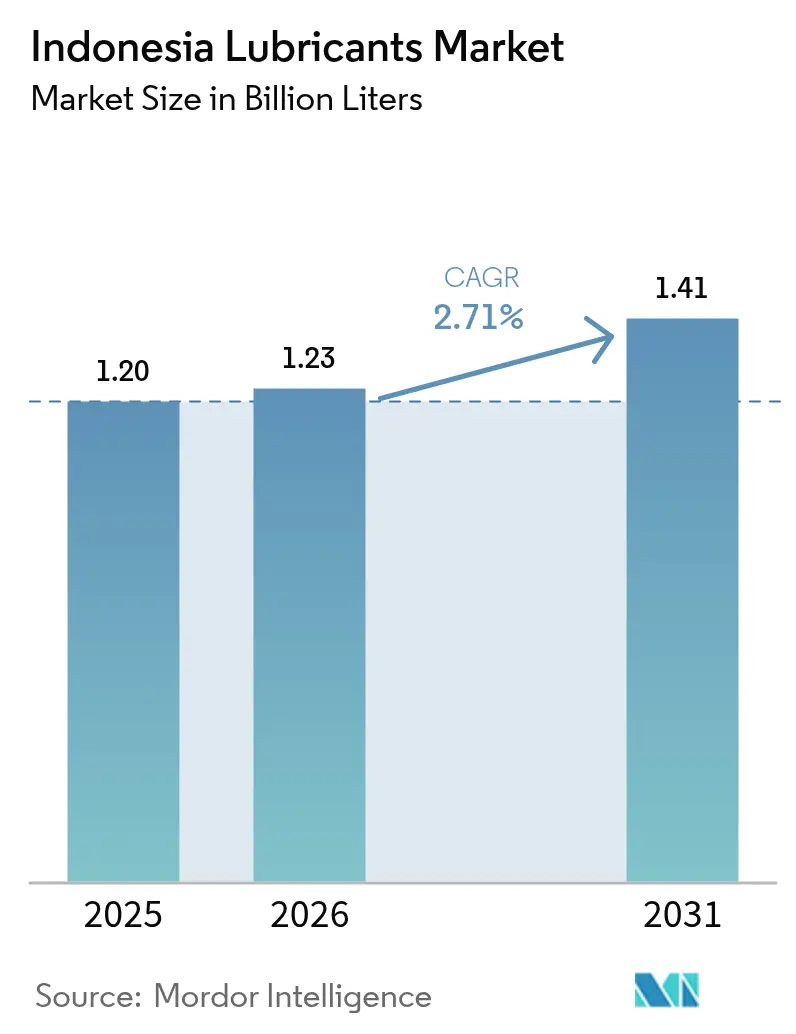
The Indonesian Lubricants Market size was valued at 1.20 billion liters in 2025 and estimated to grow from 1.23 billion liters in 2026 to reach 1.41 billion liters by 2031, at a CAGR of 2.71% during the forecast period (2026-2031). Demand continues to track Indonesia’s steady industrial expansion, resolute infrastructure pipeline, and resilient vehicle parc, even as electric-mobility policies loom. Mineral-oil products still account for two-thirds of volume, yet the premium shift to synthetics accelerates because extended drain intervals appeal to fleet operators seeking lower lifetime operating costs. Capacity additions by multinationals—from Shell’s new grease plant to ExxonMobil’s on-site MACHINEXT service—underline how technology, localized production, and distribution reach shape competitive advantage. Meanwhile, mandatory SNI certification, B40 biodiesel adoption, and volatile crude prices intensify cost pressures, prompting portfolio upgrades toward anti-corrosion additives and bio-based blends. Supply-chain complexity across 17,000 islands creates logistical challenges, particularly for reaching high-value mining and industrial applications in outer regions.
Key Report Takeaways
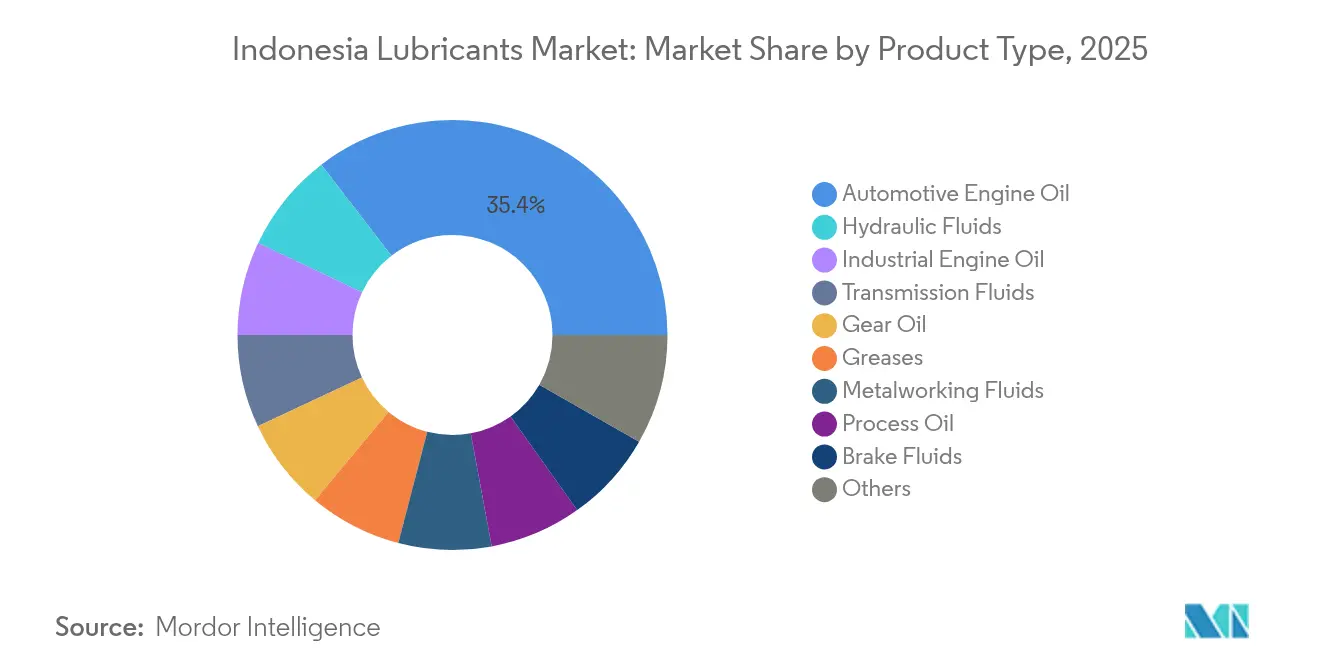
- By product type, automotive engine oil led with 35.80% revenue share in 2025; hydraulic fluids are forecast to expand at a 3.51% CAGR to 2031.
- By end-user industry, the automotive segment held a 57.40% share of the Indonesian lubricants market in 2025, while industrial applications were projected to have the highest CAGR of 3.20% through 2031.
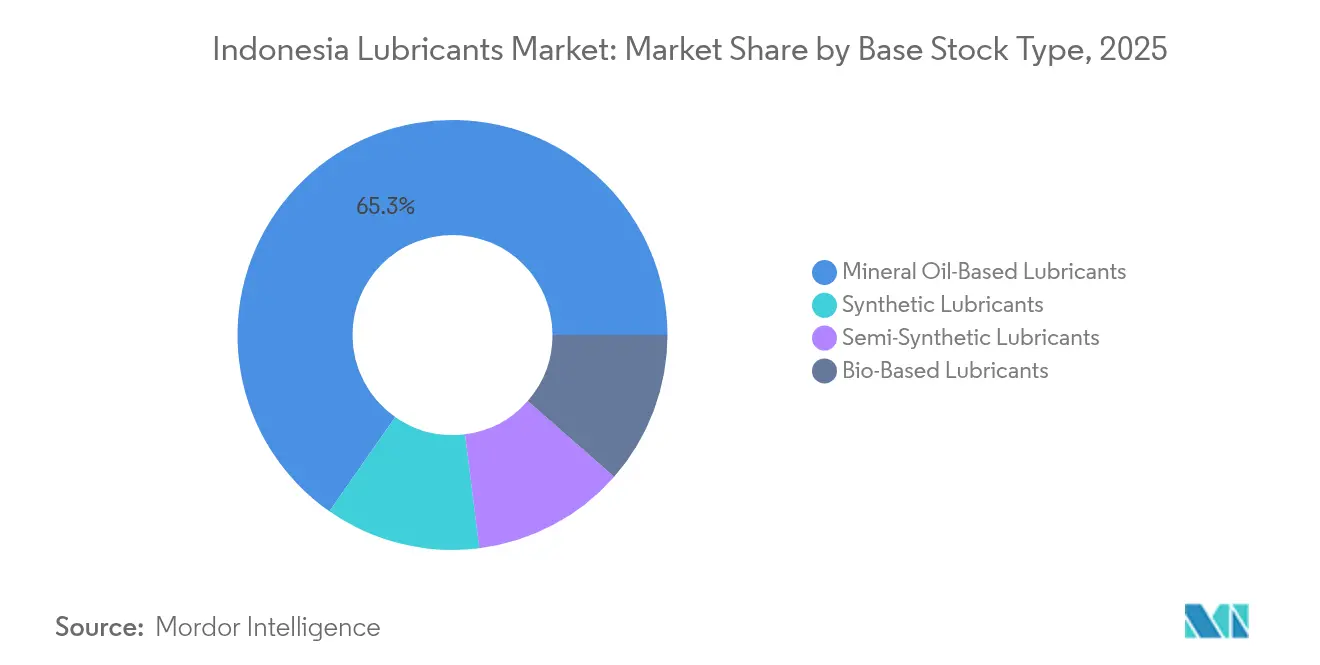
- By base stock type, mineral oil-based lubricants accounted for 65.30% share of the Indonesian lubricants market size in 2025, with synthetic lubricants advancing at a 3.88% CAGR through 2031.
Note: Market size and forecast figures in this report are generated using Mordor Intelligence’s proprietary estimation framework, updated with the latest available data and insights as of 2026.
Indonesia Lubricants Market Trends and Insights
Drivers Impact Analysis*
| Drivers | (~) % Impact on CAGR Forecast | Geographic Relevance | Impact Timeline |
|---|---|---|---|
| Growing automotive parc expansion | +0.8% | Java, Sumatra, Kalimantan | Medium term (2-4 years) |
| Rapid industrial and manufacturing growth | +0.7% | National, concentrated in Java and Kalimantan | Long term (≥ 4 years) |
| Nation-wide infrastructure and mining activity boom | +0.6% | Kalimantan, Sulawesi, Papua | Long term (≥ 4 years) |
| Marine and fisheries fleet modernization | +0.3% | Coastal regions, Java Sea, Makassar Strait | Medium term (2-4 years) |
| Biodiesel-linked lubricant contamination driving premium additives | +0.4% | National implementation | Short term (≤ 2 years) |
| Source: Mordor Intelligence | |||
Growing Automotive Parc Expansion
Indonesia's expanding automotive sector drives lubricant consumption through both passenger vehicle growth and commercial fleet modernization across the archipelago's logistics networks. According to the International Organization of Motor Vehicle Manufacturers (OICA), the country produced 1.19 million vehicles in 2024[1]The International Organization of Motor Vehicle Manufacturers, "Production Statistics," oica.net. The shift toward automatic transmission motorcycles creates demand for specialized lubricant formulations for matic applications. E-commerce expansion and the proliferation of last-mile delivery increase vehicle utilization rates, leading to a higher frequency of lubricant replacement beyond traditional consumer patterns. The government's push for electric vehicles and its planned phase-out of internal combustion engines by 2040 creates a structural ceiling for growth in automotive lubricant volumes. Regional distribution networks struggle to efficiently serve Indonesia's outer islands, creating supply bottlenecks that limit market penetration in emerging automotive clusters.
Rapid Industrial and Manufacturing Growth
Indonesia's manufacturing sector momentum directly translates to heightened industrial lubricant consumption across metalworking, power generation, and heavy equipment applications. The country's position as the world's largest nickel producer amplifies demand for specialized metalworking fluids and hydraulic systems lubricants in smelting operations. Manufacturing investment creates new industrial capacity requiring initial lubricant fills and ongoing maintenance programs. ExxonMobil's MACHINEXT on-site lubrication management technology, launched in June 2024, demonstrates how digital optimization reduces the total cost of ownership while extending equipment life cycles. The concentration of manufacturing on Java Island creates logistical advantages but limits growth potential in resource-rich outer regions where infrastructure development lags behind industrial investment.
Nation-wide Infrastructure and Mining Activity Boom
Indonesia's infrastructure surge, driven by government investment programs and foreign direct investment inflows, fuels demand for hydraulic fluid and heavy equipment lubricants across the construction and mining sectors. The country's nickel mining boom, crucial for global battery supply chains, necessitates specialized lubricants that can withstand extreme operating conditions and extended service intervals. Mining operations in Kalimantan and Sulawesi require high-performance hydraulic fluids and gear oils for their excavation equipment, which operates in 24/7 cycles. Power generation capacity expansion, including coal-fired and renewable energy projects, increases demand for turbine oils and transformer fluids across the archipelago. Environmental regulations and sustainability mandates are increasingly favoring bio-based and biodegradable lubricant formulations, challenging traditional mineral oil suppliers to reformulate their products while maintaining performance specifications.
Marine and Fisheries Fleet Modernization
Indonesia's maritime sector transformation, encompassing both commercial shipping and fisheries fleet upgrades, creates a specialized demand for lubricants in marine engine oils and hydraulic systems. The government's fleet modernization program targets hybrid propulsion systems and fuel-efficient engines, requiring lubricants compatible with alternative fuel blends and advanced emission control systems. Shipping route optimization through Indonesia's strategic waterways increases vessel traffic and maintenance requirements for marine lubricants. The country's position as a major seafood exporter drives the mechanization of its fishing fleet, replacing traditional vessels with modern boats that require synthetic marine oils and specialized gear lubricants. Climate change impacts on fishing patterns force fleet operators to extend operational ranges, increasing lubricant consumption per vessel while demanding products with superior thermal stability and corrosion resistance.
Restraints Impact Analysis*
| Restraints | (~) % Impact on CAGR Forecast | Geographic Relevance | Impact Timeline |
|---|---|---|---|
| Macroeconomic and commodity-price volatility dampening cap-utilization | -0.5% | National, export-dependent regions | Short term (≤ 2 years) |
| Longer drain-interval synthetic formulations lowering volume/vehicle | -0.4% | Urban centers, premium segments | Medium term (2-4 years) |
| Crude-oil price swings squeezing margins and price-sensitive buyers | -0.3% | National, import-dependent supply chains | Short term (≤ 2 years) |
| Source: Mordor Intelligence | |||
Macroeconomic and Commodity-Price Volatility Dampening Cap-Utilization
Indonesia's lubricant industry faces capacity utilization challenges due to macroeconomic uncertainty and fluctuations in commodity prices, which dampen industrial activity and consumer spending patterns. The domestic industry operates at approximately 60% capacity utilization. Global supply chain disruptions and currency volatility impact base oil import costs, forcing manufacturers to adjust their pricing strategies and consider the effect on demand elasticity. Export-dependent sectors, such as palm oil and mining, experience cyclical downturns that reduce industrial lubricant consumption during commodity price slumps. The concentration of manufacturing capacity on Java island creates regional imbalances, while outer island operations struggle with supply chain reliability during economic turbulence. Regulatory compliance costs under mandatory SNI standards add operational overhead that smaller players cannot easily absorb during periods of margin compression.
Longer Drain-Interval Synthetic Formulations Lowering Volume/Vehicle
Advanced synthetic lubricant formulations enable extended drain intervals, reducing per-vehicle consumption despite premium pricing advantages for manufacturers and distributors. PETRONAS demonstrated extended drain intervals of up to 1,500 hours in industrial applications, significantly reducing the frequency of lubricant replacement compared to conventional mineral oil products. The shift toward semi-synthetic and fully synthetic formulations, driven by OEM specifications and fuel economy regulations, creates a volume-value trade-off that challenges traditional business models. Urban consumers are increasingly adopting premium lubricants with extended service intervals, thereby reducing service frequency and the total size of the lubricants market per vehicle lifecycle in Indonesia. However, this trend primarily affects passenger vehicle segments, while commercial and industrial applications maintain shorter intervals due to severe operating conditions and equipment warranty requirements.
*Our forecasts treat driver/restraint impacts as directional, not additive. The impact forecasts reflect baseline growth, mix effects, and variable interactions.
Segment Analysis
By Product Type: Engine Oils Drive Volume Despite Hydraulic Growth
Automotive engine oil commands 35.80% Indonesia's lubricant market share in 2025, reflecting Indonesia's vehicle-centric lubricant consumption patterns and the dominance of internal combustion engines across passenger and commercial segments. Hydraulic fluids represent the fastest-growing product category, with a 3.51% CAGR for 2026-2031, driven by infrastructure construction and the expansion of mining equipment, which require high-performance hydraulic systems. Industrial engine oil serves power generation and marine applications, while transmission fluids benefit from the automatic transmission boom in the motorcycle industry. Gear oils support Indonesia's heavy equipment and industrial machinery base, particularly in mining operations across Kalimantan and Sulawesi.
Process oils, including rubber process oil and white oil, serve the tire manufacturing and petrochemical industries in Indonesia, while metalworking fluids support the country's expanding manufacturing sector. Turbine oils and transformer oils cater to the power generation infrastructure, while greases serve a diverse range of applications, from automotive chassis lubrication to industrial bearing systems. The evolution of the product mix toward specialized formulations reflects Indonesia's increasing industrial sophistication and the growing influence of OEM specifications, which demand performance lubricants that meet international standards, such as API, JASO, and ACEA certifications.



By End-user Industry: Automotive Dominance Faces Industrial Challenge
The automotive segment maintains a 57.40% share of Indonesia's lubricants market in 2025, encompassing passenger vehicles, commercial vehicles, and the country's massive two-wheeler population, which represents the world's third-largest motorcycle market. However, the Indonesian government has set a target to deploy 2 million electric cars and 12 million electric two-wheelers by 2030. As electric vehicles capture market share, demand for specific lubricants is expected to decline.
Industrial applications are expected to exhibit the fastest growth, at a 3.20% CAGR from 2026 to 2031, driven by manufacturing expansion, mining activities, and power generation investments. Marine applications benefit from Indonesia's strategic position in global shipping routes and the government's fisheries fleet modernization program, which targets hybrid propulsion systems. Aerospace lubricants serve Indonesia's growing aviation sector, while heavy equipment applications span construction, mining, and agricultural mechanization across the archipelago.
Within automotive applications, passenger vehicles face structural headwinds from the adoption of electric vehicles and government mandates phasing out internal combustion engines by 2040. Commercial vehicles and two-wheelers are expected to maintain stronger growth prospects due to the expansion of e-commerce and the proliferation of last-mile delivery, which increases vehicle utilization rates. Industrial end-users are increasingly demanding synthetic formulations and extended drain interval products, with ExxonMobil's MACHINEXT technology demonstrating how digital lubrication management reduces the total cost of ownership while extending equipment lifecycles. The industrial segment's geographic concentration in Java, Kalimantan, and Sulawesi creates distribution advantages while limiting growth potential in resource-rich outer regions.
By Base Stock Type: Mineral Oils Dominate While Synthetics Accelerate
Mineral oil-based lubricants hold 65.30% of the Indonesian lubricants market share in 2025, reflecting Indonesia's price-sensitive consumer base and the prevalence of conventional automotive and industrial applications across the archipelago. Synthetic lubricants are expected to achieve the fastest growth, with a 3.88% CAGR from 2026 to 2031, driven by OEM specifications, extended drain interval benefits, and industrial applications that demand superior performance under extreme conditions. Semi-synthetic lubricants bridge the price-performance gap, gaining traction in commercial vehicle and industrial segments where total cost of ownership considerations outweigh upfront pricing premiums. Bio-based lubricants remain a niche market but benefit from environmental regulations and sustainability mandates that affect marine and industrial applications.
The synthetic segment's growth trajectory aligns with Indonesia's increasing industrial sophistication and the adoption of advanced manufacturing technologies, which require high-performance lubricants. Shell's investment in graphene-enhanced lubricant research and Lubrizol's ILSAC GF-7 additive technology demonstrate the Indonesian lubricants industry's focus on innovation in synthetic formulations that deliver superior fuel economy and equipment protection. However, synthetic adoption faces barriers from import dependency for base stocks and additives, creating cost volatility that affects market penetration in price-sensitive segments. The mandatory B40 biodiesel implementation in 2025 is expected to increase demand for anti-corrosion additives and specialized formulations compatible with higher biofuel blends.
Geography Analysis
Indonesia's lubricant market exhibits strong regional concentration patterns, with the Java island dominating consumption due to its high manufacturing density and automotive concentration. Meanwhile, resource-rich outer islands like Kalimantan and Sulawesi drive industrial demand through mining and energy operations. Java's manufacturing sector creates the largest lubricant consumption base across automotive, industrial, and marine applications. The region benefits from established distribution networks and proximity to major ports, enabling efficient supply chain management and competitive pricing. However, market saturation in Java's urban centers limits growth potential, while infrastructure constraints in outer islands create supply bottlenecks that restrict Indonesia's lubricants market expansion despite strong underlying demand from mining and agricultural mechanization.
Kalimantan and Sulawesi represent high-growth regions driven by Indonesia's position as the world's largest nickel producer and expanding coal mining operations that require specialized industrial lubricants for heavy equipment and processing facilities. The geographic distribution challenges across Indonesia's 17,000 islands create logistical complexities that favor integrated suppliers with comprehensive distribution networks. Sumatra's palm oil industry and refining capacity provide both demand for industrial lubricants and potential supply chain advantages for bio-based formulations, while Papua's emerging mining sector represents untapped growth potential, albeit with infrastructure limitations.
The government's policy emphasis on developing industrial capacity outside Java creates opportunities for lubricant suppliers willing to invest in regional distribution networks and local partnerships. Pertamina's dominance in fuel distribution, controlling 85% of fuel stations nationwide, provides strategic advantages for lubricant market access across remote regions where independent distributors struggle with supply chain economics. However, the concentration of lubricant manufacturing capacity on Java island creates regional price disparities and supply reliability challenges during peak demand periods or logistical disruptions affecting inter-island transportation networks.
Regulatory Landscape
Indonesia requires Indonesian National Standard (SNI) compliance for lubricating oil products sold domestically, covering both local production and imports. Ministry of Industry Regulation No. 8/2025 mandates SNI for vehicle lubricating oils, replacing the earlier framework under MoI Reg 25/2018, which makes conformity assessment a gating factor for market access and increases compliance costs for smaller importers and blenders.
Certification follows a Type 5 scheme covering production and quality management audits (including ISO 9001:2015), along with product testing. Applicants register through the SIINas electronic platform to obtain SPPT SNI approval for use of the SNI mark. In parallel, lubricant-sector businesses also need PB UMKU licensing via the OSS system, while ESDM policy updates in 2026, including Ministerial Decree 113.K/EK.05/MEM.E/2026 on biofuel blending phasing, raise the bar for formulation and additive compatibility alongside quality enforcement.
Value Chain Analysis
The value chain begins with base stocks and additives. Indonesia relies materially on imported Group II and Group III base oils, followed by blending, packaging, and quality testing to meet mandatory SNI requirements before products move into multi-channel distribution. Larger suppliers tend to run integrated blending and filling in-country, while smaller players rely more on toll blending and third-party logistics, with conformity testing and certification (including through authorized bodies such as BBLM as an LSPro for mandatory SNI lubricants) influencing time-to-market and working-capital cycles.
Distribution is anchored in hub-and-spoke networks centered on Java. Regional distribution centers support industrial and mining demand in outer islands such as Kalimantan and Sulawesi. Pertamina's retail footprint (about 85% of fuel stations nationwide) remains a route-to-market advantage for lubricants, while localization and capacity moves such as Pertamina Lubricants Mini LOBP commissioning in Jakarta and Shell's grease plant plan at the Marunda LOBP complex point to efforts to reduce inter-island service gaps and improve responsiveness for fleet and industrial customers.
Competitive Landscape
The market is moderately fragmented. Niche contenders, including FUCHS, TotalEnergies, and Idemitsu, focus on synthetic motorcycle oils and factory-fill deals with Japanese OEMs. Domestic independents such as PT Wirahadiraksa exploit import arbitrage to offer value-priced monogrades in rural Java and Nusa Tenggara, but face branding challenges. Regulation continues to shape rivalry: Ministry of Industry Decree No. 8/2025 enforces SNI standards on lubricants, compelling smaller importers to invest in conformity assessments or exit.
Indonesia Lubricants Industry Leaders
-
PT Pertamina Lubricants
-
Shell plc
-
BP Plc (Castrol)
-
Exxon Mobil Corporation
-
Chevron Corporation
- *Disclaimer: Major Players sorted in no particular order

Market Opportunities and Future Outlook
Mandatory SNI under MoI Regulation No. 8/2025 is tightening quality enforcement and raising the commercial value of certified, consistent products, which creates room for brands that can support customers with documentation, testing, and traceable supply. This compliance-led shift is also showing up alongside industrial demand for higher-performance formulations in mining, manufacturing, and power generation, where lubricant management programs and extended-drain products compete on uptime and total cost of ownership rather than only price.
Archipelago logistics and regional supply reliability can differentiate suppliers, and the investment pattern suggests opportunity in localized and flexible production. Pertamina Lubricants commissioning a Mini LOBP in Jakarta (6,336 KL/year) and reported capacity strengthening at its Gresik unit (120,000 KL/year) highlight efforts to improve availability and shorten replenishment cycles, while Lubrizol's South Jakarta office and its MoU with Pertamina Lubricants indicate expanding technical support for formulators working on biofuel-compatibility needs and premium additive packages as Indonesia progresses to higher biodiesel blends.
Recent Industry Developments
- June 2026: Shell Indonesia confirmed capital investment to expand its lubricant factory in Marunda, with a stated target capacity of 300 million liters per year. The added local manufacturing scale can improve lead times and product availability for automotive and industrial channels concentrated around Java and nearby ports.
- December 2025: BP Plc agreed to sell a 65% stake in Castrol to Stonepeak for USD 6 billion. The ownership change could affect Castrol's capital allocation and go-to-market priorities in Indonesia, where brand strength and channel coverage are key competitive levers.
- March 2024: Shell announced plans to build a grease manufacturing plant at its existing Marunda LOBP complex in Bekasi, targeting 12 kilotonnes of annual capacity. Local grease production can support industrial and heavy-equipment demand and reduce reliance on imported specialty products in a market where inter-island logistics add cost and complexity.


Research Methodology Framework and Report Scope
Market Definition and Coverage
For this study, the Indonesia lubricants market covers finished lubricants consumed within Indonesia across automotive and industrial use, measured through demand volumes sold into end users through OEM and aftermarket routes.
Scope exclusions: This sizing excludes base oils and additives traded as raw materials, along with fuels and chemical additives that are not used primarily for lubrication.
Segmentation Overview
-
By Product Type
- Automotive Engine Oil
- Industrial Engine Oil
- Transmission Fluids
- Gear Oil
- Brake Fluids
- Hydraulic Fluids
- Greases
- Process Oil (Including Rubber Process Oil and White Oil)
- Metalworking Fluids
- Turbine Oil
- Transformer Oil
- Other Product Types
-
By End-user Industry
-
Automotive
- Passenger Vehicles
- Commercial Vehicles
- Two-Wheelers
- Marine
- Aerospace
-
Heavy Equipment
- Construction
- Mining
- Agriculture
-
Industrial
- Power Generation
- Metallurgy and Metalworking
- Textiles
- Oil and Gas
- Other End-Use Industries
-
Automotive
-
By Base Stock Type
- Mineral Oil-Based Lubricants
- Synthetic Lubricants
- Semi-Synthetic Lubricants
- Bio-Based Lubricants
Data Sources, Market Sizing, and Validation
Desk Research
Our desk work starts by locking the demand boundaries and the right unit of measure, since lubricants are often tracked in liters before value is later inferred. We relied on public and official sources such as Statistics Indonesia (BPS), the Ministry of Energy and Mineral Resources, Bank Indonesia (exchange rates and inflation), and the Directorate General of Customs and Excise for trade signals tied to base stocks and finished lubricant movements.
To connect the macro view to real consumption, we also reviewed technical and industry sources such as SAE and API publications on lubricant grades and change intervals, along with company annual reports, investor presentations, association websites, and reputed press releases on plant capacity, blending activity, and channel expansion. Where needed, we referenced paid subscriptions for company financials and intelligence, patent databases, and shipment-level import and export records to check consistency in volumes and product mix. These sources are illustrative and not exhaustive, and many other materials were also consulted for data collection, validation, and research clarification.
Primary Interviews and Surveys
Primary work was used to pressure-test consumption drivers that are hard to read from public data alone, such as drain intervals, product mix shifts, and channel margins that affect realized pricing. We spoke with participants across blending, distribution, workshops, fleet and industrial maintenance teams, and sector specialists so assumptions could be corrected across automotive, industrial, and marine demand pockets within Indonesia.
Distribution of primary research fieldwork respondents
| Company type | Respondent position |
|---|---|
| Top tier: 29% | CXOs: 20% |
| Mid tier: 50% | Functional/Unit leaders: 24% |
| Smaller Players: 21% | Managers: 56% |
Market-Sizing & Forecasting
Sizing was built using a top-down and bottom-up model mix, where the national lubricant demand pool is reconstructed from vehicle parc and utilization indicators, industrial activity proxies, and observed replacement cycles, and then converted into annual liters by applying typical fill sizes and drain intervals by equipment type. To keep the totals realistic, selective bottom-up checks were added through channel discussions, sampled price by volume mixes, and consistency checks against blending capacity signals and visible import patterns.
Key inputs that shaped the model included two-wheeler and passenger car population and usage, commercial vehicle and off-highway activity, manufacturing and mining output trends, the split between OEM and aftermarket, and the share movement across mineral, semi-synthetic, and synthetic formulations. For forecasting, we used scenario analysis because short-term demand moves with transport intensity and industrial cycles, while product mix and drain interval changes tend to shift more gradually. When bottom-up information was incomplete for smaller channels, gaps were handled by applying conservative penetration ranges that were reviewed again with interview feedback before finalizing the series.
Data Validation & Update Cycle
Validation was done by comparing modeled totals against independent signals such as vehicle sales and parc direction, industrial production momentum, and visible shifts in lubricant grades and packaging mix. Outliers were flagged and reviewed in steps, first through internal checks on unit conversions and assumptions, and then through targeted re-contacts with field respondents when a variance looked structural.
The report is refreshed annually, and interim adjustments are made when material events occur, such as sharp exchange rate moves, major policy changes, or notable shifts in industrial output. Before delivery, an analyst performs a fresh pass so clients receive the latest updated view, and then the final outputs are signed off after variance checks are closed.
Mordor Intelligence's Indonesia Lubricants Market Market Sizing Compared With Other Published Estimates
Published market sizes for Indonesia lubricants can vary widely because some sources present value while others present volume, and the conversion depends on the price mix assumed for automotive versus industrial grades. Differences also come from the chosen base year, currency timing, and whether the estimate reflects retail price, ex-tax wholesale price, or an implied average.
In a refresh-led workflow, the biggest swings usually show up when exchange rates and inflation are updated, and when average selling price is recalculated from the latest synthetic penetration and packaging mix and then checked against current channel feedback and trade signals, which is where Mordor Intelligence keeps the timing and ASP inputs consistent year to year.
Benchmark comparison
| Source | Market Size | Gaps in Research Methodology |
|---|---|---|
| Mordor Intelligence | USD 1.20 B (2025) | |
| Industry Exhibition Portal A | USD 2.45 B (2024) | Reported in value terms without a clear price basis, so it may reflect a retail-level view and a broader product mix, which makes a direct comparison against a volume-led series difficult. |
| Regional Consultancy B | USD 3.10 B (2025) | Uses a value build that likely assumes higher blended ASPs and faster mix shift toward premium grades, and it is not transparent on currency timing and tax inclusion choices. |
The spread in the table is mainly explained by unit choice and pricing assumptions, not by a sudden change in physical lubricant demand. By keeping the sizing traceable to liters first and then stress-testing the implied pricing with current-year checks, the final estimate stays easier to audit and repeat when conditions change.


Key Questions Answered in the Report
What is driving growth in Indonesia's lubricants industry?
Indonesia's lubricants industry growth is primarily driven by the expansion of the automotive parc, rapid industrial and manufacturing growth, nationwide infrastructure development, and a boom in mining activity, particularly in nickel production. The B40 biodiesel implementation in 2025 is also creating demand for specialized lubricant formulations with enhanced anti-corrosion additives.
How big is the Indonesian lubricants market?
The Indonesian lubricants market reached 1.23 billion liters in 2026 and is projected to expand to 1.41 billion liters by 2031, growing at a 2.71% CAGR. The automotive segment holds 57.40% market share, while mineral oil-based lubricants account for 65.30% of the total volume.
Which lubricant segments are growing fastest in Indonesia?
Synthetic lubricants are growing fastest at 3.88% CAGR (2026-2031), followed by hydraulic fluids at 3.51% CAGR, and industrial applications at 3.20% CAGR. These growth rates reflect Indonesia's industrial expansion, infrastructure development, and the shift toward premium formulations with extended drain intervals.
How will Indonesia's B40 biodiesel mandate affect lubricant formulations?
Indonesia's B40 biodiesel mandate (40% palm oil blend) scheduled for 2025 will require specialized lubricant formulations with enhanced anti-corrosion additives to protect fuel systems from increased corrosion risks. This creates both challenges for traditional mineral oil products and opportunities for advanced synthetic formulations designed specifically for biofuel compatibility.
What challenges face Indonesia's lubricants distribution network?
Indonesia's archipelagic geography with 17,000 islands creates significant distribution challenges, particularly for reaching remote mining and agricultural operations. This favors integrated suppliers with comprehensive networks, while creating supply bottlenecks and price disparities between Java (the manufacturing center) and outer islands where infrastructure development lags behind industrial investment.
What is the current market size of Indonesia Lubricants Market?
The Indonesian Lubricants Market size is estimated at 1.23 billion liters in 2026, and is expected to reach 1.41 billion liters by 2031, at a CAGR of 2.71% during the forecast period (2026-2031).
Page last updated on:


 Your data is secure and never sold or shared.


