Market Overview
| Study Period | 2019 - 2030 |
| Base Year For Estimation | 2024 |
| Forecast Data Period | 2025 - 2030 |
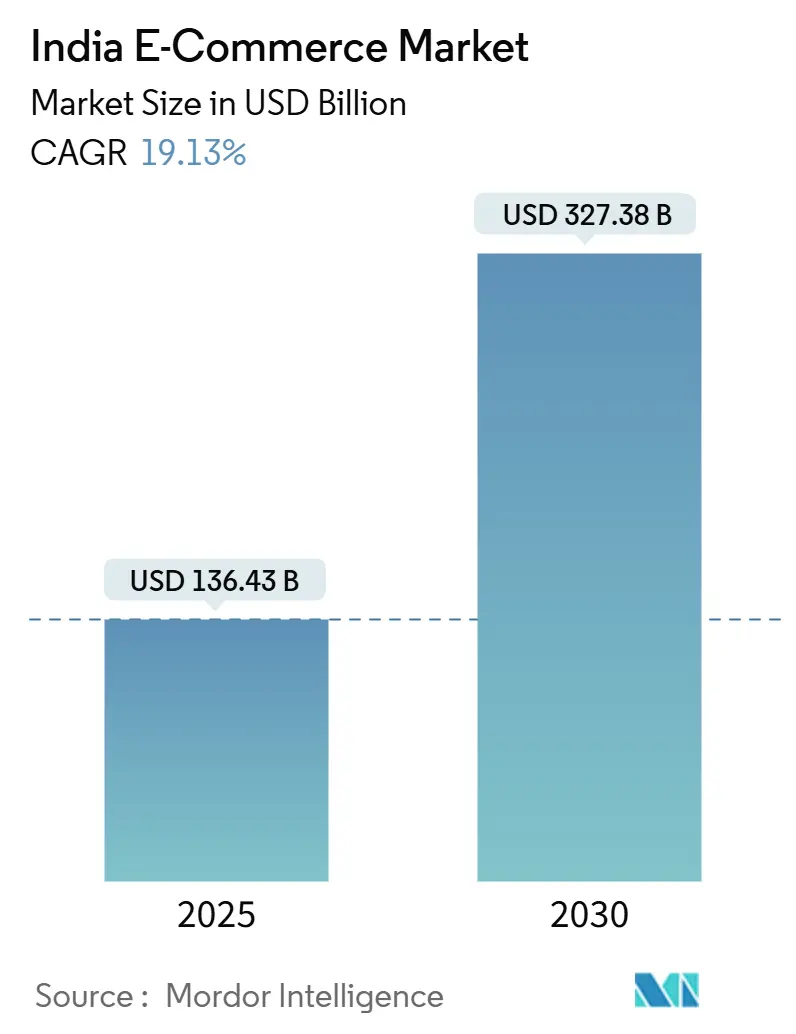
| Market Size (2025) | USD 136.43 Billion |
| Market Size (2030) | USD 327.38 Billion |
| Growth Rate (2025 - 2030) | 19.13% CAGR |
| Market Concentration | Medium |
Major Players*Disclaimer: Major Players sorted in no particular order Image © Mordor Intelligence. Reuse requires attribution under CC BY 4.0. |
|
India E-Commerce Market Analysis by Mordor Intelligence
The India e-commerce market stands at USD 136.43 billion in 2025 and is forecast to reach USD 327.38 billion in 2030, advancing at a 19.13% CAGR. The current growth momentum is anchored in ubiquitous mobile connectivity, maturing digital payments infrastructure and supportive policy measures that jointly expand online retail beyond metropolitan corridors into lower-tier cities. [1]Indian Brand Equity Foundation, “E-Commerce,” ibef.org Consumers in tier-2 and tier-3 urban centres already account for 60% of new online shoppers, signalling a structural rebalancing of demand away from traditional retail hubs. Unified Payments Interface (UPI) transactions surpassed 208 billion in FY 2024, lowering transaction frictions and embedding real-time payments deep inside the India e-commerce market. Quick-commerce, live-stream shopping and the ongoing direct-to-consumer (D2C) funding wave diversify fulfilment models and sustain shopper engagement, while macro programmes such as Digital India target a USD 1 trillion digital economy that will funnel additional traffic into the India e-commerce market.
Key Report Takeaways
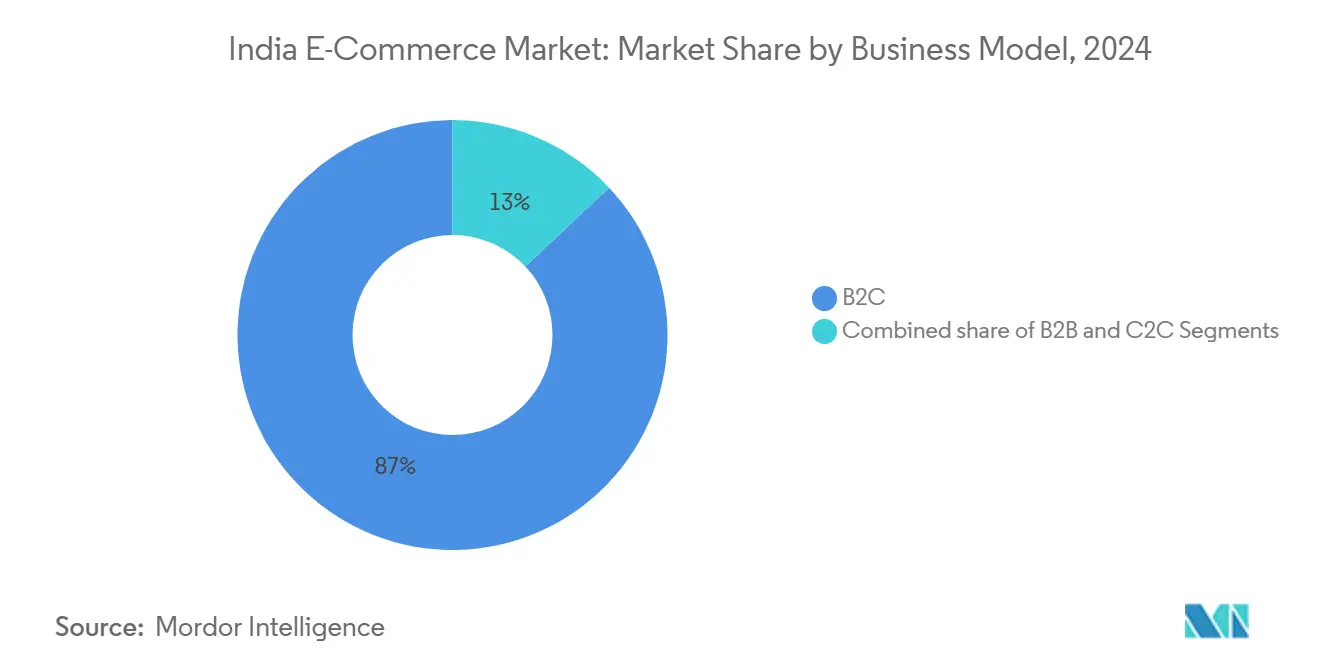
- By business model, B2C platforms led with 87.02% revenue share in 2024; C2C transactions are projected to scale at a 24.82% CAGR through 2030.
- By device type, smartphones accounted for 78.06% of the India e-commerce market share in 2024, whereas emerging device categories are expanding at a 26.53% CAGR.
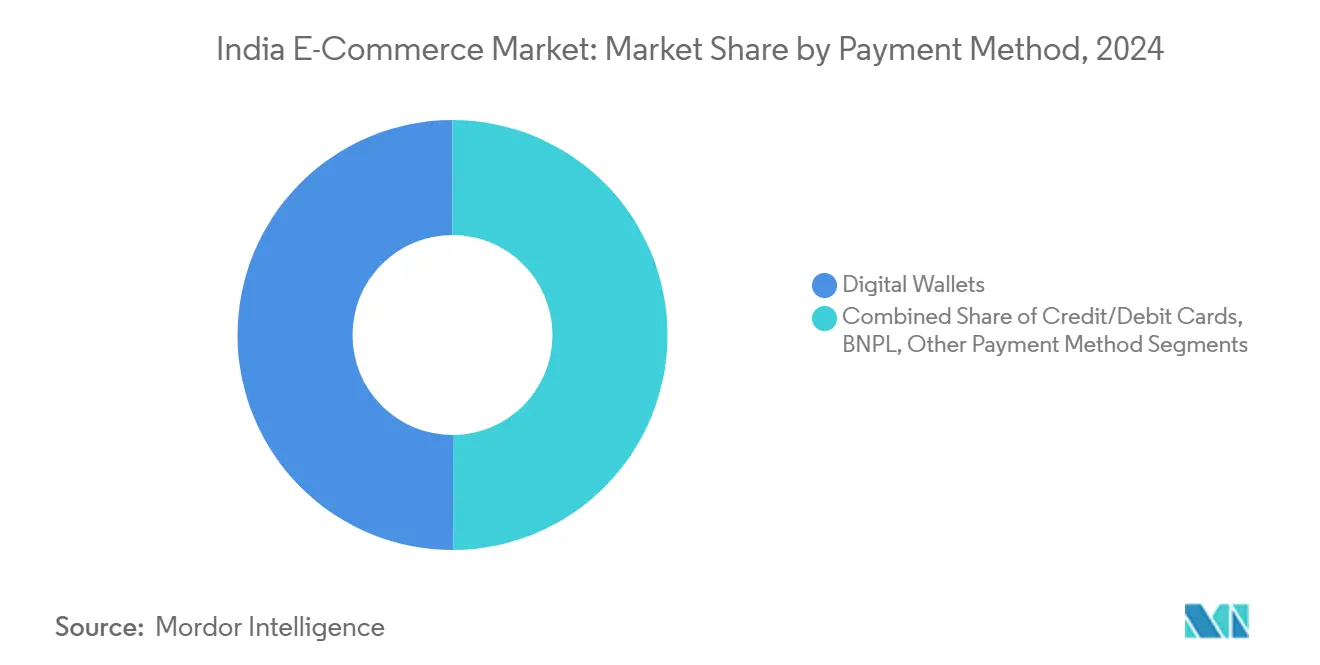
- By payment method, digital wallets and UPI held 50.06% revenue share in 2024, while BNPL is set to advance at 22.71% CAGR to 2030.
- By B2C product category, fashion & apparel captured 32.23% revenue in 2024 and food & beverages is anticipated to post a 23.38% CAGR over the forecast window.
India E-Commerce Market Trends and Insights
Drivers Impact Analysis
| Driver | (~) % Impact on CAGR Forecast | Geographic Relevance | Impact Timeline |
|---|---|---|---|
| Rising UPI & Instant Payment Adoption in Tier-II/III Cities | +3.2% | Tier-2 and Tier-3 cities, with spillover to rural areas | Medium term (2-4 years) |
| Low-Cost Data Plans Driving Video-led Buying Journeys | +2.8% | National, with higher impact in non-metro regions | Short term (≤ 2 years) |
| Direct-to-Consumer Brand Boom Fuelled by Domestic VC Funding | +2.1% | Metro cities expanding to Tier-2 markets | Medium term (2-4 years) |
| Quick-Commerce Penetration in Top-20 Cities | +1.9% | Top-20 metropolitan areas | Short term (≤ 2 years) |
| Social-Commerce Influencer Ecosystem Monetisation | +1.5% | National, with concentration in urban centers | Long term (≥ 4 years) |
Source: Mordor Intelligence
Rising UPI & Instant Payment Adoption in Tier-II/III Cities Drives the Market
Real-time payments have reset online purchase behaviour in non-metropolitan India, where digital transactions now comprise 65% of orders, materially shrinking cash-on-delivery reliance. UPI’s integration with Aadhaar authentication lowers onboarding friction for the unbanked and extends the India e-commerce market’s addressable base by a projected 150-200 million shoppers. Credit-on-UPI functionality further embeds financial flexibility directly within checkout flows, trimming platform working-capital cycles and encouraging basket expansion. Smartphones exceeding 400 million and data tariffs below USD 1 per GB underpin adoption, resulting in non-metro digital payment uptake that is four to five times faster than in tier-1 cities. Platform monetisation widens through value-added remittances and micro-lending, sustaining positive feedback loops that reinforce digital commerce penetration.
Low-Cost Data Plans Driving Video-Led Buying Journeys
At USD 0.68 per GB, India’s mobile data pricing catalyses high-engagement video content that now drives up to 4 times more interaction than static imagery on leading platforms.[2]Pine Labs Research Team, “The Video Commerce Playbook,” pinelabs.com Conversion lifts of 25-30% arise when live demos replace traditional catalogues, while nationwide 5G rollout across more than 200 cities by 2025 will enable latency-free augmented reality and seamless live-stream shopping. Social-commerce leaders report that video listings contribute over 40% of gross merchandise value, and live commerce across fashion, beauty and home categories is sized as a USD 16-20 billion near-term opportunity. The structural shift towards video-centric discovery differentiates sellers and elevates the India e-commerce market’s content-commerce flywheel.
Direct-to-Consumer Brand Boom Fuelled by Domestic VC Funding
More than USD 5 billion has flowed into India’s D2C brands across 520 deals since 2021, granting founders resources to bypass legacy distribution layers and preserve 50-55% gross margins. Unicorns such as Lenskart and The Good Glamm Group illustrate scalable playbooks that emphasise data-driven assortment and owned customer relationships. Yet, profitability remains elusive for the majority; only 24 of 177 tracked brands posted positive bottom lines in FY 2023. Quick-commerce tie-ups accelerate reach, delivering 4-5 times faster sell-through than conventional e-commerce channels. As domestic funds replace cautious global investors, sustained capital availability supports ongoing innovation that widens the India e-commerce market’s competitive set.
Quick-Commerce Penetration in Top-20 Cities Drives the Market
Quick-commerce platforms are on track to surpass USD 6 billion in GMV by FY 2025, growing 75-85% annually. Delivery promises under 30 minutes reset consumer expectations and lift average order values to INR 635 (USD 7.6) as assortments expand beyond groceries. More than 1,500 micro-fulfilment dark stores operate within 3 km catchments across India’s top-20 cities. Traditional e-commerce incumbents have responded with accelerated grocery roll-outs and experimental rapid-delivery pilots, reinforcing the India e-commerce market’s pivot towards immediacy.
Restraints Impact Analysis
| Restraint | (~) % Impact on CAGR Forecast | Geographic Relevance | Impact Timeline |
|---|---|---|---|
| Inconsistent Interstate Logistics & Reverse-Logistics Costs | -2.4% | National, with higher impact on cross-state operations | Medium term (2-4 years) |
| Compliance Burden from E-Commerce Rules Draft 2023 | -1.8% | National, affecting all e-commerce entities | Long term (≥ 4 years) |
| High Customer Acquisition Cost Outside Metros | -1.6% | Tier-2, Tier-3 cities and rural areas | Medium term (2-4 years) |
| Data-Privacy Concerns Limiting Hyper-Personalisation | -1.2% | National, with higher impact on data-intensive platforms | Long term (≥ 4 years) |
Source: Mordor Intelligence
Inconsistent Interstate Logistics & Reverse-Logistics Costs Hinder the Market
Logistics outlays consume 13-14% of India’s GDP, versus 8-10% in developed economies, eroding margins across the India e-commerce market. State-specific regulations, e-way bills and variable documentation hamper cross-border flows, while return rates of 20-30% in fashion push reverse-logistics costs higher. GST harmonisation mitigates some friction yet does not address fragmented infrastructure. Government programmes such as the Unified Logistics Interface Platform promise 5-7 percentage-point cost relief by 2030, but staggered implementation keeps near-term pressure elevated. Smaller sellers without negotiated carrier rates remain disproportionately exposed, limiting ecosystem inclusivity.
Compliance Burden from E-Commerce Rules Draft 2023 Restrains the Market
The Digital Personal Data Protection Act requires significant data governance investments, including India-based protection officers and mandatory breach reporting within 72 hours.[3]Staff Reporter, “Data Protection Act Compliance Costs,” business-standard.com Significant Data Fiduciaries must hold consumer data for three years, adding storage overheads, while penalties up to INR 250 crore (USD 30 million) create downside risk that fosters defensive product roadmaps. Cross-border platforms must localise data processing, compelling incremental capex in domestic data centres. Compliance spend weighs heavily on small and medium enterprises, potentially consolidating the India e-commerce market around capital-rich incumbents.
Segment Analysis
By Business Model: C2C Acceleration Challenges B2C Dominance
B2C platforms commanded 87.02% of 2024 revenue, underpinned by entrenched logistics networks, loyalty programmes and extensive seller ecosystems that anchor the India e-commerce market. Simultaneously, the C2C segment is forecast to grow at 24.82% CAGR through 2030, propelled by peer-to-peer resale, localised craft marketplaces and social-commerce storefronts that lower entry barriers for informal entrepreneurs. Open Network for Digital Commerce (ONDC) protocols target open interoperability, promising to dilute platform gatekeeping and magnify C2C participation.
C2C models operate with asset-light inventory and modest customer acquisition spend, enabling faster regional scaling in pre-owned electronics, fashion recommerce and hyperlocal services. B2C incumbents counter by reducing seller fees, adding creator-friendly toolkits and embedding social discovery features to retain merchant stickiness. The India e-commerce market size for B2B procurement is also poised to hit USD 60 billion by 2027, presenting further competitive overlap as enterprises digitise supply chains and converge on shared infrastructure.
Note: Segment shares of all individual segments available upon report purchase
By Device Type: Mobile Supremacy Faces Emerging Channel Disruption
Smartphones generated 78.06% of 2024 transactions, confirming mobile as the principal gateway into the India e-commerce market. Desktops retain relevance for high-ticket electronics and B2B research yet their share is structurally capped by ubiquitous handheld access. Voice-assisted reordering through smart speakers now appears on grocery and household staples checkouts, signalling an impending shift to ambient commerce.
AR-enabled try-ons cut fashion and beauty return rates by 40%, while 5G connectivity allows high-definition product demos in real time. Smart-TV integration brings one-click purchasing during entertainment streaming, especially for large appliances. Wearables and IoT sensors extend contextual commerce, where replenishment triggers auto-purchase before stock-outs. These nascent channels, growing at 26.53% CAGR, diversify customer touchpoints and distribute India e-commerce market exposure across everyday devices.
By Payment Method: BNPL Disrupts Digital Wallet Leadership
Digital wallets and UPI together maintained a 50.06% revenue share in 2024 thanks to zero MDR charges and instant settlement. Nevertheless, BNPL’s 22.71% CAGR reflects millennials’ preference for short-tenure credit aligned with irregular income flows. Embedded BNPL on UPI rails removes app switching, shrinking checkout abandonment and enlarging the India e-commerce market size tied to deferred-payment orders.
Card volume growth plateaus as younger cohorts bypass plastic and older cohorts adopt wallet-linked virtual cards. Amazon’s acquisition of BNPL lender Axio underlines strategic intent to internalise credit underwriting and data advantages. Crypto and central-bank digital currency pilots remain small in volume but symbolise long-term competition for wallet primacy once regulatory clarity emerges.
Note: Segment shares of all individual segments available upon report purchase
By B2C Product Category: Food & Beverages Surge Challenges Fashion Dominance
Fashion & apparel retained a 32.23% revenue lead in 2024 on the back of deep supplier bases and lifestyle branding. However, food & beverages is on track for a 23.38% CAGR through 2030, buoyed by quick-commerce baskets that fulfil impulse needs in under 30 minutes. The India e-commerce market size for groceries and packaged foods is set to expand further as urban dual-income households prioritise convenience over bulk savings.
Beauty & personal care sustains double-digit online growth driven by ingredient-led discovery and influencer tutorials. Consumer electronics face margin compression from direct-import competition but premium smartphones and wearables leverage EMI finance to offset price barriers. Furniture & home furnishings benefit from AR-visualised room layouts that address tactile hesitations and cut cart abandonment. Premiumisation across categories signals higher willingness to pay for sustainability, provenance and speed as disposable incomes rise.
Geography Analysis
Metropolitan clusters such as Mumbai, Delhi, Bengaluru and Chennai still register the highest per-capita digital spending, yet 60% of incremental shoppers now emerge from tier-2 and tier-3 cities that benefit from improved broadband and smartphone affordability. These markets display heightened price sensitivity and extended consideration windows but reward trusted sellers with stronger lifetime value, reinforcing the India e-commerce market’s pivot toward distributed demand. Hyperlocal fulfilment hubs slash delivery times to under 48 hours in many emerging cities, amplifying repeat purchase frequency.
Language localisation becomes a decisive differentiator as non-English content unlocks new customer cohorts; platforms invest in regional language interfaces and vernacular customer support at scale. Cross-border trade via dedicated e-commerce export zones positions India as a potential USD 200-300 billion outbound commerce hub by 2030. Rural penetration remains embryonic, constrained by patchy connectivity and cash dominance, yet government digital literacy drives and logistics corridors under PM GatiShakti aim to reduce the last-mile cost curve and extend the India e-commerce market into villages.
Competitive Landscape
The India e-commerce market is moderately concentrated: Amazon, Walmart-owned Flipkart and Reliance Retail anchor share leadership, but vertical specialists, quick-commerce disruptors and thousands of D2C brands continuously fragment the addressable pie. Category-focused players such as Nykaa (beauty), Myntra (fashion) and BigBasket (grocery) exhibit superior engagement economics by aligning fulfilment models with category-specific consumer expectations. AI-driven personalisation engines, AR try-ons and voice commerce pilots illustrate technology’s role as the primary differentiator in acquisition and retention.
Capital requirements remain steep; Amazon pledged USD 15 billion of fresh India investment and Flipkart raised USD 1 billion in 2024 to fund last-mile infrastructure and fintech integration. Algorithmic assortment optimisation down to the PIN-code level, as evidenced by Amazon’s recent variety-optimisation patent, pushes hyper-local relevance that can outflank regional specialists. White-space opportunities persist in B2B trade, rural fulfilment and cross-border facilitation, domains where the incumbent platforms’ presence is still nascent.
India E-Commerce Industry Leaders
-
Amazon.com, Inc.
-
eBay, Inc.
-
Flipkart Internet Pvt. Ltd.
-
Alibaba Group (AliExpress)
-
Nykaa E-Retail Pvt. Ltd.
- *Disclaimer: Major Players sorted in no particular order
Need More Details on Market Players and Competitors?
Download PDF
Recent Industry Developments
- June 2025: Flipkart divested its 6% stake in Aditya Birla Fashion and Retail for USD 67.68 million, freeing capital for core e-commerce investments.
- April 2025: Amazon-backed More Retail announced plans for an India IPO in 2026, signalling confidence in its hybrid omnichannel strategy that melds physical stores with e-commerce.
- March 2025: Amazon expanded its grocery service to over 170 Indian cities, intensifying competition with BigBasket and quick-commerce specialists in the high-frequency fresh segment.
- January 2025: Amazon agreed to acquire Indian BNPL startup Axio for more than USD 150 million, embedding credit natively into its checkout flow to reinforce stickiness among price-sensitive cohorts.
India E-Commerce Market Report Scope
E-commerce is the buying and selling of goods and services over the Internet through online shopping. However, this term is often used to describe all the seller's efforts in selling products directly to consumers. It begins when potential customers learn about a product, buy it, use it, and ideally maintain lasting customer loyalty.
The Indian e-commerce market is segmented into B2C E-commerce (beauty and personal care, consumer electronics, fashion and apparel, food and beverage, furniture, and home) and B2B E-commerce. The report's scope includes market size and forecasting for B2B and B2C segments, with the B2C channel being further split by application. The market sizes and forecasts are provided in terms of value (USD) for all the above segments.
| By Business Model | B2C |
| B2B | |
| C2C | |
| By Device Type | Smartphone / Mobile |
| Desktop and Laptop | |
| Other Device Types | |
| By Payment Method | Credit / Debit Cards |
| Digital Wallets | |
| BNPL | |
| Other Payment Method | |
| By B2C Product Category | Beauty and Personal Care |
| Consumer Electronics | |
| Fashion and Apparel | |
| Food and Beverages | |
| Furniture and Home | |
| Toys, DIY and Media | |
| Other Product Categories |
By Business Model
| B2C |
| B2B |
| C2C |
By Device Type
| Smartphone / Mobile |
| Desktop and Laptop |
| Other Device Types |
By Payment Method
| Credit / Debit Cards |
| Digital Wallets |
| BNPL |
| Other Payment Method |
By B2C Product Category
| Beauty and Personal Care |
| Consumer Electronics |
| Fashion and Apparel |
| Food and Beverages |
| Furniture and Home |
| Toys, DIY and Media |
| Other Product Categories |
Need A Different Region or Segment?
Customize Now
Key Questions Answered in the Report
What is the current value of the India e-commerce market?
The market stands at USD 136.43 billion in 2025 and is set to grow rapidly at a 19.13% CAGR toward 2030.
Which business model leads online retail in India?
B2C platforms dominate with 87.02% revenue share, although C2C transactions are scaling quickly with a 24.82% forecast CAGR.
How important are smartphones in Indian online shopping?
Smartphones drive 78.06% of all transactions, making mobile the main purchase channel nationwide.
What role does BNPL play in the India e-commerce market?
Buy-now-pay-later payments are the fastest-growing method at 22.71% CAGR, reshaping checkout preferences among younger consumers.
Which product categories are expanding fastest online?
Food & beverages lead with a 23.38% projected CAGR, while fashion & apparel remains the largest revenue contributor.
How is regulation affecting e-commerce players?
The Digital Personal Data Protection Act 2023 raises compliance costs and could consolidate market share among capital-rich platforms due to stricter data governance requirements.
Page last updated on: June 30, 2025

