
Market Overview
| Study Period | 2020 - 2031 |
|---|---|
| Forecast Data Period | 2026 - 2031 |
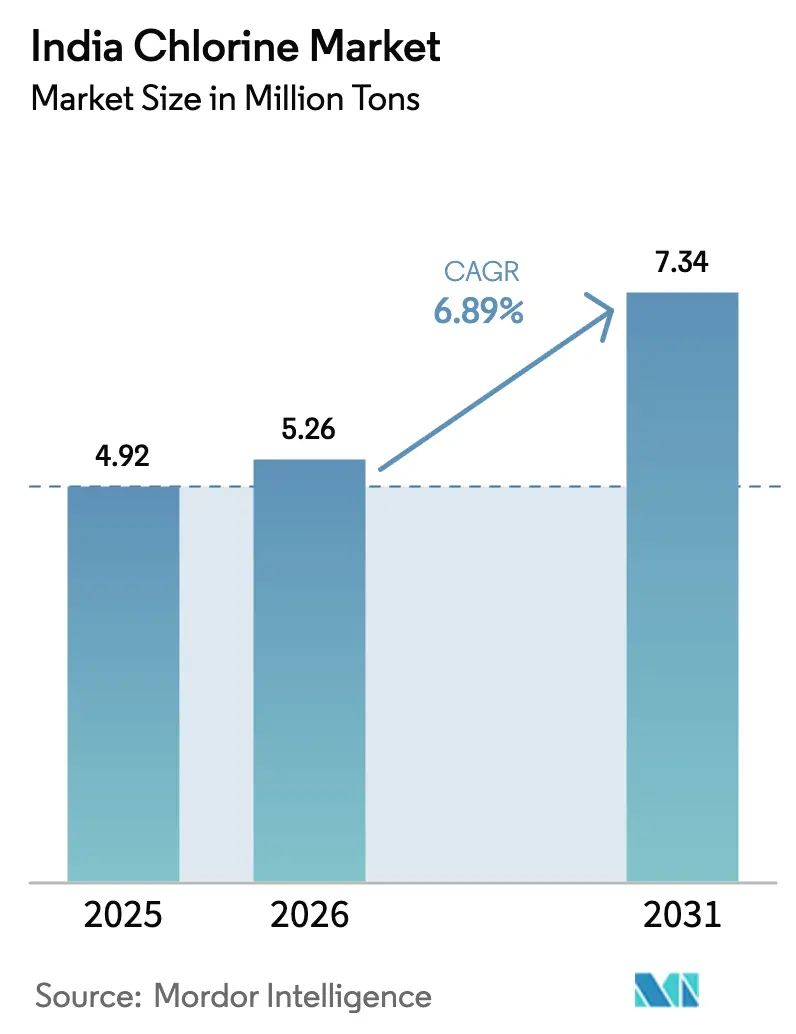
| Base Year Market Size (2025) | 4.92 Million tons |
| Market Volume (2026) | 5.26 Million tons |
| Market Volume (2031) | 7.34 Million tons |
| Growth Rate (2026 - 2031) | 6.89 % |
| Market Concentration | Medium |
Major Players *Disclaimer: Major Players sorted in no particular order Image © Mordor Intelligence. Reuse requires attribution under CC BY 4.0. | |
India Chlorine Market Analysis by Mordor Intelligence
The India Chlorine Market size was valued at 4.92 Million tons in 2025 and estimated to grow from 5.26 Million tons in 2026 to reach 7.34 Million tons by 2031, at a CAGR of 6.89% during the forecast period (2026-2031). Steady capacity additions in polyvinyl chloride (PVC), rapid municipal water-treatment rollouts, and expanding pharmaceutical production give the India chlorine market a broad, multi-sector growth base. Producers continue to favor captive consumption strategies that shelter earnings from negative spot‐pricing swings while ensuring reliable feedstock for downstream vinyls, water-treatment chemicals, and specialty intermediates. The switch from mercury to membrane electrolysis improves cost positions by cutting electricity use and supporting compliance with stricter pollution norms. Integrated players with energy-efficient plants and downstream extensions are therefore consolidating their lead, even as regional demand spreads toward the eastern states.
Key Report Takeaways
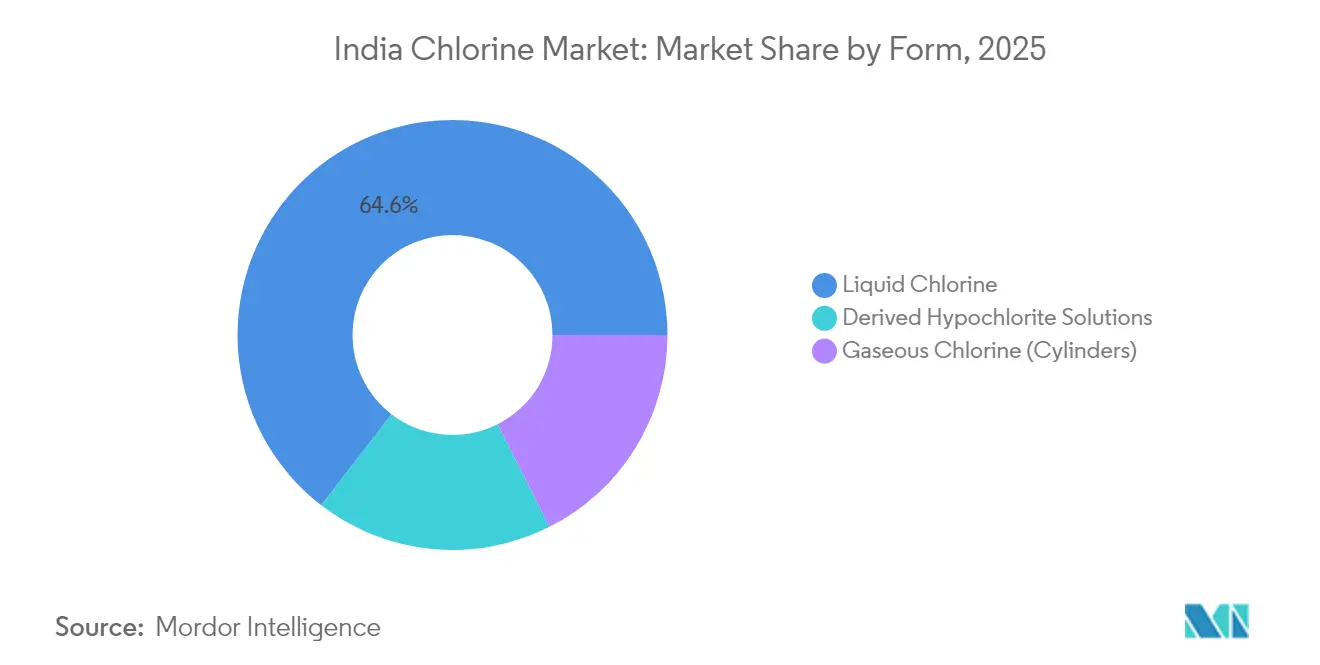
- By form, liquid chlorine held 64.55% of the India chlorine market share in 2025, whereas derived hypochlorite solutions are expanding at a 7.03% CAGR through 2031.
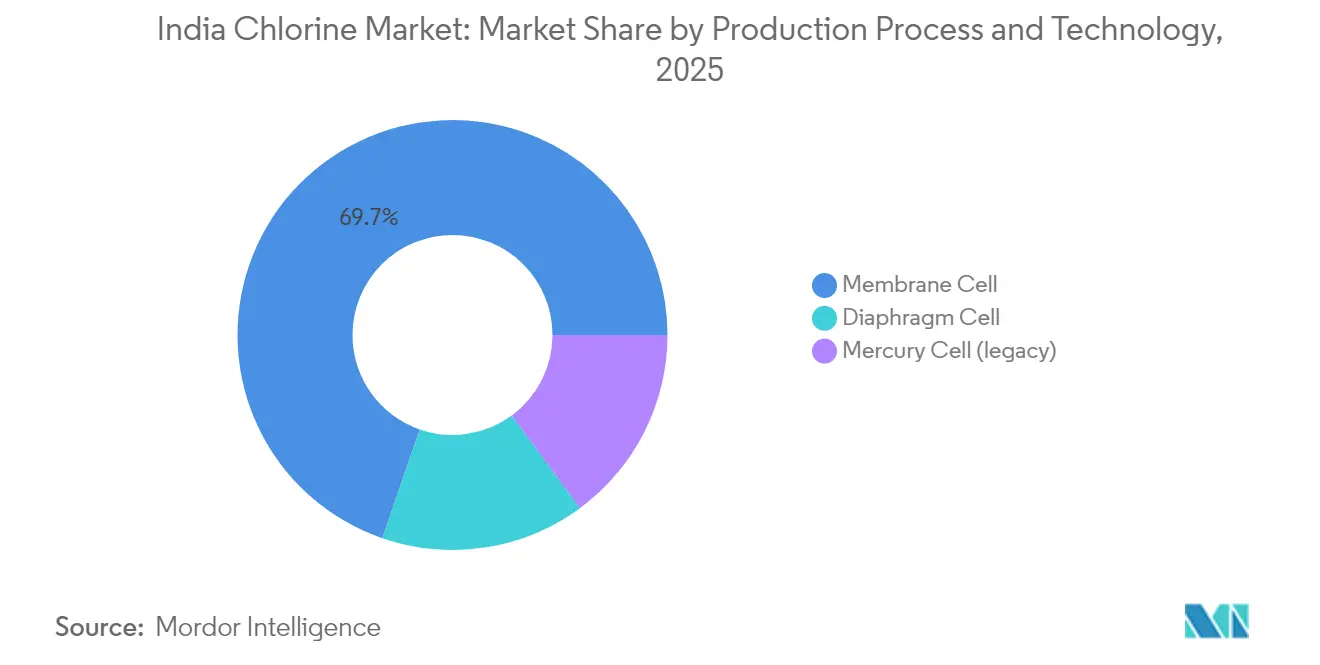
- By production technology, membrane cell accounted for 69.70% of the India chlorine market size in 2025 and is advancing at a 6.94% CAGR over the forecast horizon.
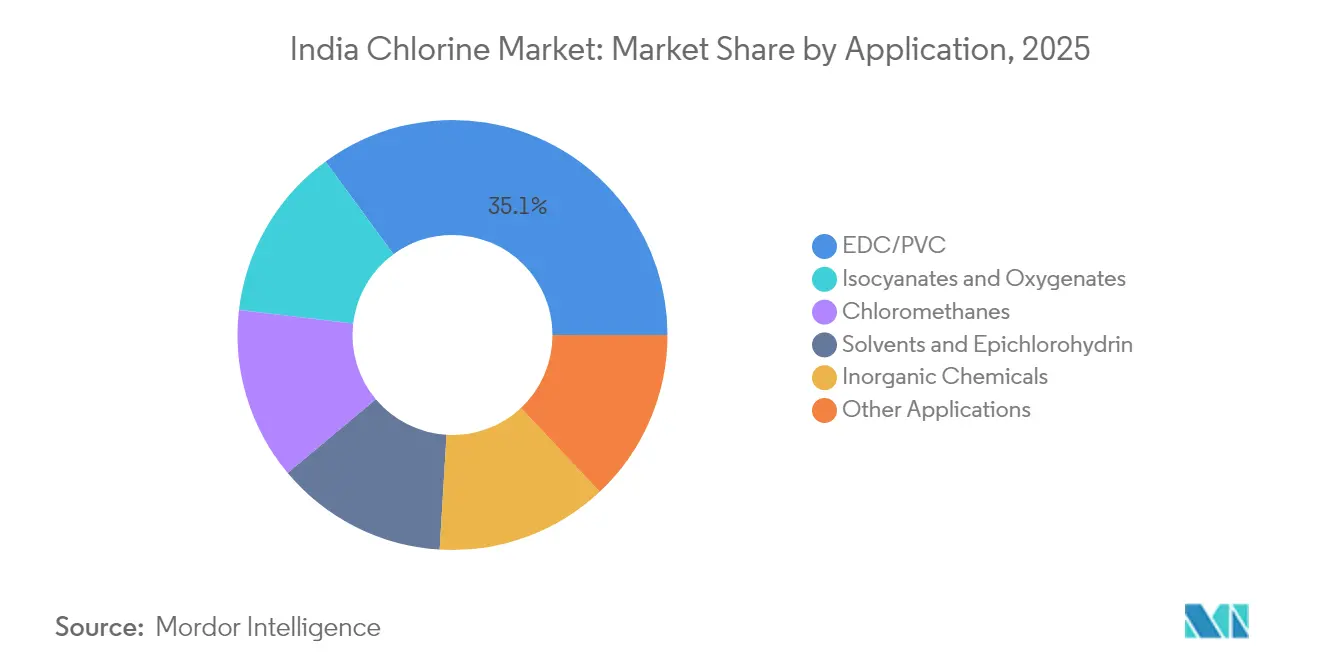
- By application, EDC/PVC led with 35.05% usage in 2025; isocyanates and oxygenates are projected to grow fastest at a 7.21% CAGR to 2031.
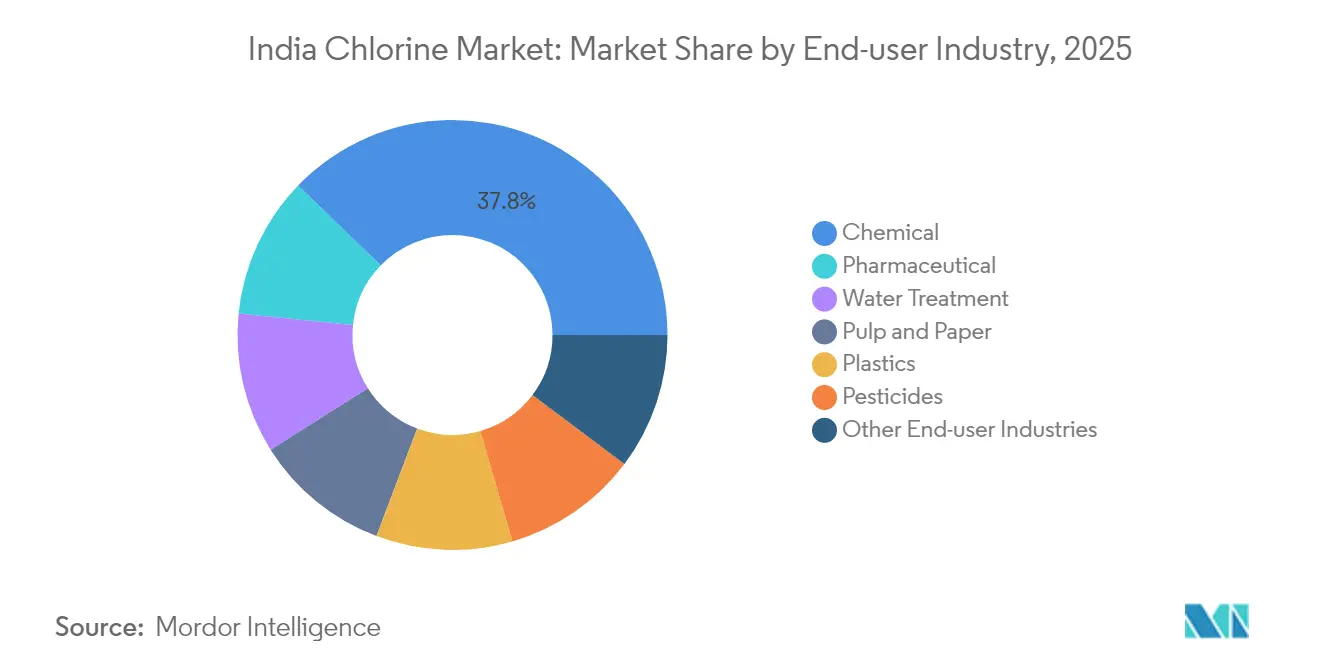
- By end-user industry, chemical accounted for 37.75% of overall consumption in 2025, while pharmaceutical is set to post a 7.38% CAGR to 2031.
Note: Market size and forecast figures in this report are generated using Mordor Intelligence’s proprietary estimation framework, updated with the latest available data and insights as of 2026.
India Chlorine Market Trends and Insights
Drivers Impact Analysis*
| Driver | (~) % Impact on CAGR Forecast | Geographic Relevance | Impact Timeline |
|---|---|---|---|
| Expansion of PVC and CPVC Capacity Pipeline | +2.1% | West India, South India | Medium term (2-4 years) |
| Rapid Growth in Municipal Water-Treatment Infrastructure | +1.8% | National, with early gains in rural areas | Long term (≥ 4 years) |
| Strong Pharmaceuticals and Agro-Chemicals Output Linkage | +1.5% | West India, South India | Medium term (2-4 years) |
| Captive Consumption Strategy Amid Negative Chlorine Pricing | +1.0% | West India, South India | Short term (≤ 2 years) |
| Accelerated Switch to Membrane-Cell Technology Lowering Energy Cost | +1.2% | National | Short term (≤ 2 years) |
| Source: Mordor Intelligence | |||
Expansion of PVC and CPVC Capacity Pipeline
New PVC and CPVC plants are central to the next growth wave in the India chlorine market. Domestic PVC demand climbed 9% in 2024, encouraging firms such as Adani and Reliance to schedule multi-stage vinyl expansions that will lift captive chlorine offtake[1]Reliance Industries Ltd., “FY 2024 Annual Report,” ril.com . CPVC resin capacity at Epigral nearly tripled to 75,000 TPA in 2024, widening domestic supply for high-temperature piping and lowering import dependence. The capacity pipeline shifts the supply–demand balance by absorbing merchant chlorine and stabilizing realizations for integrated producers. Margin exposure to global vinyl price cycles remains, yet energy-efficient plants and port-adjacent logistics give western clusters a structural edge. Policymakers view vinyl import substitution as strategic for infrastructure, reinforcing offtake security for chlorine producers.
Rapid Growth in Municipal Water-Treatment Infrastructure
The Jal Jeevan Mission lifted rural piped-water coverage to 79.74% of households by March 2025, creating a non-cyclical demand channel for chlorine disinfectants. Municipal operators favor hypochlorite because it simplifies storage and dosing in decentralized schemes. Rising urban wastewater volumes also require chlorine dosing at sewage plants to meet pathogen limits prescribed by the Bureau of Indian Standards. As water coverage expands into underserved eastern districts, chlorine usage disperses geographically and lowers the historic concentration in Gujarat-centered industrial corridors. Long-term budget allocations further insulate water-treatment demand from macro swings that affect commodity chemicals.
Strong Pharmaceuticals and Agro-Chemicals Output Linkage
Chlorine-based intermediates remain indispensable for India’s agrochemical exports, which reached USD 5.5 billion in 2024. Production Linked Incentive (PLI) schemes for APIs and bulk drugs spur new domestic facilities that intensify chlorine procurement. Registration approvals for 118 active molecules in 2024 included several chlorinated compounds, underpinning steady intermediate demand. Export-oriented formulators lean on backward integration to secure chlorine derivatives, reducing exposure to import logistics. Rising environmental norms in key importing regions also favor compliant Indian manufacturers, sustaining chlorine pull from the specialty chemical value chain.
Captive Consumption Strategy Amid Negative Chlorine Pricing
When caustic-soda prices climb but chlorine prices fall, integrated operators redirect chlorine internally rather than release it into a weak merchant market. Grasim reached a 62% chlorine integration rate in FY 2024, limiting its exposure to spot volatility. Such strategies smooth revenue, justify continuous plant operation, and support downstream projects in EDC, epichlorohydrin, and chloromethanes. Captive models gain further relevance as western clusters grapple with high storage costs and transport restrictions on gaseous chlorine. The approach reinforces the position of diversified conglomerates in the India chlorine market.
Restraints Impact Analysis*
| Restraint | (~) % Impact on CAGR Forecast | Geographic Relevance | Impact Timeline |
|---|---|---|---|
| Stringent Environmental and Worker-Safety Regulations | -1.2% | National, with stricter enforcement in West India | Short term (≤ 2 years) |
| Excess Caustic-Soda Capacity Creating Chlorine Oversupply | -0.8% | West India, South India | Medium term (2-4 years) |
| Limited Downstream Integration (Disposal Logistics Cost) | -0.6% | East India, North India | Medium term (2-4 years) |
| Source: Mordor Intelligence | |||
Stringent Environmental and Worker-Safety Regulations
The Central Pollution Control Board includes chlor-alkali in its red category, requiring comprehensive impact assessments for any expansion. Zero-liquid-discharge norms add costly evaporators and crystallizers, pushing up unit capital cost. Plants using legacy mercury cells face stranded assets and must invest heavily in brine-filtration, membranes, and gas handling equipment to comply. Worker-safety norms mandate specialized personal protective gear, leak-detection systems, and on-site emergency response teams. Smaller standalone producers often struggle with the capital load, tilting the India chlorine industry toward larger, better-funded operators.
Excess Caustic-Soda Capacity Creating Chlorine Oversupply
Total caustic-soda capacity hit 320,430 TPA by March 2025, outpacing domestic demand growth and forcing plants to run at lower operating rates. Because chlorine production is chemically linked to caustic output, oversupply drags chlorine realizations down. Export options relieve caustic imbalance yet cannot absorb the concurrent chlorine surplus. Smaller plants lacking downstream chlorine integration sell into a weak merchant market and face high freight costs for liquid shipments. Integrated majors shield themselves by channeling chlorine into EDC, PVC, and chlorinated solvents, keeping utilization steady during pricing troughs.
*Our forecasts treat driver/restraint impacts as directional, not additive. The impact forecasts reflect baseline growth, mix effects, and variable interactions.
Segment Analysis
By Form: Liquid Chlorine Dominance Drives Infrastructure Efficiency
Liquid chlorine accounted for 64.55% of the India chlorine market share in 2025, anchored by well-developed rail and tanker infrastructure between Gujarat’s production hubs and downstream consumers. The India chlorine market size for hypochlorite solutions is, however, set to expand briskly as municipal schemes prefer safer, diluted products with simpler logistics. Gaseous cylinders remain a niche choice for small-scale users who value precise dosing over bulk-handling economics.
Liquid chlorine continues to dominate large EDC plants that require uninterrupted, high-purity feedstock. Western ports simplify raw salt supply, and pipelines in Dahej and Bharuch enable direct transfers to vinyl units. Meanwhile, hypochlorite gains ground in health-care facilities and public utilities seeking low-risk chlorine handling. State water boards issue tenders that explicitly favor local hypochlorite supply, redirecting some volume away from pressurized gas formats. Overall, diversifying form preferences enrich the value proposition for integrated producers.



By Production Process and Technology: Membrane Cell Technology Captures Market Leadership
Membrane technology captured 69.70% of overall output in 2025 and is projected to grow at 6.94% through 2031, reflecting its critical role in the India chlorine market. Diaphragm cells hang on in a few plants where brine purity is easier to manage, while mercury cells are fast approaching retirement.
The India chlorine market size gains efficiency as membrane units roll out advanced rectifiers that raise current density without overheating. Operators invest in nanofiltration to strip sulfates and calcium, cutting brine purge volumes by up to 90%. Hydrogen co-produced from membrane plants feeds new hydrogen-peroxide lines and onsite boilers, securing incremental revenue streams. Equipment suppliers betting on diaphragm retrofits are pivoting toward turnkey membrane packages that promise quick payback under high power tariffs.
By Application: EDC/PVC Leadership Faces Specialty Chemical Competition
EDC/PVC applications absorbed 35.05% of chlorine in 2025, driven by import-substitution policies that encourage local vinyl production. At the same time, isocyanates and oxygenates are recording a 7.21% CAGR as polyurethane demand grows in refrigeration, automotive, and insulation markets.
The India chlorine market size tied to EDC/PVC remains large, yet specialty chemicals are chipping away by offering higher margins and lower cyclicality. Epigral’s new chlorotoluenes line exemplifies how producers migrate to value-added derivatives. Epichlorohydrin volumes that feed epoxy resins also respond to the electronics and electric-vehicle sectors. Demand diversity broadens chlorine usage and cushions the impact of PVC margin swings linked to global capacity additions.
By End-user Industry: Chemical Industry Dominance Amid Pharmaceutical Acceleration
Chemical industry consumed 37.75% of total volume in 2025, underscoring the centrality of integrated complexes in Gujarat and Tamil Nadu. Pharmaceutical industry, however, is rising at a 7.38% CAGR to 2031, supported by government PLI incentives for APIs.
Within chemicals, captive chlorine moves into chloromethanes, solvents, and fluoropolymers. Water-treatment demand scales with new sewage and effluent plants in urban belts. The India chlorine market size associated with pharmaceuticals grows as companies add multi-purpose plants that leverage chlorine chemistry for high-value intermediates. Chemplast Sanmar’s USD 121 million expansion confirms this pivot toward custom manufacturing for regulated markets.
Geography Analysis
West India generated 36.20% of 2025 volume, reflecting the dominance of Gujarat’s salt resources, port access, and co-located downstream clusters. Integrated complexes in Dahej channel chlorine straight into vinyls, epichlorohydrin, and chlorinated solvents. State environmental rules favor large units able to finance membrane upgrades. The India chlorine market share in the west therefore remains stable, even as older mercury cells retire.
East and North-East India is the fastest-expanding region at a 7.05% CAGR. Government incentives lower project costs, and new industrial corridors create fresh offtake for chlorine derivatives. Jal Jeevan Mission contracts in Bihar and Assam pull hypochlorite demand eastward, easing regional supply imbalances. Producers consider barge and rail solutions to connect eastern plants with raw salt and caustic-soda markets in the west.
South India maintains consistent growth on the back of specialty chemicals and pharma clusters in Tamil Nadu, Andhra Pradesh, and Telangana. Chlorine moves into CPVC, APIs, and pesticides produced in these states. North India shows steady, though moderate, gains as water-treatment and plastic-pipe plants roll out, depending on chlorine shipments from western plants until local capacity materializes. Collectively, regional diversification dilutes historical concentration and supports a resilient India chlorine market.
Regulatory Landscape
India's chlor-alkali and chlorine market operates under a compliance-heavy framework covering plant safety, product quality, and environmental permitting. The Department of Chemicals and Petrochemicals implements mandatory conformity requirements for select chemicals through Quality Control Orders (QCOs) notified under the BIS Act, 2016, which shapes procurement and certification expectations across industrial and municipal buyers.
On the technical and safety side, Bureau of Indian Standards (BIS) specifications and codes influence both production and downstream use, including IS 10553 (Part 1) for safe practices in handling and storage of chlorine, alongside product standards such as IS 11673 for sodium hypochlorite solution and IS 9825 for chlorine tablets. These standards affect market structure by tightening requirements around packaging, dosing, and traceability, and they also support a shift toward standardized hypochlorite solutions for decentralized water-treatment programs.
Value Chain Analysis
The value chain begins with salt or brine sourcing and power procurement feeding chlor-alkali electrolysis, where chlorine is produced as a co-product alongside caustic soda (industry operations typically manage the co-production linkage between the two outputs). In India, chlorine balancing is therefore a core operational issue, especially when merchant disposal is constrained by hazardous handling requirements and transport limitations.
Downstream, producers convert chlorine into captive or merchant derivatives, such as hydrochloric acid and value-added chlorinated organics, or route it through dedicated pipelines to nearby consumers to reduce logistics and safety risk. Integrated complexes in western clusters, including Gujarat (Dahej and Bharuch), are key nodes because co-location supports continuous offtake into EDC/PVC and other derivative units. Major participants such as Grasim Industries, Gujarat Alkalies and Chemicals Limited (GACL), and DCM Shriram use integration and related infrastructure, including storage, rail and tankers, and in some cases pipelines, to manage chlorine monetization and limit exposure to weak spot pricing.
Competitive Landscape
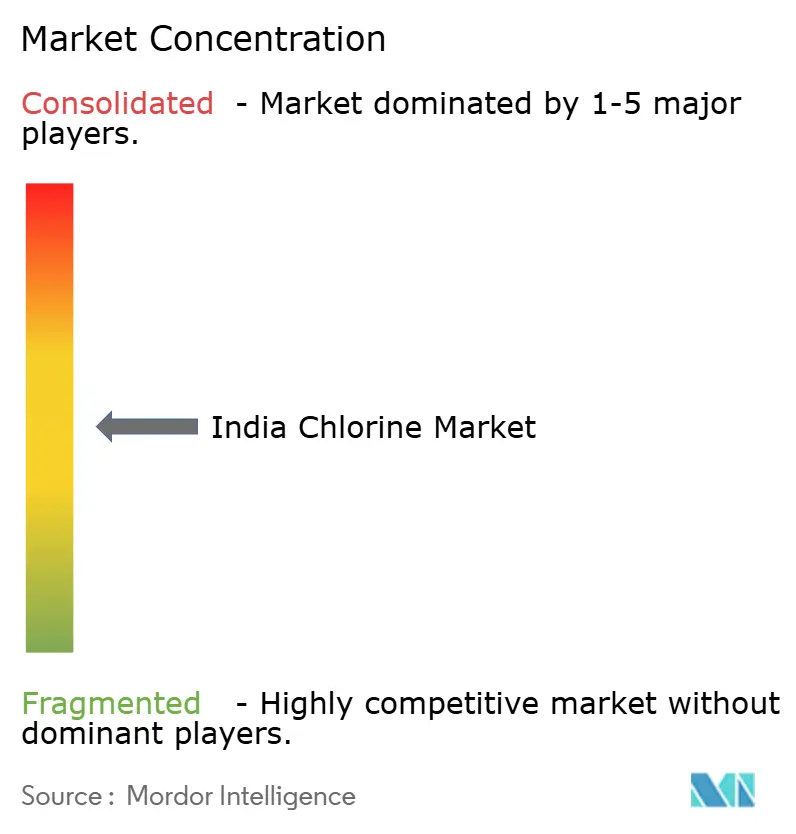
The India chlorine market features a moderately concentrated field where Reliance Industries, Tata Chemicals, and Grasim Industries anchor capacity. Reliance integrates chlorine into one of the world’s largest vinyl chains, insulating its electrolysis units from merchant swings. Grasim leverages a 62% integration rate that channels chlorine into epoxy, chloromethane, and textile-grade caustic[2]Grasim Industries Ltd., “Investor Presentation FY 2024,” grasim.com . Tata Chemicals balances export caustic sales with domestic chlorine derivative projects.
Second-tier players such as DCM Shriram, Epigral, and Chemplast Sanmar advance through specialty derivatives. Epigral’s chlorotoluenes facility inaugurates a differentiated aromatic chlorination platform. Chemplast Sanmar funnels chlorine into custom pharmaceuticals and paste PVC, broadening its earnings mix. As mercury-cell phase-outs accelerate, capital intensity rises, prompting alliances with technology providers and engineering contractors.
Emerging entrants eye membrane revamps bundled with captive power and hydrogen valorization. Central Pollution Control Board norms accelerate consolidation because smaller standalone plants face disproportionate compliance costs. Integrated majors acquire distressed assets to secure regional footholds, maintaining the moderate concentration that characterizes the India chlorine industry.
India Chlorine Industry Leaders
Grasim Industries Limited (Aditya Birla)
Gujarat Alkalies and Chemicals Limited
DCM Shriram
Chemplast Sanmar Limited
NIRMA
- *Disclaimer: Major Players sorted in no particular order

Market Opportunities and Future Outlook
A clear opportunity area is higher chlorine integration into downstream derivatives that reduce reliance on merchant chlorine movement and improve overall chlor-alkali economics. Company actions in Gujarat provide concrete evidence, with Grasim advancing projects at Vilayat, including a 50 KTPA epichlorohydrin (ECH) plant (reported at mechanical completion in Q3 FY26) and a Phase I 50 KTPA CPVC resin plant. Both projects pull chlorine into higher-value chains and align with the report's emphasis on captive consumption.
Water-treatment chemicals and specialty chlorinated intermediates also create whitespace, supported by capacity additions and offtake creation. GACL commissioned chlorine-consuming downstream capacity, including a chlorotoluenes project at Dahej and a Poly Aluminium Chloride (PAC) powder facility at Vadodara (February 2025), reflecting producer focus on value-added products tied to municipal and industrial water systems. On the investment pipeline side, DCM Shriram's January 2024 MoU with the Government of Gujarat for a proposed INR 12,000 crores investment in Bharuch through 2028 indicates continued build-out of chemical and petrochemical manufacturing that can absorb chlorine directly or through integrated derivative platforms.
Recent Industry Developments
- February 2026: Gujarat Alkalies and Chemicals Limited board approved the installation of a 33,870 TPA Food Grade Phosphoric Acid plant at Dahej and capacity enhancement of KOH (Caustic Potash) from 120 TPD to 200 TPD. The project broadens the companys product slate and fortifies feedstock diversification at Dahej, supporting downstream chlorine and related chemicals for diversified end-use applications.
- February 2026: Grasim Industries Limited ongoing construction of 50 KTPA Epichlorohydrin plant and 50 KTPA CPVC resin plant at Vilayat, with capacity expansion projects integrated to improve chlorine utilization. The expansion strengthens the integration of chlorine into value-added derivatives and expands Grasims downstream capability in specialty polymers and resins.
- September 2025: DCM Shriram - Announced a long-term strategic partnership with Aarti Industries Ltd for chlorine supply, involving a new dedicated jacketed underground pipeline between their plants in Jhagadia, Gujarat, to supply an additional 200 tonnes of chlorine per day. The collaboration enhances supply security and supports higher operating rates for chlorine dependent downstream production.


Research Methodology Framework and Report Scope
Market Definition and Coverage
For this methodology, the India chlorine market is defined as the domestic demand and supply of chlorine produced and consumed in India across industrial and municipal uses, measured mainly in volume because chlorine is largely integrated with chlor-alkali operations and captive downstream chains.
Scope exclusions: Imports and exports of chlorine as a traded commodity are treated as a context signal and are not counted as primary market demand on their own.
Segmentation Overview
- By Form
- Liquid Chlorine
- Gaseous Chlorine (Cylinders)
- Derived Hypochlorite Solutions
- By Production Process and Technology
- Membrane Cell
- Diaphragm Cell
- Mercury Cell (legacy)
- By Application
- EDC/PVC
- Isocyanates and Oxygenates
- Chloromethanes
- Solvents and Epichlorohydrin
- Inorganic Chemicals
- Other Applications
- By End-user Industry
- Chemical
- Water Treatment
- Pharmaceutical
- Pulp and Paper
- Plastics
- Pesticides
- Other End-user Industries
Data Sources, Market Sizing, and Validation
Desk Research
Desk research started with building the India chlorine demand map from public statistical series and technical references, then matching it to how chlor-alkali plants typically operate in India.
Sources included Ministry of Chemicals and Fertilizers (DCPC) publications, Central Pollution Control Board (CPCB) compliance and environmental reporting, and India trade statistics from UN Comtrade and related government portals. We also reviewed standards and usage guidance for disinfection and water treatment, using documents from Bureau of Indian Standards, CPCB water and wastewater references, and peer reviewed chemistry and process engineering journals.
For commercial context, we reviewed company annual reports, exchange filings, and investor presentations to understand capacity additions, technology shifts (membrane versus legacy), and downstream integration. We then cross checked selected datapoints through paid subscriptions focused on company financials, patent filings, and shipment-level trade intelligence. The sources named here are illustrative and not exhaustive, and many other public documents and databases were also used for data collection, validation, and research clarification.
Primary Interviews and Surveys
Primary work focused on validating what portion of chlorine is captive versus merchant, how pricing connects to caustic soda operating decisions, and where logistics constraints affect realized demand, especially for liquid chlorine. Interviews covered producers, distributors, and large end users, and we also checked assumptions with technical experts familiar with chlor-alkali plant operations and water treatment procurement patterns across India.
Because the market is country specific, we balanced coverage across key demand centers and manufacturing clusters, so state level differences in downstream consumption and supply reliability could be represented in the final model.
Distribution of primary research fieldwork respondents
| Company type | Respondent position |
|---|---|
| Top tier: 29% | CXOs: 13% |
| Mid tier: 56% | Functional/Unit leaders: 32% |
| Smaller Players: 15% | Managers: 55% |
Market-Sizing & Forecasting
Sizing was built using a top-down demand pool reconstruction, where chlor-alkali operating rates, effective chlorine yield, and downstream offtake patterns were translated into total chlorine volume consumed in India. The output was then corroborated with selective bottom-up checks, such as sample producer capacity roll ups by technology, channel checks for merchant liquid volumes, and approximate volume-by-application sanity checks using typical dosage and consumption ranges where they are standardized.
Key inputs in the India chlorine market model included chlor-alkali capacity additions and shutdown schedules, the split between captive use and merchant sales, and the pace of PVC and other chlorinated intermediates expansion. We also incorporated municipal and industrial water treatment activity and the role of power and salt availability, since these affect utilization levels. Where gaps existed for smaller merchant suppliers or fragmented application pockets, we built ranges and narrowed them through interviews, then aligned totals to realistic plant dispatch constraints.
Forecasting used scenario analysis supported by trend smoothing, since chlorine volumes can swing when caustic soda pricing shifts plant run rates and when new downstream units start up. Demand scenarios were anchored to the commissioning calendar and utilization ramps, then adjusted using expert views on technology migration toward membrane cells and likely captive integration intensity over the forecast period.
Data Validation & Update Cycle
Validation relied on triangulating model outputs against independent signals such as chlor-alkali operating announcements, downstream capacity utilization commentary, and trade flow directionality. We reconciled large variances through a second pass of assumptions. Outliers were flagged when implied per-plant output, implied per-sector consumption, or year over year changes appeared inconsistent with what industry participants described.
Before sign-off, the model goes through multi step analyst reviews, and follow-up calls are triggered if a key input changes or a new capacity event is confirmed. Reports are refreshed annually, with interim updates when material events occur, followed by a final pre-delivery sweep to ensure the latest information is reflected.
Mordor Intelligence's India Chlorine Market Size Compared With Other Published Estimates
Published estimates for India chlorine often vary because some are reported in value and others in tons, and because the definition of what counts as chlorine demand is not consistent across sources. Differences also show up when reports apply different base years, assume different utilization rates, or treat captive consumption and merchant shipments in different ways.
Liquid chlorine only is the most common exclusion that explains the spread. It sits outside Mordor Intelligence's scope because the market total is built to include chlorine volumes across forms that are produced and consumed in India. Additional gaps usually come from how spot price volatility is converted into annual averages, whether a conservative or aggressive plant ramp scenario is used, and how frequently assumptions are refreshed after capacity announcements or policy driven water treatment programs.
Benchmark comparison
| Source | Market Size | Gaps in Research Methodology |
|---|---|---|
| Mordor Intelligence | USD 4.92 M (2025) | |
| Industry Research Outlet A | USD 1.89 M (2019) | The figure reflects liquid chlorine demand only and is presented for an earlier year, so it does not capture captive chlorine tied to downstream chains or newer capacity ramps that lift total national volumes. |
| Trade Journal B | USD 2.27 M (2030) | This estimate is aligned to a liquid chlorine demand projection and may apply a narrow end-use basket, which can understate total chlorine demand when broader industrial and on-site consumption is included. |
Across the three numbers, the differences are mainly driven by form coverage (total chlorine versus only liquid) and the choice of base and forecast years. By keeping the scope tied to total domestic chlorine volumes and then pressure testing utilization and downstream ramps with interviews, the estimate stays traceable to plant operations and real consumption drivers instead of price-only extrapolation.


Key Questions Answered in the Report
How large is the India chlorine market in 2026?
The India chlorine market size is 5.26 million tons in 2026.
What CAGR is projected for chlorine demand in India through 2031?
Demand is forecast to rise at a 6.89% CAGR between 2026 and 2031.
Which production technology holds the largest share?
Membrane cell technology accounts for 69.70% of current capacity.
Why is West India dominant in chlorine production?
Gujarat’s salt resources, port access, and integrated petrochemical clusters give West India a 36.20% market share.
Page last updated on:





