
Market Overview
| Study Period | 2021 - 2031 |
|---|---|
| Forecast Data Period | 2026 - 2031 |
| Historical Data Period | 2021 - 2024 |
| Growth Rate | 2.55 % |
| Fastest Growing Market | Asia Pacific |
| Largest Market | Asia Pacific |
Major Players *Disclaimer: Major Players sorted in no particular order Image © Mordor Intelligence. Reuse requires attribution under CC BY 4.0. | |
Hydro Turbine Market Analysis by Mordor Intelligence
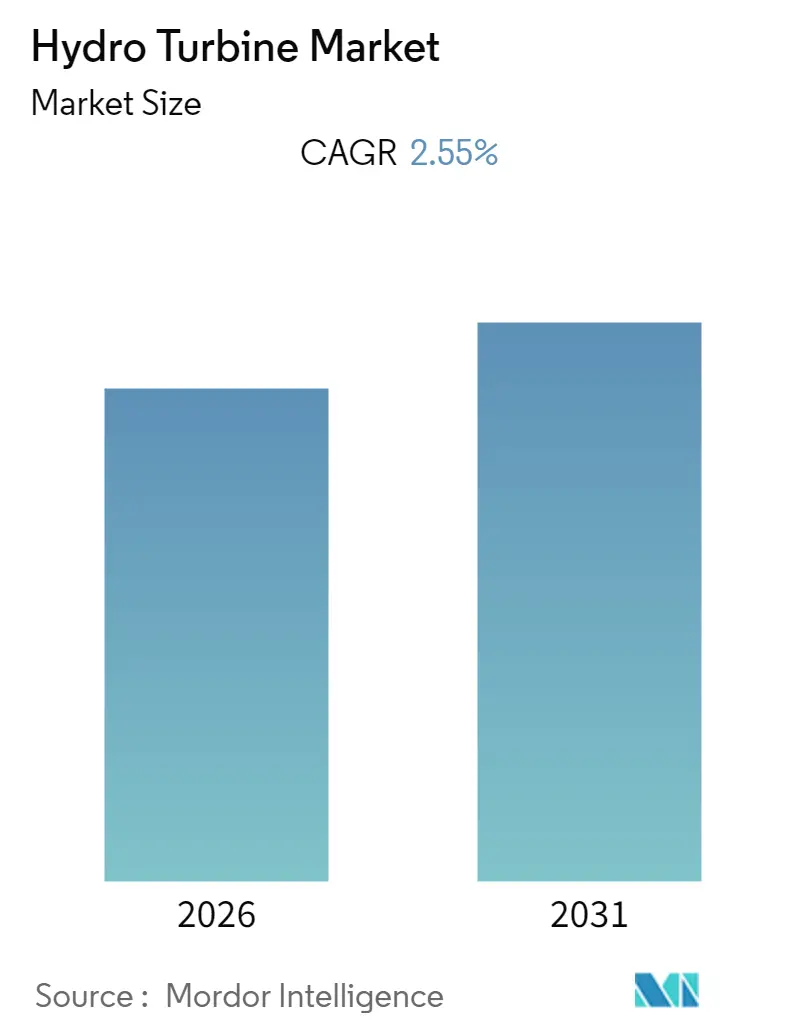
The Hydro Turbine Market size is expected to register a CAGR of greater than 2.55% during the forecast period (2026-2031).
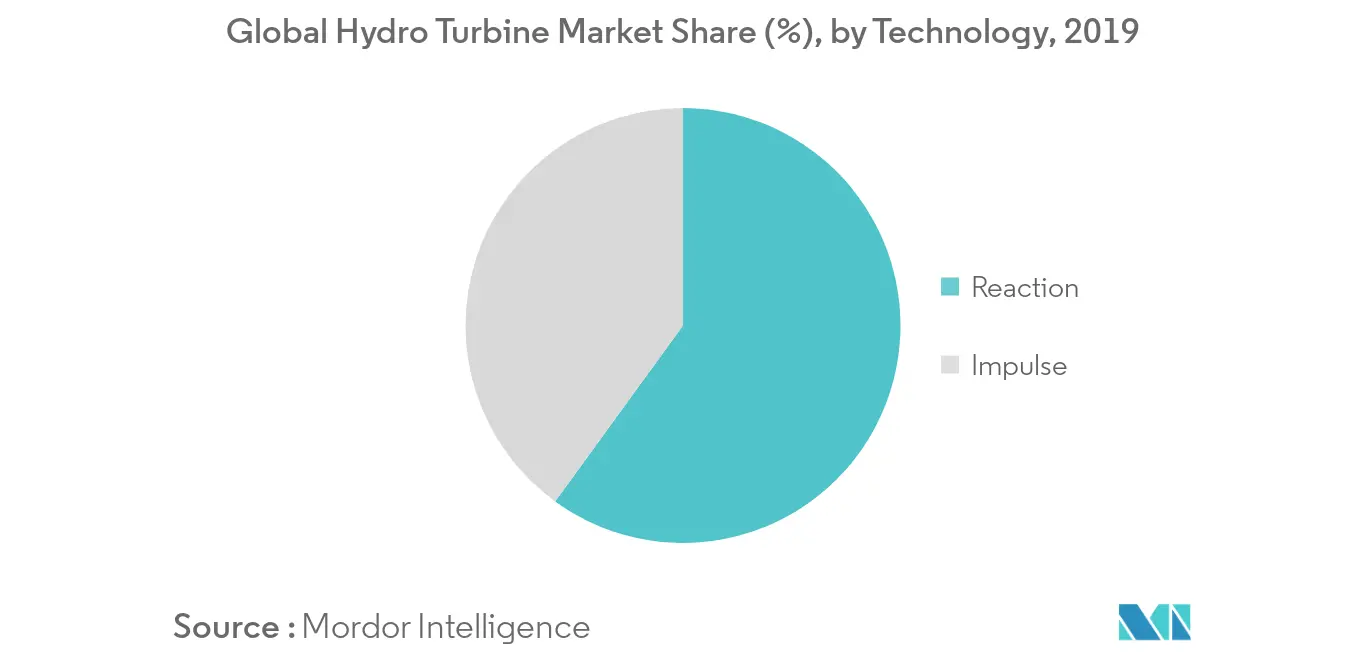
- Reaction turbine segment, by technology, of hydro turbine is expected to be the largest market during the forecast period, owing to increased use of reaction turbine types such as Francis turbine and Kaplan turbines.
- Expansion of energy intensive industries in African countries such as Nigeria, Angola, and Ghana are expected to provide a significant opportunity for hydro turbine market in the near future.
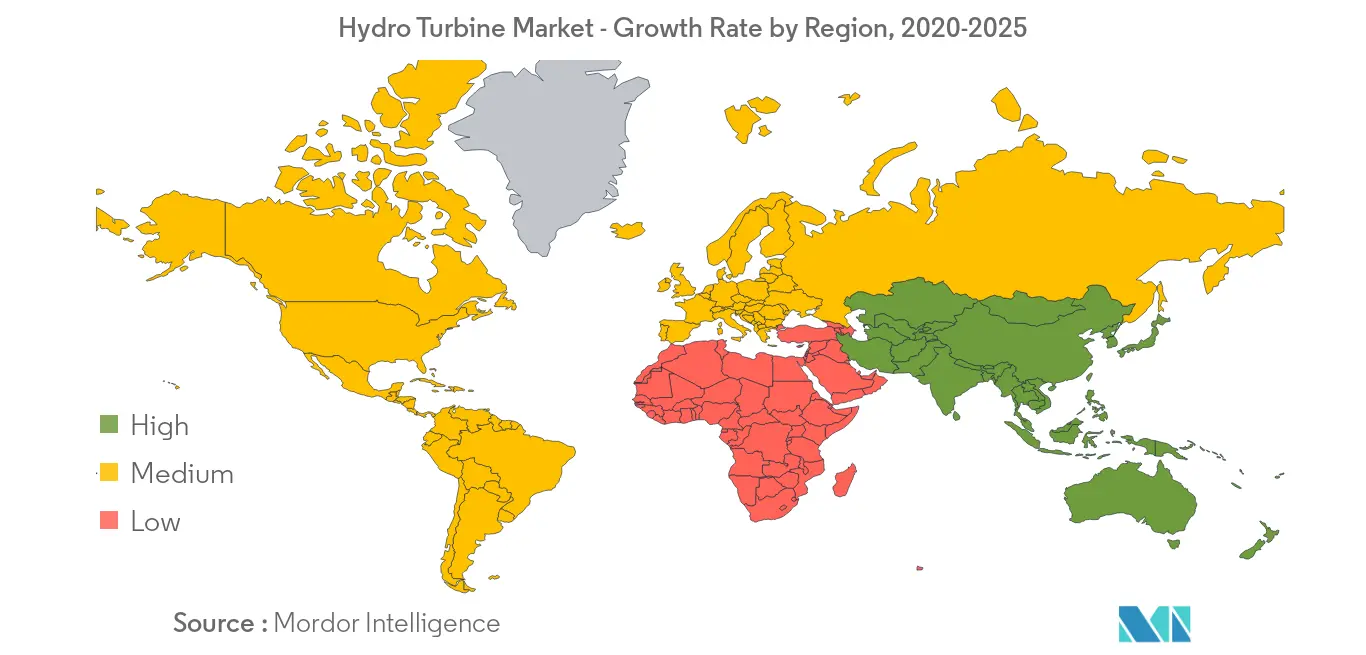
- Asia-Pacific is the largest market and is also expected to be the fastest growing market, owing to the highest annual increase in hydro power capacity in 2018, continuing the growth trajectory.
Note: Market size and forecast figures in this report are generated using Mordor Intelligence’s proprietary estimation framework, updated with the latest available data and insights as of 2026.
Market Trends and Insights
Reaction Turbine to Dominate the Market
- A reaction turbine develops power from the combined action of pressure and moving water. These turbines are used to generate maximum power output from a low available water head and high velocities. Almost 60% of turbines used in hydro power plants are reaction turbines.
- Francis turbines are from the reaction turbine class of hydro turbines and are the most widely used turbines in hydro power plants. As of 2017, almost 55% of the turbines installed at the existing facilities in the United States are Francis turbines.
- In May 2018, Bharat Heavy Electricals Limited (BHEL) secured a contract from SJVN Arun-3 Power Development (SAPDC) to implement the 900 MW Arun-3 hydroelectric project. Under the USD 80 million deal, BHEL is expected to design, manufacture, supply, and commission four vertical 225 MW Francis turbines and generator sets.
- Kaplan turbines are being installed in new power plant in countries, such as the United States, China, and India, as they are well-suited for the low-head sites and have better efficiency. Hence, promulgating the growth of hydro turbine market.


Asia-Pacific to Dominate the Market
- Asia-Pacific accounts for around 41% of hydroelectric consumption globally, with major demand arising from China and India. The region witnessed a growth of 4.2% in 2018 for hydroelectricity generation in comparison to 2017.
- China was the fastest growing country with respect to installed capacity of hydro power in 2018, adding 8.54GW. Over 90% of the added capacity in Asia-Pacific came from China, including 1.5 GW from pumped storage, which increased China's total installed capacity to 352 GW. This, in turn, is expected to create ample opportunities for the hydro turbine market.
- In May 2018, the Government of India initiated the 1000 MW Pakal Dul hydroelectric project and the 330 MW Krishnaganga hydroelectric project in Jammu and Kashmir's Kishtwar district. Moreover, countries such as Japan, Vietnam and South Korea have been investing in hydro power sector, promulgating the hydro turbine market.
- The hydro power industry, being the biggest end user of hydro turbines, has witnessed a significant growth in the recent years in Asia-Pacific, and is expected to be the fastest growing region.

Regulatory Landscape
Hydro turbine projects and refurbishments are shaped by permitting, environmental compliance, and technical standards, which in turn influence unit design, operating envelopes, and upgrade timelines. In the United States, hydropower licensing and post-license modifications are overseen by the Federal Energy Regulatory Commission (FERC), and in November 2025 FERC opened a notice of inquiry on authorizations for post-licensing activities, signaling that repairs and upgrades across the existing fleet are under active review. In Europe, project approvals and operations remain closely tied to environmental obligations under the EU Water Framework Directive, the Environmental Impact Assessment Directive, and the Habitats and Birds Directives, which affect fish passage, instream flows, and water-quality design choices for new builds and relicensing.
On the technical compliance side, standards updates are reinforcing requirements for performance validation and flexible operation. The IEC has published updates relevant to turbine governing systems and acceptance testing, including IEC 61362:2024 guidance for specifying governing systems, IEC 60308:2024 on testing of governing systems, and IEC 63461:2024 for Pelton model acceptance tests, affecting OEM qualification and contractual test protocols. In China, GB/T 46341-2025, issued in October 2025 and implemented from May 2026, sets fundamental technical requirements for flexible operating hydropower turbines under ultra-wide load, aligning turbine design and controls with grid flexibility needs.
Value Chain Analysis
The hydro turbine value chain begins with project development and engineering, including site assessment, hydraulic design, and environmental studies, and then moves to procurement of major electromechanical packages and long-lead manufacturing of runners, shafts, wicket gates, and auxiliary systems. Global OEMs such as Andritz, GE Vernova, and Voith typically integrate large units (greater than 100 MW), coordinating sub-suppliers for generators, transformers, controls, instrumentation, and balance-of-plant components. Upstream inputs include specialized steel (carbon and stainless grades) and copper, while manufacturing spans large casting and forging, precision machining, welding, surface treatment, assembly, factory testing, and logistics to site for installation and commissioning.
Downstream, the chain is supported by modernization, spare parts, and service agreements over multi-decade asset lives, often 30-50 years, which creates irregular demand cycles and complicates capacity planning for shops and foundries. Sector supply chain assessments also point to constraints such as limited availability of large steel castings for heavy runners, often exceeding 10 tons, capacity and lead-time pressures on generator windings for large units, and skilled labor gaps in machinists, welders, and engineers. Supply chain mapping initiatives, including ORNLs HydroSource dataset on U.S. hydropower supply chain manufacturing locations (2025), highlight how regional manufacturing clusters and service providers support refurbishment programs and component remanufacturing.
Competitive Landscape
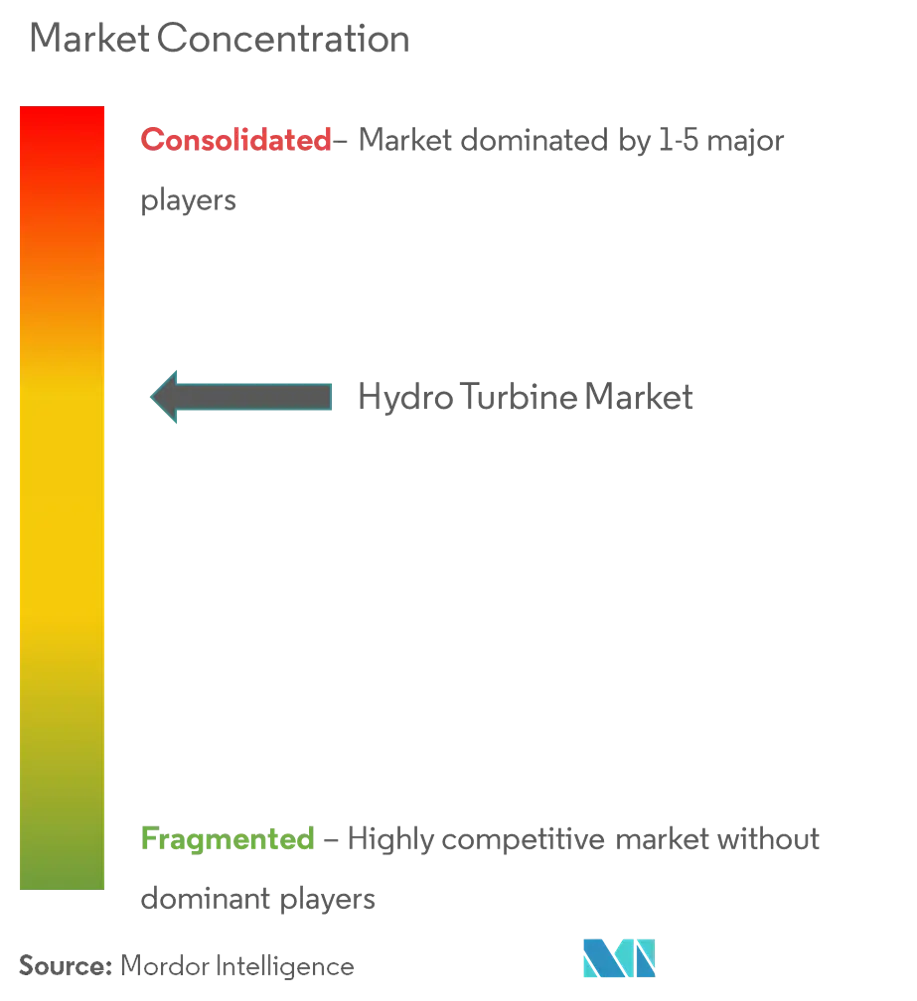
The hydro turbine market is moderately consolidated. Some of the key players are General Electric Co., Siemens AG, Andritz AG, Litostroj Power Group, and Voith GmbH & Co. KGaA.
Hydro Turbine Industry Leaders
General Electric Co.
Siemens AG
Andritz AG
Litostroj Power Group
Voith GmbH & Co. KGaA
- *Disclaimer: Major Players sorted in no particular order
Hydro Turbine Market Companies Covered in this Report
- General Electric Company
- Siemens AG
- Andritz AG
- Canyon Industries Inc.
- Voith GmbH & Co. KGaA
- Gilbert Gilkes & Gordon Ltd
- Kirloskar Brothers Ltd
- Norcan Hydraulic Turbine Inc.
- Litostroj Power Group
- WWS-Wasserkraft GmbH

Market Opportunities and Future Outlook
Government-backed programs and a large global project pipeline are expanding addressable demand for hydro turbine supply, refurbishment, and controls upgrades across conventional and pumped-storage applications. In April 2026, India’s Union Cabinet approved the Small Hydro Power Development Scheme (2026-31) with an outlay of INR 2,584.60 crore to support 1,500 MW of new small hydro capacity, creating a defined procurement channel for small and medium hydro turbine packages, EPC integration, and O&M services. In Canada, the Taltson Hydro Expansion Project entered the federal Major Projects Office pathway in March 2026, a 60 MW expansion with a 320 km transmission line, which reflects continued momentum for integrated generation-plus-transmission developments in remote and industrial load corridors.
Utility and owner-operator spending on pumped storage and fleet modernization is translating into tender volume for variable-speed pump-turbines, upgraded Francis and Kaplan runners, and digital controls aimed at improving flexibility and availability. The International Hydropower Association cited a global hydro development pipeline exceeding 1,075 GW, including about 600 GW of pumped storage and 475 GW of conventional projects, while procurement activity in 2026 shows OEMs winning large pumped-storage and uprate packages, including GE Vernovas May 2026 contract for nine 150 MW pumped-storage units for the 1.35 GW Upper Sileru project in India and Voith Hydros May 2026 contract for the electro-mechanical package for JSW Energys 1,500 MW Bhavali pumped storage plant. In Brazil, policy-backed expansion and modernization remains a demand center, supported by planning signals such as the PDE 2035 hydropower expansion reference and large multi-unit awards, including ANDRITZs May 2026 turnkey contracts for additional generating units at COPELs Foz do Areia and Segredo plants, over 2.1 GW combined.
Recent Industry Developments in Hydro Turbine Market
- July 2026: ANDRITZ won a contract from Mainstream Energy Solutions Limited to modernize unit 2G4 at the Jebba hydropower plant in Nigeria. The award reflects continued capex directed toward life-extension and performance upgrades in existing African hydro fleets, supporting demand for turbine refurbishment engineering, manufacturing, and field services.
- June 2026: Voith received an order from Iberdrola Generacion S.A. to modernize two 32.5/43 MW pump-turbines at the Torrejon pumped-storage plant in Spain. The project highlights the market shift toward pumped-storage modernization as utilities prioritize flexibility, availability, and upgraded electro-mechanical performance from existing assets.
- June 2025: Voith secured a modernization contract covering the Temengor (400 MW), Bersia (72 MW), and Kenering (120 MW) hydropower stations in Malaysia. This multi-site scope underlines the role of refurbishment programs in Asia-Pacific, where unit upgrades and reliability improvements sustain turbine and service demand beyond greenfield additions.


Hydro Turbine Market Report Scope and Research Methodology
Market Definition and Coverage
This market covers hydro turbines sold for electricity generation in hydropower plants, counted as manufacturer revenues for new units and replacement or upgrade units, across major regions.
Scope exclusions: It does not count civil construction works, dams, or broader balance-of-plant items that are not part of the turbine supply package.
Segments Covered in This Report
- Technology
- Reaction
- Impulse
- Capacity
- Small (Less than 10MW)
- Medium (10MW - 100MW)
- Large (Greater than 100MW)
- Geography
- North America
- Europe
- Asia-Pacific
- South America
- Middle-East and Africa
Data Sources, Market Sizing, and Validation
Desk Research
Desk work starts by anchoring the demand pool for hydropower additions and refurbishments, and then mapping where turbine orders usually follow. Public sources such as International Energy Agency releases, International Renewable Energy Agency statistics, World Bank energy indicators, and UN Comtrade trade data are used to track new capacity signals and cross-border equipment flows.
We also reviewed manufacturer filings, investor presentations, utility and project-owner announcements, and hydropower association publications to understand tender timing and typical supply scope. For missing financial splits and to standardize company-level revenue views, we used paid subscriptions for company financials and intelligence, along with a patent database to track design activity that often aligns with upgrade cycles. These desk sources are illustrative, and many other public and paid references were also used to collect, validate, and clarify data points.
Primary Interviews and Surveys
Primary interviews and surveys were used to test the desk assumptions on what is actually booked and delivered as a hydro turbine package, and how pricing changes with head, capacity band, and refurbishment intensity. We spoke with a mix of OEM-side leaders, EPC and integrator teams, and plant operators across the main demand regions so that regional procurement patterns and lead times could be checked before finalizing the model.
Distribution of primary research fieldwork respondents
| Company type | Respondent position | Region |
|---|---|---|
| Top tier: 30% | CXOs: 17% | APAC: 41% |
| Mid tier: 49% | Functional/Unit leaders: 27% | EMEA: 35% |
| Smaller Players: 21% | Managers: 56% | Americas: 24% |
Market-Sizing & Forecasting
Sizing is built using a top-down approach where hydropower capacity additions and refurbishment activity by region are reconstructed, and then converted into turbine demand using capacity band splits and typical replacement ratios. The totals are checked with selective bottom-up approximations, mainly by sampling turbine ASP ranges by type and capacity and applying them to expected unit volumes, followed by channel checks against tender pipelines.
Key inputs that shape the model include annual hydropower commissioning trends, refurbishment and life-extension cycles (including runner and wicket gate upgrades), the split of small, medium, and large projects, regional tender calendars, and metal input cost direction that influences quoted prices. For forecasting, scenario analysis is used because project starts can be lumpy, and the base case is adjusted using expert views on permitting pace, grid expansion plans, and financing conditions. When bottom-up visibility is uneven in smaller regions, gaps are handled through peer project benchmarking and conservative price-volume assumptions, which are re-tested in follow-up calls.
Data Validation & Update Cycle
Outputs are validated by comparing modeled revenue against independent signals like hydropower capacity additions, announced upgrade programs, and observed trade flows for turbine-related equipment where applicable. Outliers are flagged, assumptions are revisited, and in some cases respondents are re-contacted when a variance is driven by scope misunderstandings or a timing mismatch between bookings and deliveries.
Before sign-off, the work is reviewed in steps so that calculation logic, unit conversions, and regional roll-ups are consistent. The report is refreshed annually, and interim updates are made when material events occur, such as large tender awards, policy changes that impact build schedules, or major currency swings. Right before delivery, a final check is completed to ensure the latest public announcements and macro inputs are reflected.
Mordor Intelligence's Hydro Turbine Market Size Versus Other Published Estimates
Published market sizes for hydro turbines can differ even when the product sounds similar, mainly because each publisher chooses a different scope around what is included in the turbine package and how refurbishments are timed. Differences also come from how currency conversion is handled and whether the estimate follows project commissioning dates or order intake.
In our checks, the biggest drivers were whether retrofit revenues are counted only when shipped and installed versus when contracts are awarded, and whether adjacent hydropower equipment is blended into the turbine number. Some estimates also apply a single global ASP curve across capacity bands, which can overstate large-unit revenues when project mix shifts toward small and medium sites, and then that gap stays until the next refresh. These choices explain why the same year can show a wide spread.
Benchmark comparison
| Source | Market Size | Gaps in Research Methodology |
|---|---|---|
| Mordor Intelligence | USD 2.54 B (2024) | |
| Industry Research Publisher A | USD 2.41 B (2025) | Uses a later base year and can smooth project timing by applying uniform growth assumptions across regions, which may understate refurbishment-heavy markets when upgrade cycles accelerate. |
| Industry Publisher B | USD 2.60 B (2025) | Often counts a broader hydropower turbine value that can lean more on forecasted additions and a generalized ASP curve, which can push totals up when large-project assumptions are aggressive. |
The table shows that year choice and what gets counted as a turbine package can move the total by a few hundred million dollars. By tying the model to commissioning and refurbishment signals and keeping retrofit revenues aligned to delivery timing rather than only awards, the estimate stays closer to repeatable demand indicators, which is the approach used by Mordor Intelligence.


Key Questions Answered in the Report
What is the current Hydro Turbine Market size?
The Hydro Turbine Market is projected to register a CAGR of greater than 2.55% during the forecast period (2026-2031)
Who are the key players in Hydro Turbine Market?
General Electric Co., Siemens AG, Andritz AG, Litostroj Power Group and Voith GmbH & Co. KGaA are the major companies operating in the Hydro Turbine Market.
Which is the fastest growing region in Hydro Turbine Market?
Asia Pacific is estimated to grow at the highest CAGR over the forecast period (2026-2031).
Which region has the biggest share in Hydro Turbine Market?
In 2025, the Asia Pacific accounts for the largest market share in Hydro Turbine Market.
What years does this Hydro Turbine Market cover?
The report covers the Hydro Turbine Market historical market size for years: 2020, 2021, 2022, 2023, 2024 and 2025. The report also forecasts the Hydro Turbine Market size for years: 2026, 2027, 2028, 2029, 2030 and 2031.
Page last updated on:


 Your data is secure and never sold or shared.


