
Hemocytometer Market Size and Share
Market Overview
| Study Period | 2020 - 2031 |
|---|---|
| Market Size (2026) | USD 491.79 Million |
| Market Size (2031) | USD 675.06 Million |
| Growth Rate (2026 - 2031) | 6.54 % |
| Fastest Growing Market | Asia-Pacific |
| Largest Market | North America |
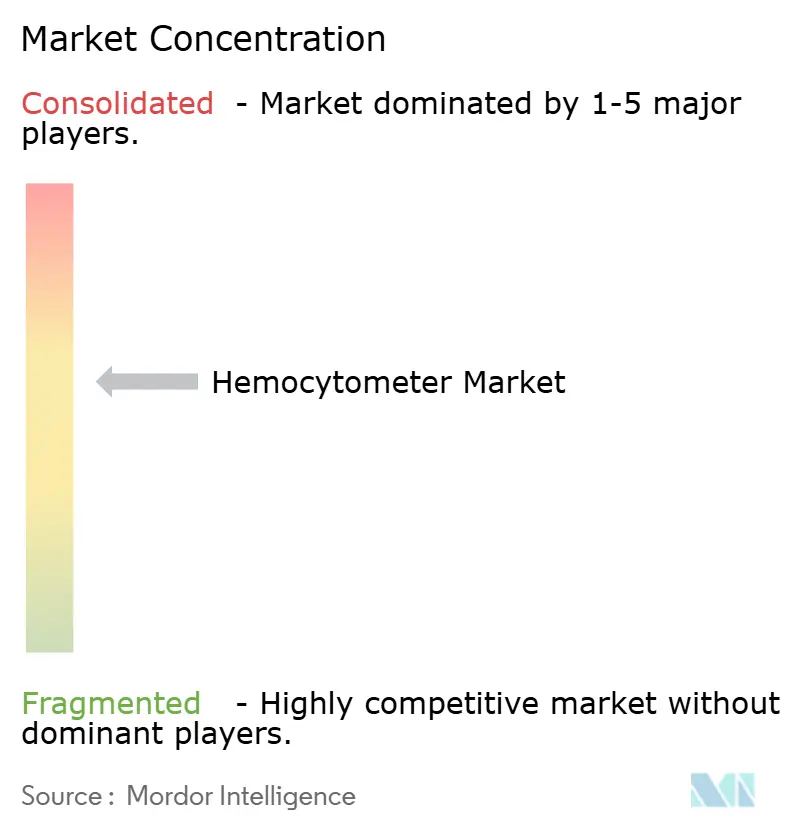
| Market Concentration | Medium |
Major Players *Disclaimer: Major Players sorted in no particular order Image © Mordor Intelligence. Reuse requires attribution under CC BY 4.0. | |
Hemocytometer Market Analysis by Mordor Intelligence
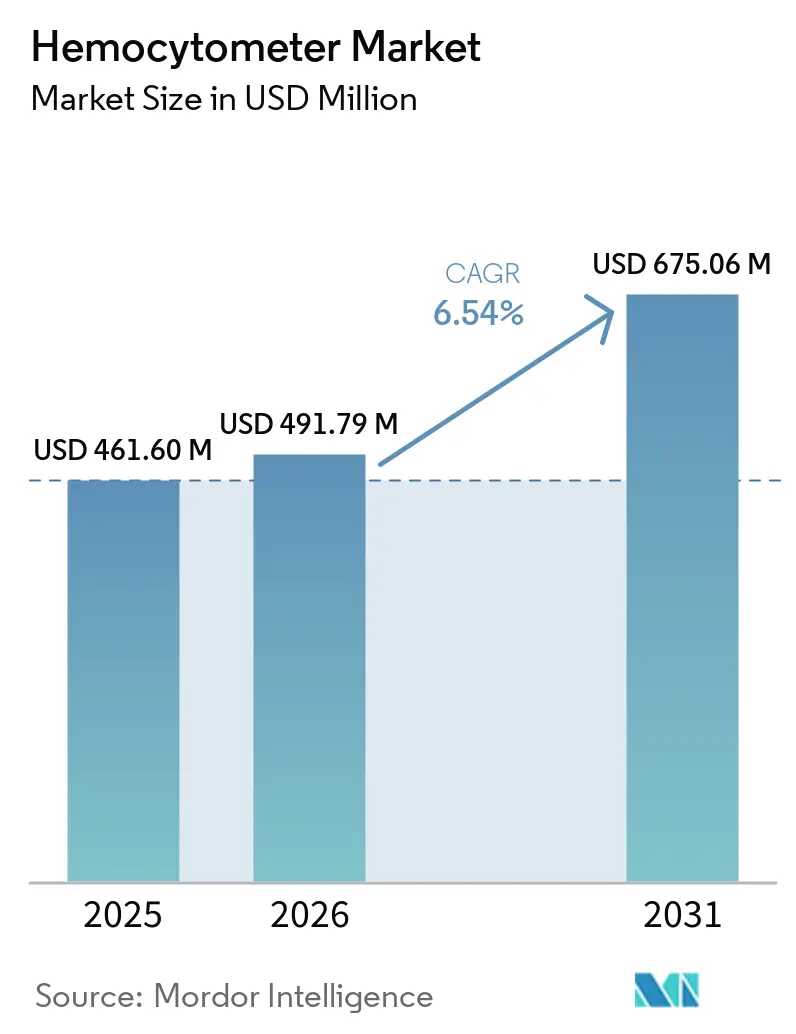
The Hemocytometer Market size is projected to be USD 461.60 million in 2025, USD 491.79 million in 2026, and reach USD 675.06 million by 2031, growing at a CAGR of 6.54% from 2026 to 2031.
Growth is linked to the increasing scale of cell and gene therapy manufacturing, where cell counts support processing, expansion, and release decisions. Disposable chambers are gaining relevance because they avoid cleaning cycles and support contamination control in regulated laboratories. Digital imaging is also becoming more common, although direct microscopic counting remains important when laboratories need to inspect morphology, debris, or cell clumping. The hemocytometer market, therefore, continues to serve both established laboratory routines and more structured quality-control workflows. Suppliers are responding by pairing chamber precision, documentation, and digital records rather than relying on a single product format.
Key Report Takeaways
- By product, manual hemocytometers held 57.65% revenue share in 2025, while automated hemocytometers are forecast to grow at an 8.65% CAGR through 2031.
- By chamber material, glass chambers accounted for 47.87% revenue share in 2025, while plastic and polymer chambers are forecast to grow at an 8.87% CAGR through 2031.
- By application, blood cell counting held 39.65% of revenue in 2026, while cell viability assessment is forecast to grow at a 9.32% CAGR through 2031.
- By end user, diagnostic laboratories held 58.65% revenue share in 2025, while pharmaceutical and biotechnological companies are forecast to grow at a 9.55% CAGR through 2031.
- By geography, North America held 42.56% of revenue in 2025, while Asia-Pacific is forecast to grow at a 7.54% CAGR through 2031.
Note: Market size and forecast figures in this report are generated using Mordor Intelligence’s proprietary estimation framework, updated with the latest available data and insights as of January 2026.
Market Trends and Insights
Drivers Impact Analysis of Hemocytometer Market*
| Driver | (~) % Impact on CAGR Forecast | Geographic Relevance | Impact Timeline |
|---|---|---|---|
| Cell And Gene Therapy Manufacturing Workflows | +1.50% | North America and Europe core, with spill-over to Asia-Pacific | Long term (≥ 4 years) |
| Rapid Viability And Concentration Assessment | +1% | Global | Medium term (2-4 years) |
| Automated Imaging And Digital Counting | +0.80% | North America, Europe, South Korea, and China | Medium term (2-4 years) |
| Biotechnology And Life-Science Research Expansion | +0.60% | Asia-Pacific core, with spill-over to Middle East and Africa | Long term (≥ 4 years) |
| Point-Of-Care White Blood Cell Testing | +0.30% | Middle East and Africa, South America, South Asia, and Southeast Asia | Medium term (2-4 years) |
| Disposable Chambers And Contamination Control | +0.50% | Global, concentrated in North America and Europe | Short term (≤ 2 years) |
| Source: Mordor Intelligence | |||
Growing Cell and Gene Therapy Manufacturing Workflows
Cell and gene therapy manufacturing requires viable cell density measurements during processing, expansion, and release. The hemocytometer market benefits when facilities need a direct reference method besides automated equipment. The FDA finalized its guidance on manufacturing flexibilities for human cellular and gene therapy products on May 5, 2026[1]U.S. Food and Drug Administration, “Flexible Requirements for Cell and Gene Therapies to Advance Innovation,” U.S. Food and Drug Administration, fda.gov.. Direct observation can help users identify debris, clumps, and morphology before batch disposition. Suppliers can benefit by providing calibrated chambers, traceable procedures, and records that support method qualification.
Increasing Demand for Rapid Cell Viability and Concentration Assessment
Cell viability assessment is increasingly used as a process control activity in biologics and cell therapy workflows. A 2026 study evaluated digital holographic microscopy across 40 industrial and academic CHO cultures at densities reaching 100 million cells per mL. ISO 20391-2:2019 remained current after its February 2025 confirmation and supports structured evaluation of cell counting methods[2]International Organization for Standardization, “ISO 20391-2:2019 Biotechnology, Cell Counting, Part 2,” International Organization for Standardization, iso.org.. Hemocytometers remain useful during validation when laboratories need a familiar visual reference. The hemocytometer market benefits where laboratories need both rapid results and interpretable cell images.
Adoption of Automated Imaging and Digital Counting
Automated imaging can reduce errors associated with coverslip placement and operator variation. NanoEntek introduced the EVE HT A26 in July 2026, which the company stated can process 96 samples in 10 minutes from a 20 µL input. High-volume facilities value automated records and standardized image interpretation. Manual chambers remain useful for low-volume work and samples with debris, clumps, or nonstandard cells. The hemocytometer market is becoming more differentiated by sample complexity, throughput, and documentation needs.
Expansion of Biotechnology and Life-Science Research
Biotechnology research supports cell counting across discovery, process development, microbiology, and drug development. Academic laboratories often use chamber methods because they are accessible and supported by familiar protocols. Thermo Fisher Scientific expanded Bioprocess Design Centers in Incheon, Hyderabad, and Singapore during December 2025. These activities support the laboratory ecosystem that uses both high-throughput systems and cost-effective manual chambers. The hemocytometer market gains from this diverse scientific demand base.
Restraints Impact Analysis of Hemocytometer Market*
| Restraint | (~) % Impact on CAGR Forecast | Geographic Relevance | Impact Timeline |
|---|---|---|---|
| Substitution By Automated Cell Counters And Flow Cytometers | -0.80% | North America and Europe primarily | Short term (≤ 2 years) |
| Manual-Counting Variability And Operator Dependence | 0% | Global | Medium term (2-4 years) |
| Limited Standardization Across Chamber Designs And Protocols | -0.30% | Global, most acute in multicenter research | Long term (≥ 4 years) |
| Qualification And Data-Integrity Requirements For Digital Systems | -0.30% | North America and Europe | Medium term (2-4 years) |
| Source: Mordor Intelligence | |||
Substitution by Automated Cell Counters and Flow Cytometers
Automated counters and flow cytometers offer speed and reduced manual effort for routine cell enumeration. This creates the greatest pressure in high-volume diagnostic work. Direct microscopy remains useful for cerebrospinal fluid, semen, yeast, cell aggregates, and other complex samples. Sysmex’s 2026 XR-Series release illustrates continued investment in hematology automation. The hemocytometer market can remain relevant as a reference and verification tool beside automated systems.
Manual-Counting Variability and Operator Dependence
Manual results can vary when operators use different loading, focusing, grid-selection, or cell-inclusion practices. This is a concern in quality-sensitive production settings that require reproducible records. A 2024 scientific review identified challenges in cell counting for cell therapy products and stressed method performance. Digital eyepieces, image capture, and AI-assisted software can improve review without replacing chamber methods. The hemocytometer market can retain users when suppliers provide calibration, training, and clear protocols.
*Our forecasts treat driver/restraint impacts as directional, not additive. The impact forecasts reflect baseline growth, mix effects, and variable interactions.
Hemocytometer Market Segment Analysis
By Product:
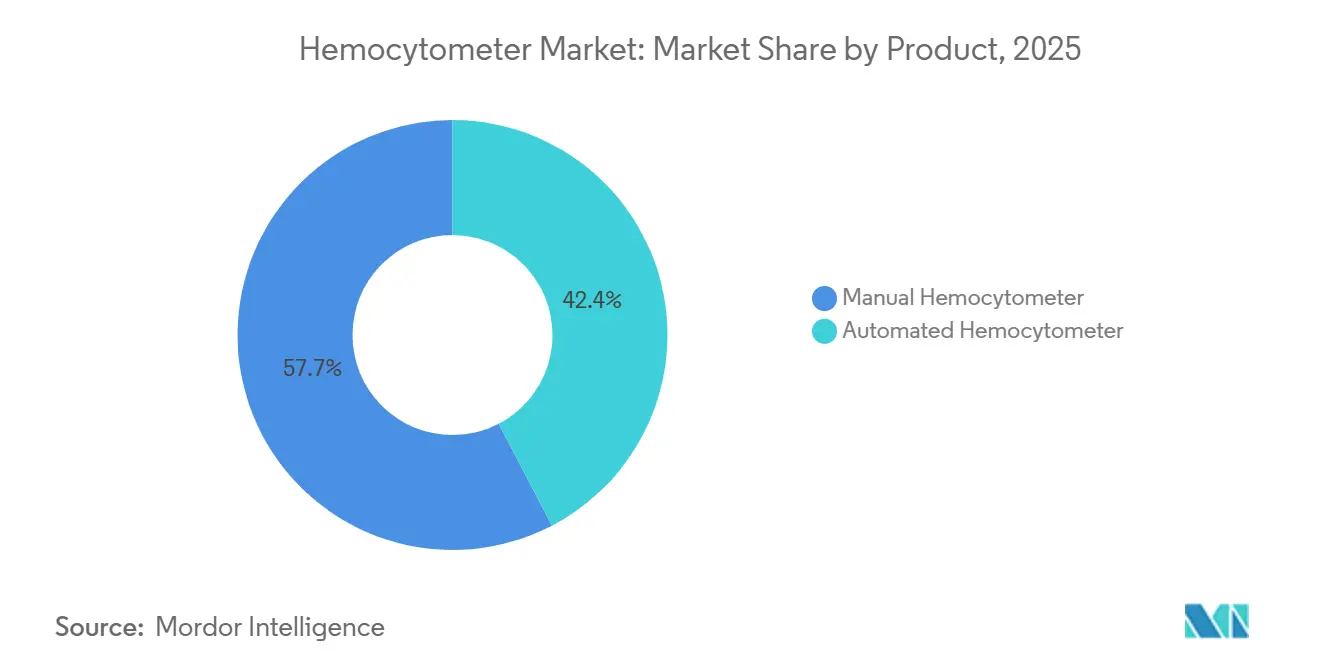
Manual Formats Anchor Volume, Automation Reshapes ValueManual hemocytometers held 57.65% of hemocytometer market share in 2025, supported by installed use across research, clinical diagnostics, and emerging-market laboratories. Buyers value their modest infrastructure needs, controlled procurement costs, and established Neubauer Improved grid procedures. These factors slow migration even as automated alternatives become more accessible. The hemocytometer market size for automated hemocytometers is forecast to grow at an 8.65% CAGR from 2026 to 2031. Growth is led by cell therapy developers, CDMOs, and pharmaceutical quality-control laboratories that need standardized records.
Automated formats improve comparability across users and retain images for later review. NanoEntek’s July 2026 EVE HT A26 release targeted high-throughput workflows with automated sample processing. Manual products remain useful when laboratories need low-cost access, flexibility, or direct morphological review. Product choice increasingly depends on throughput and data requirements rather than a single preference for manual or automated work. The hemocytometer market includes long-established manual demand alongside higher-value automated development.



By Chamber Material:
Glass Holds the Reference Standard, Polymers Take the GrowthGlass chambers accounted for 47.87% of hemocytometer market share in 2025 and remain important in validated methods and regulated quality-control environments. Certified glass products offer documented geometry and familiar optical performance for procedures based on reference formats. Plastic and polymer chambers are forecast to grow at an 8.87% CAGR from 2026 to 2031. Their growth reflects single-use handling needs in high-throughput and contamination-sensitive workflows. The hemocytometer market size for polymer chambers is supported by sterile packaging and reduced cleaning requirements.
NanoEntek’s C-Chip uses optical PMMA and a controlled 100 µm chamber depth. Merck KGaA’s Millicell product uses optical-grade plastic with a Neubauer Improved ruling pattern. These products preserve a familiar chamber method while changing handling and disposal. Composite materials remain an emerging option for specialized research that combines selected optical and single-use characteristics. The hemocytometer market benefits because laboratories weigh validation history, sterility, cost, and convenience differently.
By Application:
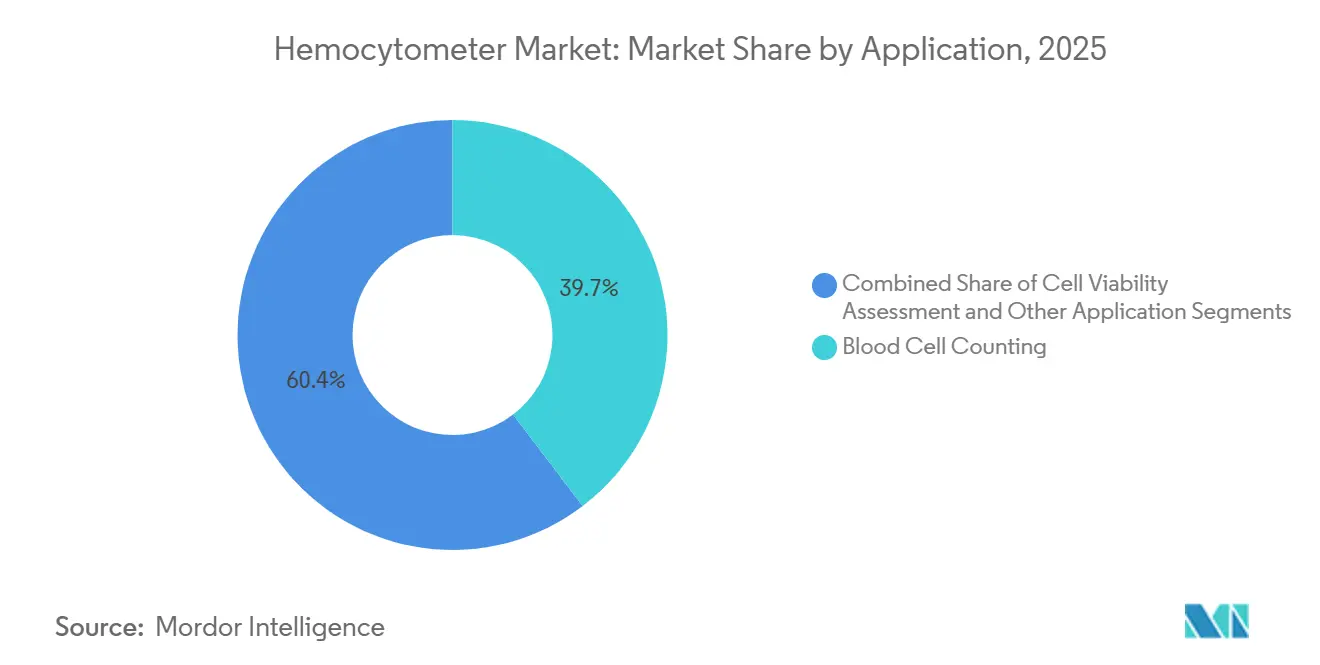
Blood Cell Counting Leads Volume, Cell Viability Drives the Next WaveBlood cell counting held 39.65% of the hemocytometer market size in 2026, supported by routine hematology work in hospitals, clinical laboratories, and point-of-care settings. The activity includes daily erythrocyte and leukocyte enumeration and benefits from long-standing use of Neubauer Improved grids. Cell viability assessment is forecast to grow at a 9.32% CAGR from 2026 to 2031. This demand is tied to bioreactor-based cell therapy and biologics production. The hemocytometer market supports trypan blue and fluorescence-based live-dead assessments used as process controls.
Viability measurement requires both a cell count and an assessment of the counted population’s condition. The 2026 digital holographic microscopy study shows that noninvasive viability methods are advancing across industrial and academic cultures. Well-characterized image data can support the development and evaluation of these methods. Microbiology, fertility diagnostics, and industrial fermentation monitoring are other applications using different grids and handling procedures. The hemocytometer market consequently has demand beyond blood and cell therapy work.
By End User:
Diagnostic Laboratories Command Share, Pharma Redefines Demand QualityDiagnostic laboratories held 58.65% of hemocytometer market share in 2025, reflecting recurring complete blood count and white blood cell differential testing. These buyers commonly favor reusable glass chambers or lower-cost disposable formats, which can limit premium automation adoption. Pharmaceutical and biotechnological companies are forecast to grow at a 9.55% CAGR from 2026 to 2031. They prioritize GMP-grade materials, cross-site consistency, and data-integrity support. The hemocytometer market size for this group rises with cell therapy manufacturing activity.
Hospitals and clinics provide a stable base for cell enumeration, while HemoCue’s WBC DIFF System delivers a five-part differential count in 5 minutes. CDMOs need high-throughput workflows and controlled batch documentation, which NanoEntek addressed with its 2026 EVE HT A26 launch. Contract research organizations and academic institutions continue to support manual and semi-automated demand. These end users have different needs for price, flexibility, throughput, and documentation. The hemocytometer market serves each group through a varied product mix.
Geography Analysis
North America Hemocytometer Market
North America held 42.56% of hemocytometer market share in 2025, supported by cell therapy manufacturing, laboratory accreditation, and biopharma investment. The United States has a central role because it concentrates research laboratories and advanced therapy programs. FDA guidance issued in 2026 keeps attention on appropriate manufacturing controls for cell and gene therapy products. This supports procurement of traceable counting methods and quality-control tools. Canada and Mexico add smaller volumes as laboratory infrastructure investment broadens.
Europe Hemocytometer Market
Europe holds the second-largest regional position in the hemocytometer market, with Germany, the United Kingdom, and France leading demand. Germany has a supply role through precision glassware producers, including Glaswarenfabrik Karl Hecht GmbH and Paul Marienfeld GmbH. European advanced therapy manufacturing requires traceable and validated procedures under applicable good manufacturing practice expectations. Italy, Spain, and the rest of Europe add demand through hospital modernization and expanding contract research activity. The region favors products that combine familiar methods with clear compliance documentation.
APAC, MEA and South America Hemocytometer Market
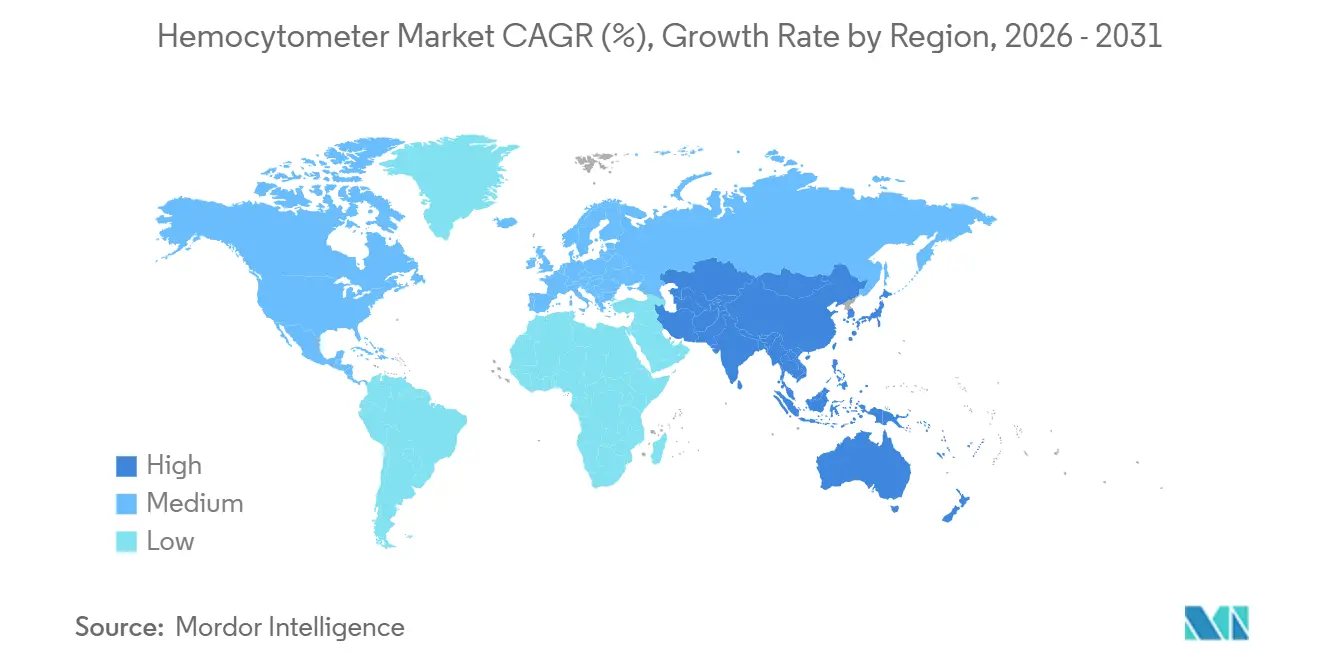
Asia-Pacific is forecast to grow at a 7.54% CAGR through 2031. China, India, and South Korea are expanding biopharma capacity and laboratory infrastructure. Thermo Fisher Scientific expanded Bioprocess Design Centers in Incheon, Hyderabad, and Singapore during December 2025. China supports automated demand, India supports cost-effective manual demand, and Middle East and Africa and South America are developing markets linked to laboratory capacity and healthcare investment.

Competitive Landscape
The hemocytometer market is moderately fragmented because specialists and large diagnostics corporations compete with different approaches. NanoEntek Inc., Paul Marienfeld GmbH, Glaswarenfabrik Karl Hecht GmbH, Hausser Scientific Co., and Mxrady Lab Solutions focus on chamber geometry, materials, documentation, and disposable formats. Their customers often need validated reference tools or GMP-grade consumables. Sysmex Corporation, Siemens Healthineers AG, Roche Diagnostics, HORIBA Ltd., and Mindray Medical International compete through broader hematology and diagnostic portfolios. The hemocytometer market contains both specialist chamber suppliers and platform-based competitors.
Roche agreed in May 2026 to acquire PathAI for USD 750 million upfront and up to USD 300 million in milestone payments. The planned transaction extends Roche’s image-analysis capability into AI-driven pathology workflows. NanoEntek’s July 2026 EVE HT A26 release shows movement toward automated high-throughput counting. Its disposable chamber offering alongside CDMO-focused platforms serves both consumable and automation-oriented customers. These moves show competition through digital capability, workflow integration, and consumable precision.
Competitive openings include GMP-compliant disposable chambers, digital eyepiece solutions, and point-of-care white blood cell tools. Digital accessories can improve traceability while retaining manual chamber methods. Emerging Asian suppliers compete with cost-effective glass and disposable products in price-sensitive regions. Larger companies have integrated portfolio advantages, while specialists compete through precision and focused development.
Hemocytometer Industry Leaders
Merck KGaA
Hausser Scientific Co.
Thermo Fisher Scientific Inc.
Bio-Rad Laboratories, Inc.
INCYTO Co., Ltd.
- *Disclaimer: Major Players sorted in no particular order
Hemocytometer Market Companies Covered in this Report
- Abbott Laboratories
- Agilent Technologies
- Avantor
- Beckton Dickinson
- Bio-Rad Laboratories
- Danaher
- Glaswarenfabrik Karl Hecht GmbH and Co. KG
- Hausser Scientific Co.
- HemoCue AB
- HORIBA
- Merck
- Mindray
- Mxrady Lab Solutions Private Limited
- NanoEntek, Inc.
- Paul Marienfeld GmbH and Co. KG
- Roche Diagnostics International Ltd
- Siemens Healthineers
- Sysmex
- Thermo Fisher Scientific
- Thomas Scientific
- Unico
- Wuhan Servicebio Technology Co., Ltd.

Recent Industry Developments in Hemocytometer Market
- July 2026: NanoEntek Inc. launched the EVE™ HT A26, a fully automated high-throughput cell counter capable of processing 96 samples in 10 minutes from a 20 µL input. The walkaway system integrates pipetting, dilution, staining, fluorescence and brightfield counting via a 7-axis robotic architecture, with an optional 21 CFR Part 11 configuration. The launch marks NanoEntek's strategic expansion into the global CDMO and CGT manufacturing market, building on existing supply relationships with Samsung Biologics, AstraZeneca, and Johnson & Johnson.
- May 2026: Sysmex America introduced the next-generation XR-Series hematology solution for clinical laboratories, featuring the XR-10 Automated Hematology Module with higher throughput, enhanced analytics, 3D scattergram visualization, and a new WBC differential reagent. The XR-9000 configuration targets high-volume laboratories and builds on the established XN-Series platform, signaling Sysmex's continued investment in precision hematology automation.
- May 2026: Roche entered into a definitive merger agreement to acquire PathAI, a US-based AI-powered digital pathology company, for USD 750 million upfront and up to USD 300 million in milestone payments. The acquisition, expected to close in the second half of 2026, extends Roche Diagnostics' image-analysis capabilities into AI-driven companion diagnostics and fully automated slide-review workflows.
- December 2025: Thermo Fisher Scientific expanded its Bioprocess Design Center network across Asia-Pacific, launching a new center in Hyderabad, India, and expanding existing centers in Incheon, South Korea, and Singapore. The network supports biopharma customers with bench-to-pilot bioprocessing, single-use system integration, and collaboration for biologics, vaccines, and cell and gene therapy manufacturing.


Global Hemocytometer Market Report Scope
According to the report’s scope, a hemocytometer is a specialized glass slide used to manually count blood cells or other microscopic particles in a sample under a microscope. It provides an accurate measurement of cell concentration in a given volume.
The hemocytometer market is segmented into product, chamber material, application, end user, and geography. By product, the market is segmented into automated hemocytometer and manual hemocytometer. By chamber material, the market is segmented into glass, plastic and polymer, and composite materials. By application, the market is segmented into blood cell counting, cell viability assessment, and other applications. By end user, the market is segmented into diagnostic laboratories, hospitals and clinics, pharmaceutical & biotechnological companies, contract development and manufacturing organizations, and other end-users. By geography, the market is segmented into North America, Europe, Asia-Pacific, the Middle East and Africa, and South America. The report also covers the estimated market sizes and trends for 17 countries across major regions globally. The report offers values (USD) for all the above segments.
| Automated Hemocytometer |
| Manual Hemocytometer |
| Glass |
| Plastic and Polymer |
| Composite Materials |
| Blood Cell Counting |
| Cell Viability Assessment |
| Other Applications |
| Diagnostic Laboratories |
| Hospitals and Clinics |
| Pharmaceutical & Biotechnological Companies |
| Contract Development and Manufacturing Organizations |
| Other End-Users |
| North America | United States |
| Canada | |
| Mexico | |
| Europe | Germany |
| United Kingdom | |
| France | |
| Italy | |
| Spain | |
| Rest of Europe | |
| Asia-Pacific | China |
| Japan | |
| India | |
| Australia | |
| South Korea | |
| Rest of Asia-Pacific | |
| Middle East and Africa | GCC |
| South Africa | |
| Rest of Middle East and Africa | |
| South America | Brazil |
| Argentina | |
| Rest of South America |
| By Product | Automated Hemocytometer | |
| Manual Hemocytometer | ||
| By Chamber Material | Glass | |
| Plastic and Polymer | ||
| Composite Materials | ||
| By Application | Blood Cell Counting | |
| Cell Viability Assessment | ||
| Other Applications | ||
| By End User | Diagnostic Laboratories | |
| Hospitals and Clinics | ||
| Pharmaceutical & Biotechnological Companies | ||
| Contract Development and Manufacturing Organizations | ||
| Other End-Users | ||
| Geography | North America | United States |
| Canada | ||
| Mexico | ||
| Europe | Germany | |
| United Kingdom | ||
| France | ||
| Italy | ||
| Spain | ||
| Rest of Europe | ||
| Asia-Pacific | China | |
| Japan | ||
| India | ||
| Australia | ||
| South Korea | ||
| Rest of Asia-Pacific | ||
| Middle East and Africa | GCC | |
| South Africa | ||
| Rest of Middle East and Africa | ||
| South America | Brazil | |
| Argentina | ||
| Rest of South America | ||


Key Questions Answered in the Report
What is the forecast value of hemocytometers market in 2031?
The Hemocytometer Market size is projected to be USD 461.60 million in 2025, USD 491.79 million in 2026, and reach USD 675.06 million by 2031, growing at a CAGR of 6.54% from 2026 to 2031.
Which hemocytometer product category leads revenue?
Manual hemocytometers held 57.65% revenue share in 2025, supported by their installed base and low infrastructure needs.
Which hemocytometer application is growing fastest?
Cell viability assessment is forecast to grow at a 9.32% CAGR through 2031 as bioreactor-based workflows expand.
Why are disposable hemocytometers gaining use?
Disposable polymer chambers can reduce cleaning needs and support contamination control in sensitive laboratory workflows.
Which region is growing fastest for hemocytometers?
Asia-Pacific is forecast to grow at a 7.54% CAGR through 2031, supported by biopharma and laboratory infrastructure expansion.
Can hemocytometers remain useful alongside automated counters?
Yes. Direct microscopy remains useful for visual verification, low-volume work, and samples with debris, clumps, or unusual morphology.
Page last updated on:





