
Healthcare Biometrics Market Size and Share
Market Overview
| Study Period | 2020 - 2031 |
|---|---|
| Market Size (2026) | USD 14.67 Billion |
| Market Size (2031) | USD 37.63 Billion |
| Growth Rate (2026 - 2031) | 20.74% CAGR |
| Fastest Growing Market | Asia Pacific |
| Largest Market | North America |
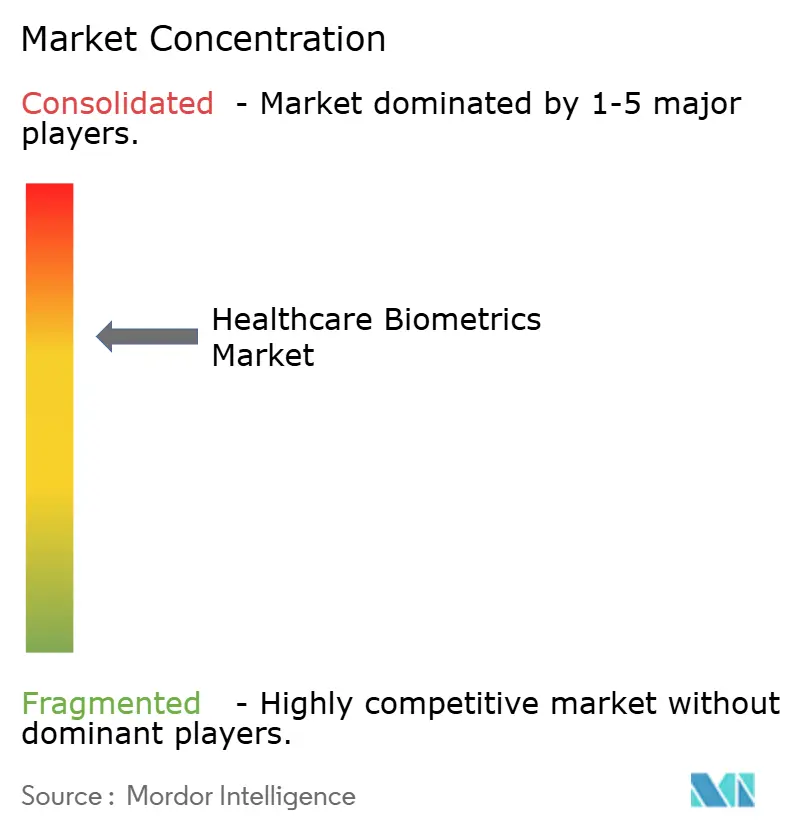
| Market Concentration | Medium |
Major Players *Disclaimer: Major Players sorted in no particular order Image © Mordor Intelligence. Reuse requires attribution under CC BY 4.0. | |
Healthcare Biometrics Market Analysis by Mordor Intelligence
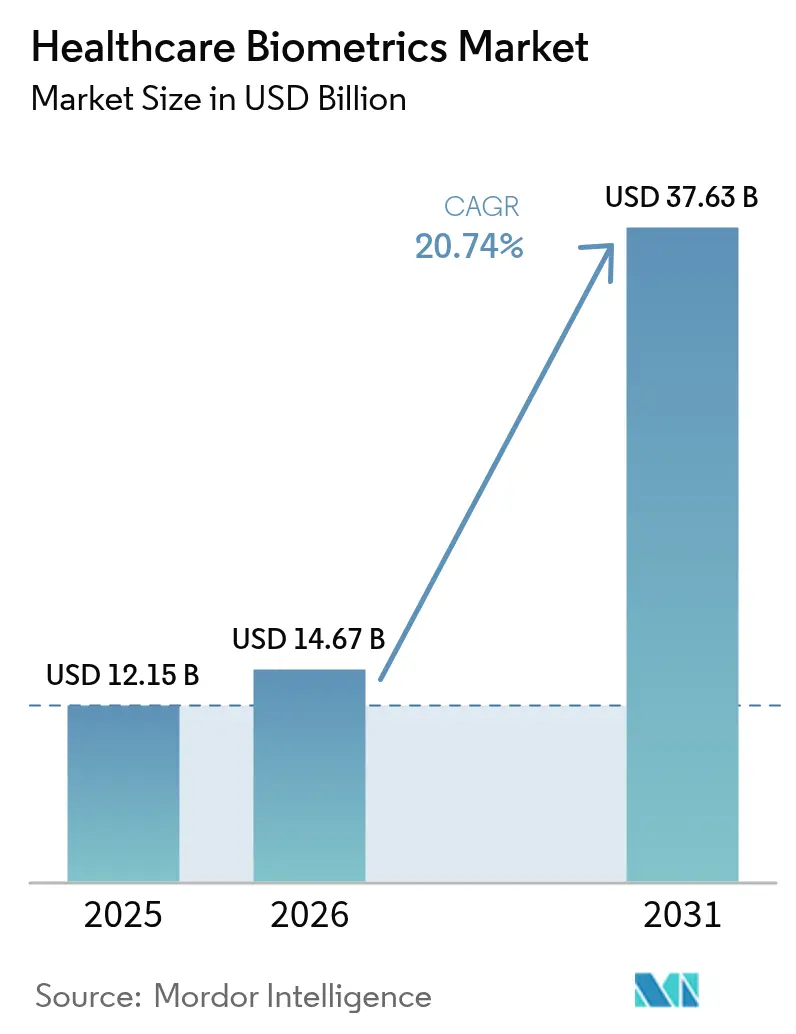
The Healthcare Biometrics Market size is expected to grow from USD 12.15 billion in 2025 to USD 14.67 billion in 2026 and is forecast to reach USD 37.63 billion by 2031 at 20.74% CAGR over 2026-2031.
The sharp rise is fuelled by digital-health mandates, expanding electronic health record (EHR) ecosystems, and a record wave of data breaches that exposed more than 100 million patient files in 2024 TechCrunch. Mounting medical-identity fraud, government e-ID programs, and the need for password-free clinical workflows now position biometric authentication as critical infrastructure rather than an optional add-on. Hardware still accounts for the majority of spending, yet services register the fastest growth as providers prioritise integration expertise. Asia-Pacific’s 25.13% CAGR reflects large-scale public-sector projects, while North America sustains leadership through stringent privacy laws and mature hospital IT estates.
Key Report Takeaways
- By technology, single-factor authentication led with 36.74% revenue share of the healthcare biometrics market in 2025, whereas multimodal systems are projected to expand at a 23.92% CAGR to 2031.
- By component, hardware held 51.44% of the healthcare biometrics market size in 2025; professional and managed services, however, are set to grow at 22.18% CAGR through 2031.
- By application, patient identification retained 32.12% share of the healthcare biometrics market in 2025, while tele-health onboarding is forecast to grow at 26.14% CAGR.
- By end user, hospitals and clinics commanded 41.96% share in 2025; home-care and aged-care facilities show the highest 23.02% CAGR.
- By geography, North America held 36.25% of the healthcare biometrics market share in 2025, and Asia-Pacific is on track for the fastest 24.02% CAGR to 2031.
Note: Market size and forecast figures in this report are generated using Mordor Intelligence’s proprietary estimation framework, updated with the latest available data and insights as of 2026.
Global Healthcare Biometrics Market Trends and Insights
Drivers Impact Analysis*
| Driver | (~) % Impact on CAGR Forecast | Geographic Relevance | Impact Timeline |
|---|---|---|---|
| Government E-ID & EHR Mandates | +4.2% | Global; early roll-outs in Estonia, India, Japan | Medium term (2-4 years) |
| Escalating Medical Identity Theft & Data Breaches | +3.8% | North America, EU; spreading worldwide | Short term (≤ 2 years) |
| Rapid EHR Adoption Driving Secure Log-In Demand | +3.1% | Global; accelerated in Asia-Pacific | Medium term (2-4 years) |
| Tele-Health Identity Onboarding Surge | +2.9% | Global; heightened in rural regions | Short term (≤ 2 years) |
| Biometric Wearables for Smart-Hospital IoT | +2.4% | North America, EU; Asia-Pacific following | Long term (≥ 4 years) |
| AI-Powered Multimodal Accuracy Breakthroughs | +2.1% | Global technology hubs | Long term (≥ 4 years) |
| Source: Mordor Intelligence | |||
Government E-ID & EHR Mandates
National digital-identity programs are making biometric verification obligatory in healthcare. Japan’s “My Number” insurance cards reached 92.5% provider uptake by December 2024, linking 81 million citizens to facial-recognition terminals. India’s Ayushman Bharat Digital Mission enrolled more than 650 million biometric health accounts, simplifying remote registration and record access. Estonia extends the model by embedding AI-driven identity checks across its e-services stack. In the United States, 21st-Century Cures Act compliance pressures hospitals to replace password log-ins with stronger factors, accelerating uptake of biometric single-sign-on. Collectively, these measures ensure enduring demand across economic cycles.
Escalating Medical Identity Theft & Data Breaches
The Change Healthcare ransomware attack compromised over 100 million American records in 2024, the worst breach on record. Subsequent incidents at Kaiser Permanente and other networks illustrate the sector’s vulnerability to both cybercrime and unauthorised data-sharing. The National Health Care Anti-Fraud Association pegs annual fraud at USD 68 billion, much of it rooted in misidentification. Pew Charitable Trusts calculates that matching errors alone cost the system USD 6 billion annually.[1]Pew Charitable Trusts, “Enhancing Patient Matching to Improve Health Outcomes,” pewtrusts.org These financial exposures are moving biometrics from discretionary spend to board-level priority.
Rapid EHR Adoption Driving Secure Log-In Demand
Clinicians frequently authenticate—up to 80 times per shift—creating workflow friction that biometrics remove. Imprivata’s HIPAA-compliant facial authentication for Epic reduces log-in time while meeting audit requirements.[2]Imprivata Inc., “Facial Recognition for Epic: Technical White Paper,” imprivata.com Wearable sensors such as BioIntelliSense’s BioButton stream 1,440 readings daily, necessitating seamless staff access without shared passwords. EHR vendors now build biometric APIs natively, lowering integration hurdles and broadening adoption across ambulatory and acute-care settings.
Tele-Health Identity Onboarding Surge
Remote consultations exceed pre-pandemic volumes, with video platforms integrating voice, face, and liveness checks. DEA guidance obliges controlled-substance prescriptions to adopt robust patient verification, favouring biometrics. Solutions such as VerifiNow’s PatientVerifi combine multiple modalities to meet HIPAA and insurance-fraud requirements. Rising remote-patient-monitoring enrolment, approaching 50 million Americans, further extends biometric demand beyond hospital walls.
Restraints Impact Analysis*
| Restraint | (~) % Impact on CAGR Forecast | Geographic Relevance | Impact Timeline |
|---|---|---|---|
| High Device & Integration Costs | −2.8% | Global; acute for small providers | Short term (≤ 2 years) |
| Privacy & Regulatory Compliance Hurdles | −2.1% | EU, North America; widening worldwide | Medium term (2-4 years) |
| Algorithmic Bias Litigation Risk | −1.6% | North America, EU; affecting Asia-Pacific | Medium term (2-4 years) |
| EHR–Biometric API Interoperability Gaps | −1.3% | Global; pronounced in fragmented systems | Short term (≤ 2 years) |
| Source: Mordor Intelligence | |||
High Device & Integration Costs
Capital outlays for scanners, servers, and on-site support remain substantial. Smaller practices lack the transaction volume to amortise systems quickly, slowing roll-outs even as return-on-investment models improve. Complex interfacing with legacy health-information systems demands specialist integrators and hikes implementation spend. While cloud-hosted biometric-as-a-service (BaaS) eases some hardware needs, premium subscriptions can strain tight budgets until economies of scale arrive.
Privacy & Regulatory Compliance Hurdles
Illinois’ Biometric Information Privacy Act (BIPA) has spawned a surge in class-action filings, raising corporate liability fears. Europe’s Health Data Space and Colorado’s forthcoming AI Act mandate risk assessments for automated decision-making tools, including biometric engines. Providers must budget for privacy-impact analyses, ongoing audits, and data-localisation measures, lengthening procurement cycles and elevating cost of compliance.
*Our forecasts treat driver/restraint impacts as directional, not additive. The impact forecasts reflect baseline growth, mix effects, and variable interactions.
Segment Analysis
By Technology: Multimodal Systems Drive Innovation
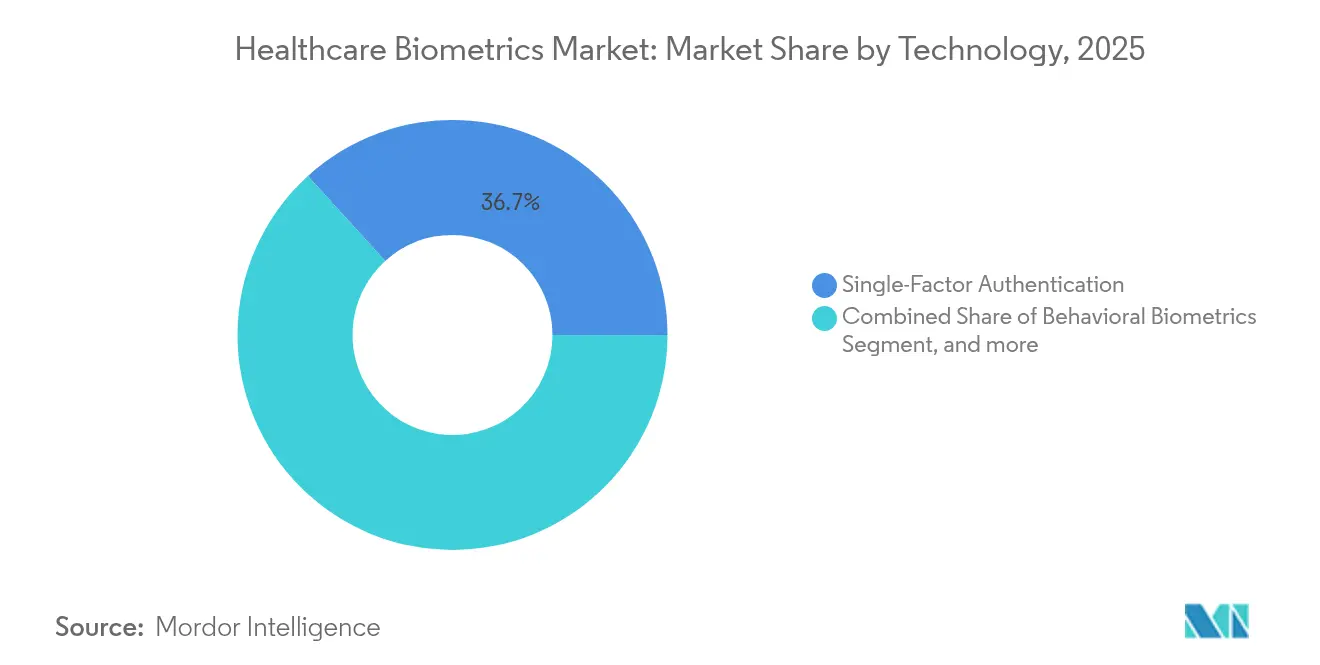
Single-factor authentication held the largest revenue share of 36.74% in 2025, courtesy of mature, cost-effective scanners entrenched in hospital admissions. Nevertheless, multimodal engines are scaling fastest on a 23.92% CAGR as accuracy, spoof resistance, and fail-over capability become strategic purchase criteria across the healthcare biometrics market. NEC’s facial-matching system for personalised cancer vaccines exemplifies how multimodal design supports precision medicine workflows.Behavioural biometrics, tracking keystroke cadence and pointer dynamics, is entering EHRs as a background safeguard. Meanwhile, iris and vein recognition gain traction in sterile environments where contact-free operation is vital. Foundation-model breakthroughs lowering false-reject rates are likely to propel multimodal options toward parity with fingerprints by decade-end.
Vendors now sell frameworks that orchestrate face, voice, iris, and behavioural signals in a single software development kit, reducing integration overheads. Hospitals cite a 40% drop in access-card loss incidents post-deployment, freeing operational budgets for patient-centric digital projects. Yet fingerprint systems still appeal to budget-constrained facilities because of inexpensive sensors and wide clinician familiarity.



By Component: Services Accelerate Implementation
Hardware commanded 51.44% of 2025 revenue as facilities upgraded entry kiosks, point-of-care devices, and mobile readers. Over the forecast horizon, professional and managed services outpace equipment at 22.18% CAGR by bundling consulting, workflow mapping, and regulatory assurance into fixed-fee packages. SailPoint’s purchase of Imprivata’s identity-governance line signals the growing premium on healthcare-specific domain knowledge.
Integration complexity remains a critical selling point. Providers allocate 40–60% of total biometric budgets to services that align authentication with clinical-care pathways, ensure HL7/FHIR compatibility, and maintain audit trails. Managed offerings deliver round-the-clock monitoring, automatic algorithm updates, and quarterly bias testing, relieving hospital IT teams that face cybersecurity staffing gaps.
By Application: Remote Care Transforms Demand
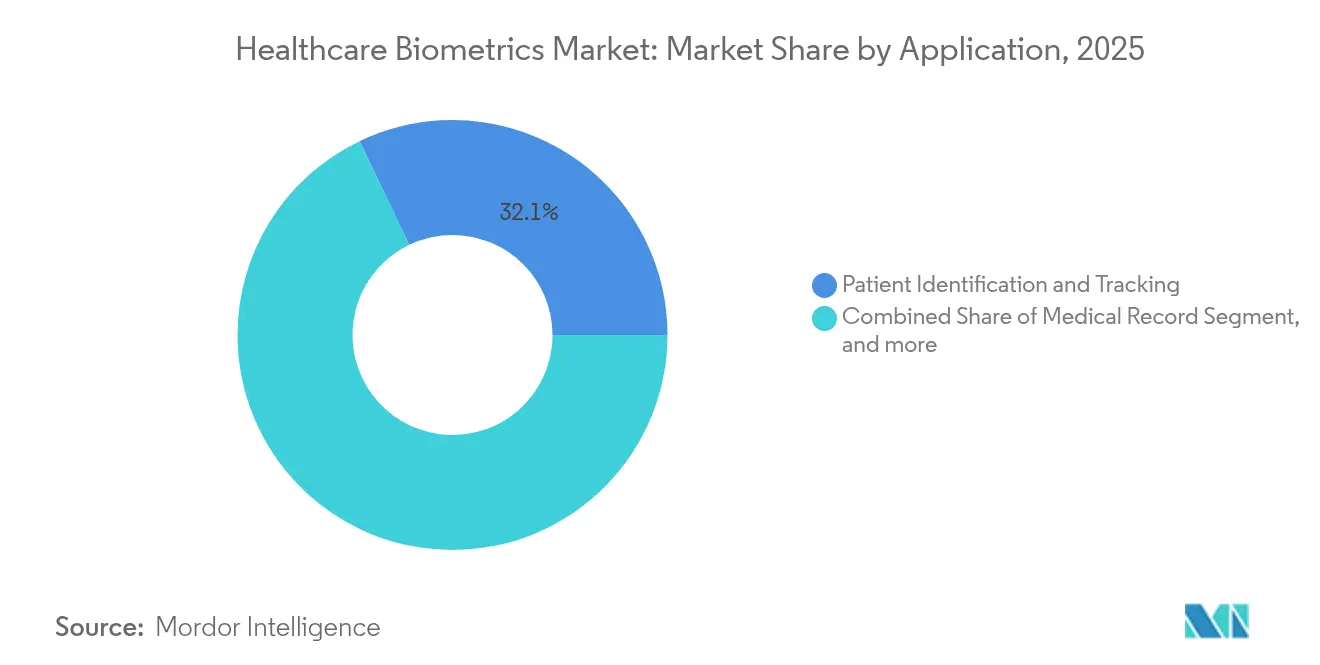
Patient-identification solutions kept 32.12% revenue share in 2025, reflecting their status as foundational controls across admission desks, laboratories, and pharmacies within the healthcare biometrics market. However, tele-health onboarding, remote monitoring, and at-home care collectively register the highest 26.14% CAGR, boosted by DEA rules for e-prescribing and payer directives combating fraudulent teleconsult claims. The healthcare biometrics market share for remote-care authentication is expected to approach 17.58% by 2031 as wider broadband coverage ushers new patient cohorts online.
Emerging use cases merge authentication with therapeutic functions. Biometric wearables match patient identity to continuous-glucose readings, ensuring clinicians treat the correct individual while automating compliance documentation. Controlled-substance cabinets in nursing homes increasingly rely on palm-vein scanners that pair staff credentials with dosage tracking, cutting diversion incidents. As home-care models scale, low-friction biometric onboarding stands out as an indispensable safeguard.
By End User: Home Care Drives Growth
Hospitals and clinics remained the core buyers at 41.96% share in 2025, yet home-care and aged-care facilities chart a 23.02% CAGR that will narrow the gap. Demographic ageing, post-acute reimbursement changes, and consumer preference for residence-based services fuel this shift within the healthcare biometrics market. Senior-living providers install facial-recognition door locks tied to fall-detection cameras, enhancing resident safety while easing staff workload.
Diagnostic laboratories and pharmaceutical research centres follow close behind, adopting high-security multimodal gates to shield genomic datasets. Insurers and government payers experiment with voice biometrics on customer-service lines to stem identity-related fraud. Telemedicine companies, often cloud-native, use biometric plug-ins to deliver zero-trust security without burdening general-practice physicians with complex hardware deployments.
Geography Analysis
North America led the healthcare biometrics market in 2025 with 36.25% revenue share, propelled by stringent HIPAA enforcement, BIPA litigation risk, and rapid EHR penetration. Hospitals report ROI windows as short as 22 months when factoring breach-related cost avoidance and workflow efficiencies. Federal agencies are piloting multimodal kiosks for veteran-care enrolment, broadening procurement pools.
Europe follows with robust public-sector incentives. The European Health Data Space earmarks EUR 810 (USD 941) million for cross-border data infrastructure, much of which requires biometric controls to meet the General Data Protection Regulation’s privacy-by-design clause. Scandinavian health systems already embed facial verification in patient portals, clocking 88% user-satisfaction scores for password-less log-ins.
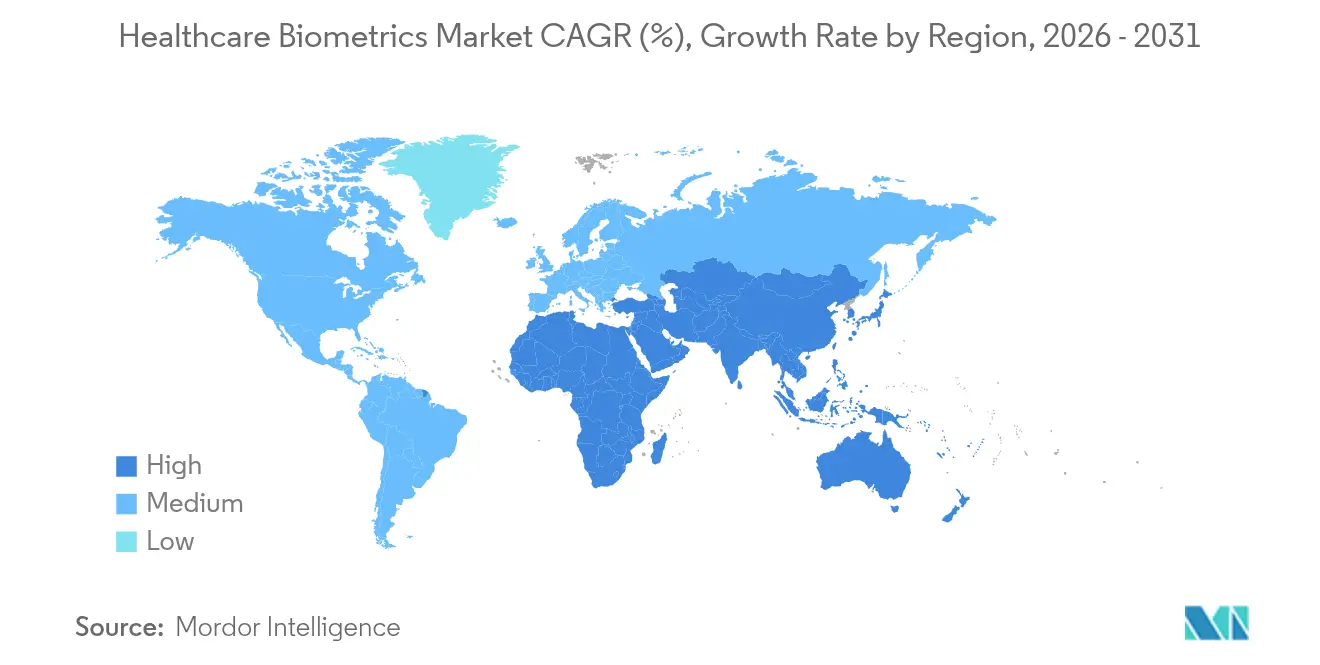
Asia-Pacific is the fastest mover. India’s Ayushman Bharat now issues roughly 1 million biometric IDs daily, illustrating the scale at which the region is leapfrogging card-based systems. Japan’s roll-out of My Number insurance cards brings contactless face authentication to primary-care clinics nationwide. China, meanwhile, deploys hospital facial-payment lanes that shorten pharmacy queues by 30% and lower cash-handling costs. These advances underpin a 24.02% CAGR that will lift Asia-Pacific close to North American revenue levels by 2031.
Latin America, the Middle East, and Africa are entering a formative phase. Pilot projects in Brazil and the United Arab Emirates tie biometric ID to vaccination records, indicating early but firm commitment. Funding constraints and infrastructure gaps temper near-term volumes, yet multilateral health-digitisation grants are expected to accelerate adoption through the second half of the decade

Regulatory Landscape
Regulation in healthcare biometrics increasingly reflects privacy, cybersecurity, and AI governance requirements that shape how biometric identifiers are captured, stored, and used in clinical workflows. In the United States, HIPAA security and identity-verification expectations influence procurement for access control to ePHI, while technical and interoperability alignment is reinforced through standards referenced in federal use cases.
Standards and AI governance are tightening implementation requirements. In March 2026, NIST published NIST SP 500-290e4 (ANSI/NIST-ITL 1-2025), updating the biometric data interchange standard covering fingerprint, facial, and other modalities, which supports cross-system data consistency for deployments spanning hospitals, payers, and national programs. In Europe, the EU AI Act (Regulation (EU) 2024/1689) adds compliance obligations for high-risk AI in healthcare, including data governance, human oversight, and post-market monitoring, while restricting certain biometric categorization practices. This raises the bar for bias controls and documented lifecycle management in biometric engines used in care delivery and identity onboarding.
Competitive Landscape
The majority of healthcare biometrics are manufactured by global key players. Joint ventures and collaborations amongst the players can be expected in the forecast period. The healthcare biometrics market remains moderately fragmented, although consolidation is gaining momentum. First Advantage’s USD 2.2 billion acquisition of Sterling Check Corp and IN Groupe’s planned purchase of IDEMIA Smart Identity reflect strategic moves to absorb specialised algorithms and established healthcare client bases. The top five vendors collectively hold a significant share of the global revenue, leaving room for regional specialists to thrive.
Technology competition hinges on accuracy and bias mitigation. Vendors boasting sub-1% % false-accept rates in mixed-ethnicity datasets secure preferred supplier status in public tenders. NEC’s facial-recognition engine tailored for genomic cancer vaccines exemplifies deep vertical integration that can lock out generic rivals. Cloud-native entrants, unfettered by legacy hardware lines, price aggressively on per-transaction models and entice small providers that lack capital budgets.
Product roadmaps converge on AI-driven multimodal orchestration, self-service enrolment, and real-time risk scoring. Partnerships between cybersecurity firms and medical-device manufacturers are emerging as hospitals seek end-to-end zero-trust environments that combine endpoint telemetry with biometric identity. Regional regulations, however, can fragment offerings; EU providers, for instance, demand on-premise hosting that favours incumbents with data-center footprints inside the bloc.
Healthcare Biometrics Industry Leaders
Thales Group
Bio-Key International Inc
Fujitsu Limited
Imprivata Inc
NEC Corporation
- *Disclaimer: Major Players sorted in no particular order

Market Opportunities and Future Outlook
A gap is emerging for standards-aligned identity assurance that works across organizations, rather than within a single provider. In the United States, TEFCA is pushing FHIR-based exchange at scale, with QTF Version 2.0 released in April 2024 and a QTF Version 2.1 draft circulated in December 2025. That shift increases demand for stronger patient identity resolution and clinician authentication that can travel with the transaction.
The opportunity also concentrates on security hardening and fraud reduction, where biometrics can be paired with anti-spoofing and device assurance instead of being positioned as a stand-alone scanner. Presentation Attack Detection (ISO/IEC 30107) and certified biometric subsystems (FIDO Alliance biometric component certification) offer a clearer procurement path for health systems and digital-health platforms pursuing passwordless sign-in and remote onboarding with defensible security controls. With major breaches and misidentification costs keeping identity risk on operational agendas, vendors that combine multimodal authentication with auditability and interoperability into EHR and exchange standards can support both in-facility access and tele-health onboarding at scale.
Recent Industry Developments
- June 2026: Thales announced the deployment of the Thales OneWelcome Identity Platform by Availity to modernize identity infrastructure for its US health information network. The deployment focuses on consolidating identity and access management for high-volume healthcare transactions, reinforcing demand for centralized, passwordless-ready identity services across payer and provider ecosystems.
- March 2026: Imprivata introduced advanced access management and passwordless authentication capabilities aimed at UK NHS organizations, aligning with NHS cyber security and compliance requirements. The release supports tighter clinical access governance and advances modernization of clinician authentication beyond passwords in large public-health environments.
- April 2024: The Office of the National Coordinator for Health IT advanced TEFCA implementation through the Qualified Health Information Network Technical Framework (QTF) Version 2.0, reinforcing FHIR-based exchange requirements. This increases the importance of scalable identity resolution and authentication that integrates into standardized API workflows across organizations, supporting broader adoption of biometrics for patient matching and secure access.


Research Methodology Framework and Report Scope
Market Definition and Coverage
The healthcare biometrics market covers revenue from biometric tools used by healthcare organizations to identify or authenticate people and devices, across workflows like patient registration, EHR access, staff sign-in, and remote care.
Scope exclusions: We exclude stand-alone physical-access locks sold mainly for non-clinical commercial buildings.
Segmentation Overview
- By Technology
- Single-factor Authentication
- Fingerprint Recognition
- Facial Recognition
- Iris Recognition
- Vein/Palm Recognition
- Behavioral Biometrics
- Multi-factor Authentication
- Multimodal Biometrics
- Biometric-as-a-Service (BaaS)
- Single-factor Authentication
- By Component
- Hardware
- Software
- Services
- By Application
- Patient Identification & Tracking
- Medical Record / Data-Centre Security
- Care-provider Authentication
- Tele-Health & Remote Onboarding
- Pharmacy & Controlled-Substance Dispensing
- Home / Remote Patient Monitoring
- By End User
- Hospitals & Clinics
- Diagnostic & Research Laboratories
- Insurance & Payers
- Home Care & Aged Care Facilities
- Pharma & Life Science Companies
- By Geography
- North America
- United States
- Canada
- Mexico
- Europe
- Germany
- United Kingdom
- France
- Italy
- Spain
- Rest of Europe
- Asia-Pacific
- China
- Japan
- India
- Australia
- South Korea
- Rest of Asia-Pacific
- Middle East & Africa
- GCC
- South Africa
- Rest of Middle East & Africa
- South America
- Brazil
- Argentina
- Rest of South America
- North America
Data Sources, Market Sizing, and Validation
Desk Research
Desk research is used to anchor the model to real healthcare activity and digital identity adoption, then the assumptions are tuned through interviews. We typically start from public health system and facility indicators, and then align those signals with biometrics demand patterns seen in real deployments.
Common public references include sources such as the World Health Organization, the World Bank, the US FDA (device and software related notices where relevant), the US Office of the National Coordinator for Health IT for EHR adoption context, and NIST guidance for biometric performance and testing terminology. We also review company filings, investor presentations, association websites, and reputed press, and we supplement this with paid subscriptions for company financials and intelligence, news and financials, patent databases, and import or export shipment-level databases when hardware shipment trends are needed. These examples are illustrative only, and we reviewed additional sources to collect data, validate assumptions, and clarify points that were unclear from public material alone.
Primary Interviews and Surveys
Primary work is used to pressure-test adoption rates, budget patterns, and pricing logic across the main buying groups, so gaps left by public data do not silently flow into the totals. We spoke with solution providers, system integrators, and hospital and clinic IT and security teams, along with digital health stakeholders, and we balanced coverage across major regions to reflect different regulatory and procurement realities.
Distribution of primary research fieldwork respondents
| Company type | Respondent position | Region |
|---|---|---|
| Top tier: 29% | CXOs: 16% | APAC: 50% |
| Mid tier: 49% | Functional/Unit leaders: 24% | EMEA: 29% |
| Smaller Players: 22% | Managers: 60% | Americas: 21% |
Market-Sizing & Forecasting
Sizing is built using a top-down and bottom-up flow, where healthcare activity and digital identity penetration are used to reconstruct the demand pool, and then cross-checked against supplier-side realities. The top-down core starts with addressable sites and users (for example, hospitals, clinics, and enrolled patients) and applies adoption rates for biometric use cases, then converts volumes into spending using typical unit counts and blended pricing.
To keep the model grounded, we also run selective bottom-up approximations, such as sampled average selling price times shipment volumes for key device categories, and channel checks on software and services attach rates, which are used to adjust outliers. Inputs that matter in this market include EHR and patient portal adoption, patient registration volumes, staff credentialing cycles, the split between single-modal and multimodal deployments, typical device replacement timing, and services intensity for integration and ongoing management. Forecasts are developed using scenario analysis, where variables like regulatory push for patient identity, cybersecurity posture, and care delivery shifts to remote or hybrid settings are stress-tested, and the final trajectory is aligned to what practitioners expect to be practical over the forecast period. When bottom-up visibility is thin in smaller countries, we use proxy indicators (healthcare spend and facility density) and then re-check the implied per-site spending with interview feedback.
Data Validation & Update Cycle
Validation is done by triangulating the model output against independent signals, so one data stream does not dominate the result. We check for anomalies like unrealistic per-facility spending, sudden pricing jumps that are not supported by product mix, and region shares that do not match observed healthcare digitization levels, then revise the assumptions where needed.
Before sign-off, the work is reviewed in multiple steps, including peer checks on formulas, unit logic, and currency conversion timing. If large variances show up versus external indicators or new developments emerge, we re-contact selected experts to re-test the specific inputs that moved. The report is refreshed annually, with interim updates for material events, and a final pre-delivery pass is completed so clients receive the latest view.
Mordor Intelligence's Healthcare Biometrics Market Size Compared Against Other Published Estimates
Different published market sizes can look far apart because the underlying scope and counting rules are not the same, even when the title sounds identical. The biggest drivers are usually what is included as healthcare biometrics, the starting year used in the model, and how pricing and adoption are assumed to move over time.
The main gap comes from whether studies count only biometric devices or also include software and managed services tied to healthcare identity workflows. Mordor Intelligence counts the full bundle only when it is used for healthcare identification and authentication across clinical or administrative use cases, not general building access. Differences also show up when some estimates lean on aggressive penetration assumptions for hospitals and remote care, or when currency conversion timing and inflation treatment are not clearly stated, which can shift the same demand signal into a higher or lower USD value.
Benchmark comparison
| Source | Market Size | Gaps in Research Methodology |
|---|---|---|
| Mordor Intelligence | USD 14.67 B (2026) | |
| Global Consultancy A | USD 11.67 B (2024) | Uses an earlier base year and can undercount services-heavy deployments when totals are built mainly from device shipments and a limited set of clinical settings. |
| Industry Publisher B | USD 40.40 B (2034) | Uses a longer forecast window where adoption is often compounded with broad spending multipliers, and service and software uplift can be applied without tight checks against healthcare site and user volumes. |
The comparison mainly reflects scope and timing, not a simple disagreement on demand direction. When inputs are tied back to clear healthcare workflow volumes, adoption gates, and blended pricing checks, the resulting number stays easier to explain and to reproduce year after year.


Key Questions Answered in the Report
What is the current size of the healthcare biometrics market?
The market is valued at USD 14.67 billion in 2026 and is projected to reach USD 37.63 billion by 2031.
Which biometric technology dominates healthcare today?
Single-factor authentication still leads with 36.74% revenue share, although multimodal platforms are growing fastest at 23.92% CAGR.
What drives rapid growth in Asia-Pacific?
Government digital-identity programs such as India’s Ayushman Bharat and Japan’s My Number card system underpin a 24.02% regional CAGR.
Why are services outpacing hardware sales?
Providers increasingly outsource integration, regulatory assurance, and ongoing bias testing, yielding a 22.18% CAGR for services through 2031.
How are privacy regulations affecting adoption?
Laws like Europe’s Health Data Space and Illinois’ BIPA add compliance costs and litigation risk, moderating growth by an estimated −2.1% on overall CAGR.
Are biometrics used beyond patient identification?
Yes, applications now include clinician single-sign-on, controlled-substance dispensing, and secure remote monitoring in home-care settings.
Page last updated on:






