
Wireless Occupancy Sensors Market Size and Share
Market Overview
| Study Period | 2020 - 2031 |
|---|---|
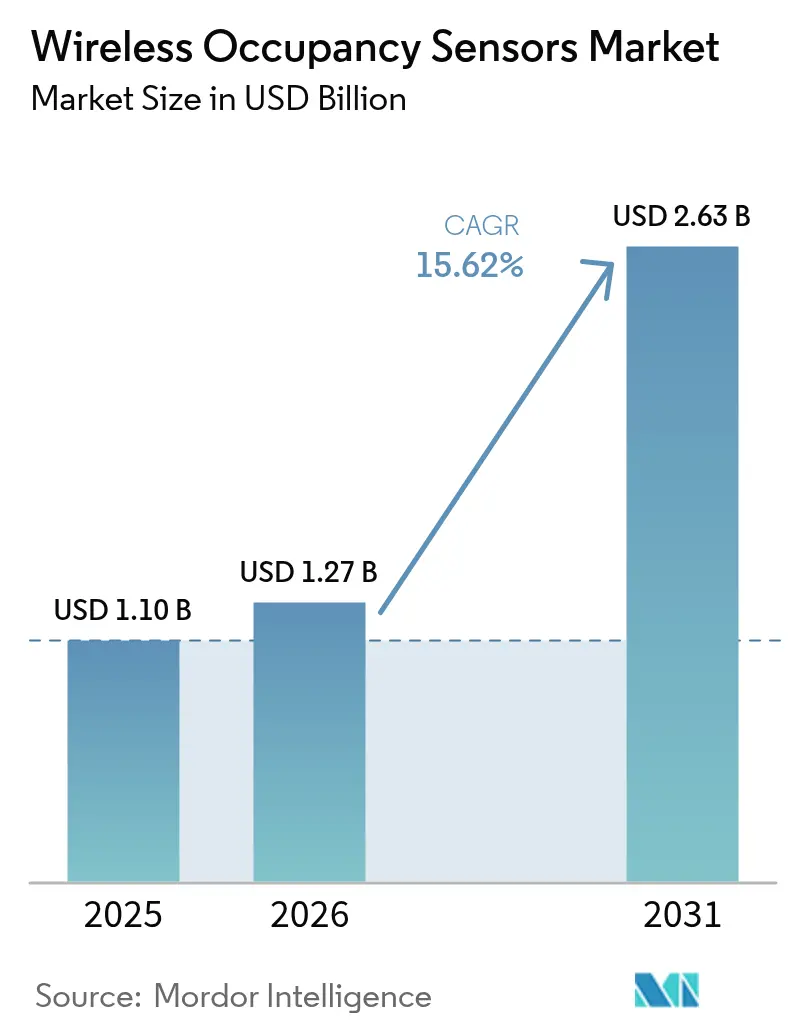
| Market Size (2026) | USD 1.27 Billion |
| Market Size (2031) | USD 2.63 Billion |
| Growth Rate (2026 - 2031) | 15.62 % |
| Fastest Growing Market | Asia Pacific |
| Largest Market | North America |
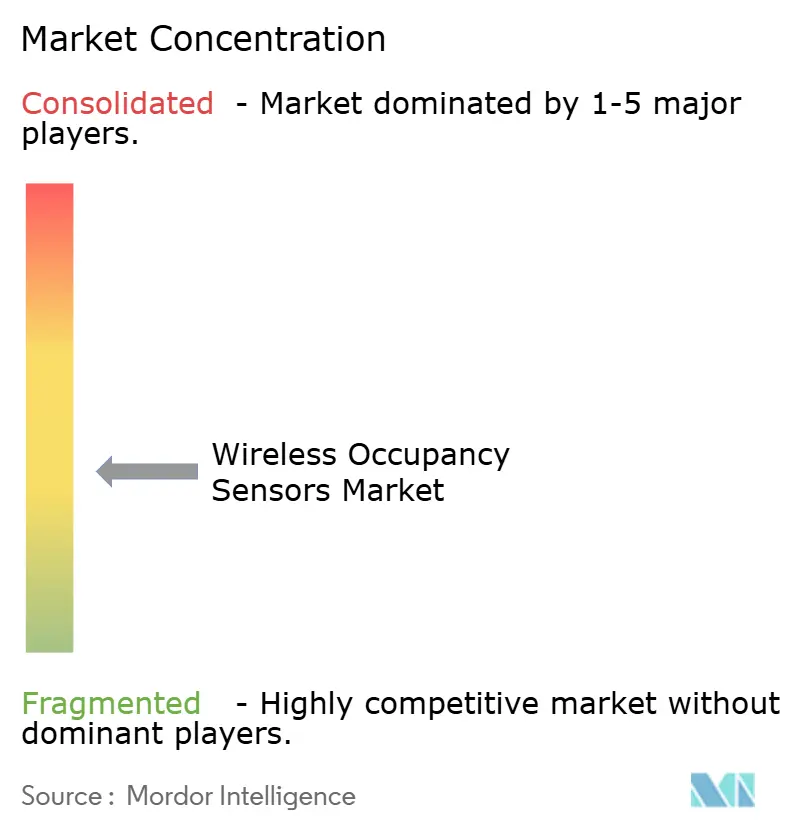
| Market Concentration | Medium |
Major Players *Disclaimer: Major Players sorted in no particular order Image © Mordor Intelligence. Reuse requires attribution under CC BY 4.0. | |
Wireless Occupancy Sensors Market Analysis by Mordor Intelligence
The wireless occupancy sensors market size is expected to grow from USD 1.1 billion in 2025 to USD 1.27 billion in 2026 and is forecast to reach USD 2.63 billion by 2031 at 15.62% CAGR over 2026-2031. Surging investment in smart-building platforms, tightening energy-efficiency regulations, and rapid advances in battery-free energy-harvesting designs are the primary engines behind this momentum. Vendors are embedding AI-enabled sensor-fusion algorithms that cut false triggers and raise detection accuracy, while building owners value the reduced maintenance that kinetic, solar, and thermal harvesters provide. Competition is intensifying as lighting majors buy specialist sensor makers to gain data-interoperability advantages, and regional growth profiles mirror regulatory rigor—North America benefits from ASHRAE 90.1-2019 and California Title 24 requirements, whereas Asia-Pacific leverages China’s intelligent-building mandate and Japan’s energy-efficient IoT programs. These converging factors are creating a robust pipeline of retrofit and greenfield projects that will keep the wireless occupancy sensors market on a double-digit growth path through the decade.
Key Report Takeaways
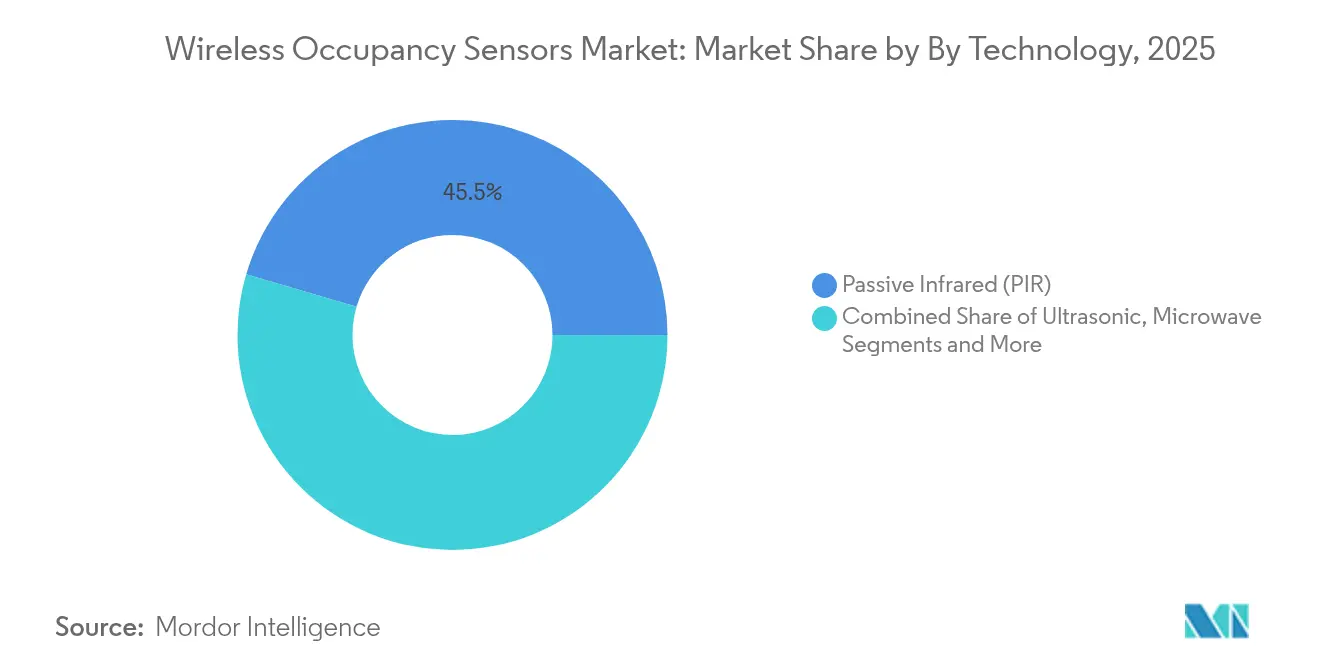
- By technology, Passive Infrared captured 45.45% of wireless occupancy sensors market share in 2025, while Dual Tech solutions are projected to expand at a 20.08% CAGR through 2031.
- By application, Lighting Control led with 58.42% revenue share in 2025; HVAC & Ventilation is forecast to grow at a 18.74% CAGR.
- By building type, Commercial buildings accounted for 53.28% of the wireless occupancy sensors market size in 2025; Healthcare facilities are poised to rise at an 17.86% CAGR.
- By geography, North America commanded 34.78% of wireless occupancy sensors market share in 2025, whereas Asia-Pacific is set to register a 17.32% CAGR through 2031.
Note: Market size and forecast figures in this report are generated using Mordor Intelligence’s proprietary estimation framework, updated with the latest available data and insights as of 2026.
Global Wireless Occupancy Sensors Market Trends and Insights
Drivers Impact Analysis*
| DRIVER | (~) % IMPACT ON CAGR FORECAST | GEOGRAPHIC RELEVANCE | IMPACT TIMELINE |
|---|---|---|---|
| Stringent energy-efficiency mandates | +3.2% | Global, early gains in North America & EU | Medium term (2-4 years) |
| Rapid smart-building & IoT adoption | +4.1% | APAC core, spill-over to North America | Short term (≤ 2 years) |
| Battery-free energy-harvesting sensors | +2.8% | Global, concentrated in commercial sectors | Long term (≥ 4 years) |
| Hybrid-work demand for space analytics | +2.3% | North America & EU, expanding to APAC | Short term (≤ 2 years) |
| ESG-linked occupancy-based HVAC contracts | +1.9% | Global, led by corporate sustainability initiatives | Medium term (2-4 years) |
| AI-enabled mmWave fusion for zero latency | +1.7% | North America & APAC, emerging in EU | Long term (≥ 4 years) |
| Source: Mordor Intelligence | |||
Stringent Energy-Efficiency Mandates
Energy codes such as the European Union’s Energy Performance of Buildings Directive and California Title 24 require automatic lighting and HVAC controls, anchoring long-term demand for wireless occupancy sensors market solutions. New York City’s Local Law 88 adds financial penalties for non-compliance, cementing a regulatory pull that transcends simple payback calculations. Manufacturers see predictable upgrade cycles every five years in the EU and every three years in several U.S. states, which encourages sustained R&D spending. The mandates also catalyze retrofits in small and midsize buildings that previously viewed automation as discretionary. Collectively, these measures add 3.2 percentage points to the forecast CAGR by accelerating project pipelines.[1]European Commission, “Energy Performance of Buildings Directive,” ec.europa.eu
Rapid Smart-Building & IoT Adoption
Smart-building platforms such as Cisco Spaces and Schneider Electric EcoStruxure integrate real-time occupancy data to automate HVAC, lighting, and maintenance, transforming sensors from single-function devices into data nodes that feed enterprise analytics. Thread and Matter protocols now remove interoperability headaches, letting Bluetooth, Zigbee, and Wi-Fi devices coexist without proprietary gateways. Vendors like Aqara ship dual PIR and mmWave sensors that join Apple Home, Alexa, and Google ecosystems out of the box, widening consumer reach. These network effects drive faster adoption curves, particularly in Asia-Pacific’s new commercial builds. As a result, smart-building penetration will deliver the highest driver uplift at 4.1 percentage points to the wireless occupancy sensors market CAGR.
Battery-Free Energy-Harvesting Sensors
Kinetic and solar harvesters end the maintenance bottleneck of battery replacement in ceiling-mounted sensors. EnOcean’s ECO 200 converter powers 2.4 GHz modules indefinitely, slashing lifecycle costs in warehouses where lift equipment rental can exceed sensor hardware costs. Solar variants thrive in naturally lit atria, while thermal harvesters capture HVAC temperature differentials to energize sensors in dim spaces. These designs align with ESG goals by eliminating battery waste and lowering truck rolls for facility teams. The battery-free wave unlocks dense deployments previously deemed uneconomic, adding 2.8 percentage points to growth.
Hybrid-Work Demand for Space Analytics
Hybrid work has turned square-foot optimization into a C-suite priority. AI-powered platforms such as VergeSense reveal underused areas, enabling firms like Fresenius Medical Care to avoid USD 60 million in leases over a decade. Advanced devices like Milesight’s VS121 count people with 95% accuracy while preserving anonymity to meet GDPR requirements. Continuous people counting now supplements binary occupancy signals, supporting dynamic desk assignment and cleaning schedules. Enterprises treat these insights as strategic, paying premiums that fuel a 2.3 percentage-point contribution to the wireless occupancy sensors market CAGR.
Restraints Impact Analysis*
| RESTRAINTS | (~) % IMPACT ON CAGR FORECAST | GEOGRAPHIC RELEVANCE | IMPACT TIMELINE |
|---|---|---|---|
| False triggering & calibration issues | -2.1% | Global, dense IoT deployments | Short term (≤ 2 years) |
| Data-privacy & cybersecurity concerns | -1.8% | EU & North America, expanding globally | Medium term (2-4 years) |
| RF congestion in dense IoT deployments | -1.3% | Urban centers globally | Short term (≤ 2 years) |
| Battery-disposal compliance costs | -0.9% | EU & developed markets | Long term (≥ 4 years) |
| Source: Mordor Intelligence | |||
False Triggering & Calibration Issues
Conventional PIR sensors misread HVAC drafts and temperature swings, causing lights to turn on without occupants and eroding energy-savings claims. Ultrasonic Time-of-Flight devices improve detection in such environments, but installers must fine-tune sensitivity, boosting labor costs. Dual-tech fusion reduces false positives yet doubles component count and battery drain. Premium mmWave radar remains costly and needs skilled setup unfamiliar to many electricians. Until AI-assisted auto-calibration standards mature, these technical frictions subtract 2.1 percentage points from the wireless occupancy sensors market CAGR.[2]MulticoreWare Inc., “Challenges of PIR Sensors in HVAC Environments,” multicorewareinc.com
Data-Privacy & Cybersecurity Concerns
GDPR stipulates explicit consent for occupancy monitoring that can trace individuals, limiting data granularity in European offices. Healthcare operators worry that cloud-based analytics could expose sensitive patient movement patterns. Wireless networks create attack vectors; a building-automation breach can escalate into life-safety hazards. Vendors are adding edge processing to keep raw data onsite, but that raises bill of-materials costs. Cyber-insurance underwriters increasingly demand audited sensor firmware, lengthening procurement cycles and dragging the CAGR by 1.8 percentage points.
*Our forecasts treat driver/restraint impacts as directional, not additive. The impact forecasts reflect baseline growth, mix effects, and variable interactions.
Segment Analysis
By Technology: Accuracy Drives a Sensor-Fusion Shift
Passive Infrared maintained 45.45% share in 2025 thanks to low cost and maturity, positioning it as the volume anchor of the wireless occupancy sensors market. Dual-Tech devices that blend PIR and ultrasonic signals are projected to post a 20.08% CAGR as users demand higher precision in air-conditioned open offices. Ultrasonic standalone sensors hold the runner-up slot where stable temperatures favor sound-based motion detection. mmWave radar attracts healthcare, airport, and premium office buyers that need sub-second presence confirmation for critical lighting and HVAC decisions. Computer-vision and acoustic variants remain niche yet gain attention for people-counting accuracy in retail analytics.
Vendor roadmaps increasingly bundle AI fusion engines that learn environmental patterns to slash false positives, improving confidence in the wireless occupancy sensors market. Aqara’s FP300 combines dual PIR, mmWave, temperature, humidity, and illuminance sensing to feed command data into Matter networks. Such platforms use over-the-air updates, protecting investment as algorithms evolve. While BOM costs rise, lifecycle savings from reduced callbacks justify the premium, setting the stage for larger enterprise rollouts.



By Application: HVAC Integration Powers Next-Wave Savings
Lighting Control retained 58.42% revenue dominance in 2025, benefiting from decades of code-driven deployment in commercial fit-outs. Yet HVAC & Ventilation is forecast to expand at a 18.74% CAGR, as occupancy data proves essential for right-sizing airflow to post-pandemic indoor-air-quality standards. Security & Surveillance uses sensors for alarm arming and egress path lighting, offering cross-budget synergies. The highest value accrues to Space-Utilization Analytics, where advanced counting functions enable rent optimization in premium real estate.
Honeywell’s Forge Sustainability+ illustrates how occupancy-tuned HVAC can reduce fan energy by 40% while maintaining comfort, unlocking new ROI levers for the wireless occupancy sensors market size tied to energy contracts. Vendors package cloud dashboards that monetize data subscriptions beyond hardware margins. Asset-tracking overlays use the same infrastructure, giving facility managers a multi-service platform that widens TAM without extra capex.
By Building Type: Healthcare Commands Premium Performance
Commercial buildings delivered 53.28% of 2025 revenue, reflecting broad compliance with energy codes in offices, retail, and hospitality properties. Healthcare facilities, however, promise the fastest advance at an 17.86% CAGR, driven by infection-control protocols and regulatory push for air-change monitoring. Residential smart-home adoption remains steady as consumers install occupancy-based night-lights and climate controls. Industrial plants adopt sensors for safety lockouts and energy savings on production floors.
Hospitals demand precise presence data without infringing patient privacy, leading to higher ASPs and recurring software fees that enlarge the wireless occupancy sensors market size for premium solutions. Honeywell’s Connected Hospital program integrates location intelligence to streamline staff workflows. Public & Institutional buildings follow suit as governments retrofit schools and municipal offices to meet carbon targets, creating a pipeline of tenders that favor vendors with proven cybersecurity credentials.
By Network Connectivity: Thread and Matter Unite Fragmented Protocols
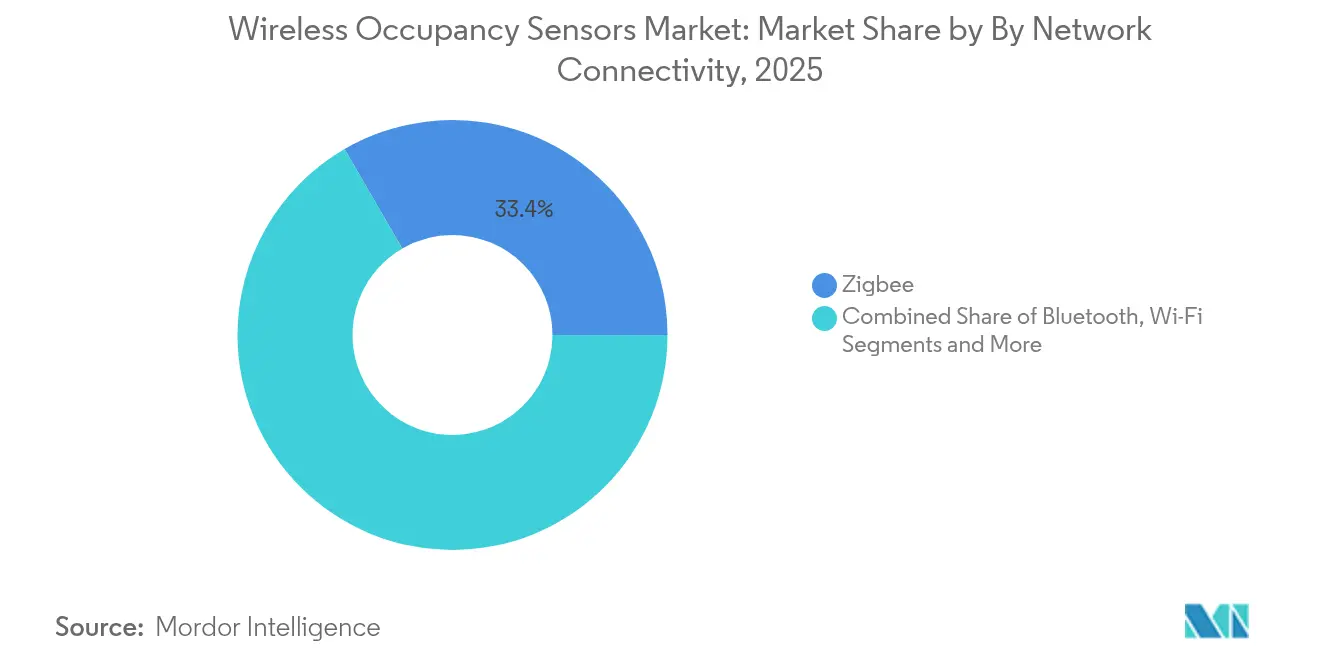
Zigbee ended 2025 with 33.37% share, its mesh topology suiting large commercial sites. Bluetooth/BLE is on track for a 20.85% CAGR through 2031 as smartphone commissioning and beacon functions simplify deployment. Wi-Fi serves high-bandwidth analytics that stream near-real-time people-count feeds to cloud dashboards. EnOcean’s self-powered protocol owns specialist niches where ceiling access is difficult and battery-free value outweighs bandwidth limits.
The Matter-over-Thread standard promises vendor-agnostic onboarding, reducing commissioning labor and de-risking purchasing decisions in the wireless occupancy sensors market. Lafaer’s mmWave Human Presence Sensor ships with native Thread Secure Mesh, linking directly to Apple Home and Google Home ecosystems without proprietary hubs. LoRaWAN extends reach across manufacturing campuses, while 5G roadmaps hint at ultra-low-latency use cases like live workspace density alerts. Interoperable connectivity underpins future adoption by freeing buyers from protocol lock-in.
By End-User Industry: Smart Buildings Anchor Convergence
Smart Buildings form the largest end-user block, spanning office towers, malls, and mixed-use complexes that integrate lighting, HVAC, and space-management dashboards. Healthcare registers the fastest growth as facilities upgrade for pandemic resilience and regulatory compliance with indoor-air-quality norms. Manufacturing sites deploy sensors for area isolation during machinery service and to verify worker presence in hazardous zones. Aerospace & Defense demand hardened, tamper-proof devices compliant with strict security frameworks.
Consumer Electronics & Smart Home buyers emphasize plug-and-play setup via mobile apps, encouraging low-cost BLE models. Retailers exploit people-count feeds for dynamic merchandising and checkout staffing. Transportation hubs overlay sensors on existing lighting circuits to monitor crowding and guide ventilation. The convergence of requirements across industries promotes scale economies that reinforce the competitive position of platform vendors in the wireless occupancy sensors market.
Geography Analysis
North America led with a 34.78% revenue share in 2025, powered by ASHRAE 90.1-2019 and Title 24 codes that mandate sensors in virtually all commercial projects. The United States spearheads mmWave radar R&D, with firms such as Novelda delivering ultra-wideband detectors capable of micro-motion tracking for patient-room applications Novelda. Canada’s LEED-centric retrofit drive and Mexico’s factory expansion sustain regional volume despite occasional trade policy uncertainties. The wireless occupancy sensors market continues to benefit from federal tax incentives for energy-efficient equipment upgrades.
Asia-Pacific is the fastest-growing territory, projected to post a 17.32% CAGR as China’s smart-city blueprint and Japan’s Zero-Energy-Building targets boost sensor penetration. India’s 100-Smart-Cities Mission and widespread 5G rollout create fertile ground for BLE-based installations in commercial towers. South Korea leverages its electronics manufacturing capacity to shorten lead times and reduce system prices, driving adoption in local education and healthcare sectors. Abundant local component supply shields the region from global chip shortages, reinforcing the wireless occupancy sensors market growth trajectory.
Europe benefits from the Energy Performance of Buildings Directive, which enforces periodic performance audits that spur continuous retrofit cycles. Germany excels in industrial automation synergies, while the United Kingdom channels carbon-reduction funds into public-sector retrofit grants. France explores smart-grid-to-building data exchanges that pay buildings for demand-response, making sensors revenue-generating assets instead of compliance costs. GDPR steers buyers toward edge-processed solutions, favoring vendors with on-device analytics. Together, these factors embed wireless sensors as a foundational element of Europe’s decarbonization roadmap.


Regulatory Landscape
Wireless occupancy sensors are shaped by building energy codes and RF equipment compliance regimes. In the United States, the FCC requires equipment authorization for RF devices before marketing or importation, which affects wireless SKUs across Zigbee, Bluetooth/BLE, Wi-Fi, and LPWAN variants. On the demand side, tightening energy codes require occupant-sensing controls in defined spaces, including California Energy Commission (CEC) 2025 Building Energy Efficiency Standards (Title 24, Part 6), which apply to permit applications on or after January 1, 2026, and New York City Department of Buildings enforcement of the 2025 NYC Energy Conservation Code beginning March 30, 2026.
Cybersecurity and privacy requirements are increasingly part of product design and procurement, especially where occupancy data is used for analytics. ETSI EN 303 645 sets baseline cybersecurity provisions for consumer IoT devices, including secure update and password requirements, and ETSI TS 103 701 outlines conformance assessment methodology against those baselines. In the United States, NISTs Cybersecurity for IoT Program and the U.S. Cyber Trust Mark initiative align with these baselines, pushing vendors toward documented secure development practices, auditable firmware, and clearer data-handling controls alongside energy-code-driven adoption.
Value Chain Analysis
The wireless occupancy sensors value chain covers component sourcing (MCUs, radios, sensors such as pyroelectric elements for PIR and radar front-ends for mmWave, plus batteries or energy-harvesting modules), device manufacturing and assembly, firmware and cloud or edge software, certification and compliance, and distribution to OEMs and installers through multi-channel networks. Connectivity standards also affect upstream design decisions and downstream interoperability. IEEE 802.15.4 underpins low-power mesh networking stacks used across Zigbee and related ecosystems, while IEEE 802.15.22.3-2020 defines architectures tied to occupancy sensing and spectrum characterization. These dependencies influence silicon selection, antenna and RF tuning, and test plans, which can extend certification timelines.
Value increasingly shifts toward platform integration and services rather than standalone sensor hardware. Building-automation players (for example, Schneider Electric via EcoStruxure) and diversified industrial vendors bundle sensors with controllers, commissioning tools, and analytics, while specialist providers focus on workspace intelligence layers that monetize data. Supply risk management remains a recurring procurement theme for global deployments, since multi-tier sourcing and trade-policy changes can move landed costs and availability. Vendors respond by qualifying alternate suppliers, regionalizing SKUs, and building firmware-upgradable interoperability to reduce field retrofit complexity.
Competitive Landscape
The wireless occupancy sensors market exhibits moderate fragmentation, with lighting giants, diversified industrials, and specialized start-ups jockeying for share. Acuity Brands’ USD 1.215 billion purchase of QSC broadened its portfolio across audio, video, and control platforms, enabling holistic space data capture that differentiates against single-function rivals. Schneider Electric’s SpaceLogic controller fuses AI with multi-sensor inputs to achieve up to 35% HVAC energy savings, illustrating competitive emphasis on integrated value rather than standalone hardware.
Emerging disruptors such as EnOcean commercialize kinetic and solar harvesting modules that eliminate battery maintenance, opening cost-conscious verticals like logistics hubs that balk at lift rentals for ceiling access. VergeSense and Milesight add subscription-based analytics models layered on hardware, shifting revenue toward recurring software streams. Patent races focus on radar signal processing and ultra-low-power edge inference, with several players increasing R&D budgets to defend intellectual property advantages.
Strategic alliances also shape competition. ABB’s collaboration with Samsung embeds occupancy data into SmartThings for unified device orchestration, while Siemens, Enlighted, and Zumtobel co-develop sensor-embedded luminaires that accelerate project timelines. Market consolidation is expected as incumbents seek data-rich assets, yet niche innovators maintain footholds by owning specialized IP or vertical expertise. This dynamic ensures healthy innovation pipelines and user choice within the wireless occupancy sensors market.
Wireless Occupancy Sensors Industry Leaders
Legrand SA
Schneider Electric SE
Acuity Brands Inc.
Signify N.V.
Johnson Controls International plc
- *Disclaimer: Major Players sorted in no particular order

Market Opportunities and Future Outlook
Interoperability-led retrofits and standardized lighting controls create a clear path for wireless occupancy sensors to scale beyond single-vendor deployments. Bluetooth SIG released the Occupancy Sensor NLC (Networked Lighting Control) Profile 1.0.1 in June 2024, and DALI published EN 62386-303:2017/A1:2024 to formalize occupancy and presence sensor behavior in lighting control systems. These specifications reduce integration friction for multi-site rollouts where building owners want sensors to operate across different luminaires, gateways, and building-management stacks.
A second opportunity centers on higher-value sensing and processing architectures that address privacy, bandwidth, and operational accuracy constraints in dense buildings. Edge-AI approaches that cut transmitted data volume (reported at 129x reduction in occupancy sensing frameworks) support deployments where cybersecurity, data-privacy, and RF congestion are procurement blockers, while improving control-loop responsiveness for HVAC and lighting. Open-protocol integration patterns (Matter, BACnet, KNX) and long-range wireless options such as LoRaWAN in facility automation add further whitespace for campus-scale coverage, especially where wiring constraints make installation labor and conduit limitations a key driver of retrofit economics.
Recent Industry Developments
- June 2026: Schréder completed the acquisition of Sydney-based EdgeMachines to integrate low-power IoT sensing and edge AI into urban lighting infrastructure. The acquisition expands intelligent lighting offerings toward embedded sensing that supports occupancy-informed control and analytics use cases. It also indicates continued consolidation around software-defined capabilities rather than luminaire-only portfolios.
- November 2025: Signify launched mains-powered motion and daylight DALI sensors integrated with the Signify Interact platform for industrial settings. By aligning sensing hardware with DALI-based control and a managed platform layer, the release reinforces offerings for large sites that want to standardize energy savings and operational visibility. The launch also reflects the shift toward platform-attached sensors within connected-lighting deployments.
- July 2024: mwConnect launched a dual-technology (PIR and ultrasonic) wireless mesh ceiling sensor compatible with Bluetooth NLC or Casambi networks. Compatibility with established mesh ecosystems supports faster retrofit and multi-room expansion without proprietary gateways. The product direction reflects demand for interoperable wireless sensor nodes that reduce commissioning friction across mixed-vendor lighting controls.


Research Methodology Framework and Report Scope
Market Definition and Coverage
For this methodology, the market covers revenue generated from wireless occupancy sensors used to detect presence in buildings and spaces, and then trigger actions like lighting, HVAC, or security responses through a wireless connection.
Scope exclusions: We exclude wired-only occupancy sensors, stand-alone analytics software without a sensor, and installation labor that is billed as a separate service line.
Segmentation Overview
- By Technology
- Passive Infrared (PIR)
- Ultrasonic
- Dual Tech (PIR + Ultrasonic)
- Microwave / mmWave Radar
- Other Technologies
- By Application
- Lighting Control
- HVAC and Ventilation
- Security and Surveillance
- Space-Utilization Analytics
- Other Applications
- By Building Type
- Residential
- Commercial
- Industrial
- Public and Institutional
- By Network Connectivity
- Zigbee
- Bluetooth / BLE
- Wi-Fi
- EnOcean (Energy-Harvesting)
- LoRa and Other LPWAN
- By End-User Industry
- Smart Buildings
- Healthcare Facilities
- Manufacturing
- Aerospace and Defense
- Consumer Electronics and Smart Home
- Others
- By Geography
- North America
- United States
- Canada
- Mexico
- Europe
- United Kingdom
- Germany
- France
- Italy
- Rest of Europe
- Asia-Pacific
- China
- Japan
- India
- South Korea
- Rest of Asia-Pacific
- Middle East
- Israel
- Saudi Arabia
- United Arab Emirates
- Turkey
- Rest of Middle East
- Africa
- South Africa
- Egypt
- Rest of Africa
- South America
- Brazil
- Argentina
- Rest of South America
- North America
Data Sources, Market Sizing, and Validation
Desk Research
Desk research was first used to set the fact base and model guardrails, so we did not size the market in isolation. We referenced public and official sources such as building energy-efficiency programs and codes published by the International Energy Agency, US Department of Energy, Eurostat, and national statistics offices, along with technical references from IEEE and similar peer-reviewed venues.
To turn those signals into market inputs, we also reviewed import and trade classifications where helpful, patent filings to track technology direction, and public product documentation that clarifies wireless protocols and typical use cases. Company annual reports, investor presentations, and reputable press were used to understand adoption patterns in commercial buildings and smart home channels, and a paid subscription covering company financials and news helped cross-check revenue exposure where disclosures were limited. The sources listed above are illustrative only, and many other references were used to collect, validate, and clarify data points during the study.
Primary Interviews and Surveys
Primary work was used to pressure-test the desk assumptions and close gaps on how wireless occupancy sensors are priced and deployed across building types. We spoke with a mix of sensor manufacturers, channel partners, building automation stakeholders, and large end users across the Americas, EMEA, and APAC, so regional demand drivers and practical buying behavior were captured. Inputs from these discussions were used to triangulate adoption rates, refresh cycles, and realistic ASP movement, particularly where feature upgrades like dual-technology sensing change the bill of materials.
Distribution of primary research fieldwork respondents
| Company type | Respondent position | Region |
|---|---|---|
| Top tier: 25% | CXOs: 15% | APAC: 46% |
| Mid tier: 57% | Functional/Unit leaders: 36% | EMEA: 31% |
| Smaller Players: 18% | Managers: 49% | Americas: 23% |
Market-Sizing & Forecasting
The core sizing logic starts with a top-down build where building demand is reconstructed from indicators that can be tracked by region, and then translated into sensor demand using penetration-style assumptions. We used variables such as commercial floor space additions, smart building and lighting control retrofit intensity, typical sensor coverage per area, wireless protocol mix (for example, Zigbee and Bluetooth/BLE shares), and average selling prices by technology class like PIR, ultrasonic, and dual-tech.
Those totals were then corroborated with selective bottom-up checks. Supplier and channel feedback were used to approximate shipments and pricing bands for major applications like lighting control and HVAC control. Where a bottom-up view had gaps, for example limited visibility into smaller distributors, the missing portion was handled by applying conservative range assumptions that were validated through additional calls.
For forecasting, scenario analysis was used so growth is tied to observable drivers and then adjusted by expert consensus on adoption timing. In practice, the model flexes with building code momentum, retrofit cycles, battery-free energy harvesting adoption, and the pace at which sensor fusion features become mainstream in projects.
Data Validation & Update Cycle
Outputs are checked in more than one way before sign-off, so large jumps do not slip through. We compare the modeled results against independent signals such as regional construction activity, building automation spending direction, and technology mix shifts that should be visible in product launches and procurement behavior.
If a variance looks unusual, the assumptions behind penetration, pricing, and replacement cycles are re-checked, and follow-up outreach is triggered to resolve the conflict. Reports are refreshed annually, and interim updates are made when material events change demand conditions or pricing. Before delivery, a final analyst pass is completed so the numbers reflect the latest available information.
Mordor Intelligence's Global Wireless Occupancy Sensors Market Market Size Measured Against Other Published Estimates
Published market sizes can look far apart even when everyone is describing the same product family, because the counted scope and the pricing logic are not always aligned. Differences typically come from what is treated as a sensor versus a wider system, which years are used for currency conversion, and how fast adoption is assumed in retrofit-led demand.
The main gap comes from whether wired occupancy sensors and broader building automation hardware are included in the same bucket, where Mordor Intelligence counts only wireless occupancy sensors and keeps adjacent controls out unless they are sold as part of the sensor unit price.
Benchmark comparison
| Source | Market Size | Gaps in Research Methodology |
|---|---|---|
| Mordor Intelligence | USD 1.27 B (2026) | |
| Regional Consultancy A | USD 1.00 B (2024) | Uses an earlier base year and blends in wider building automation buying cycles, which can understate the 2026 level when pricing and protocol upgrades are not refreshed forward. |
| Trade Journal B | USD 1.60 B (2025) | Tends to apply a higher ASP path and broader inclusion of advanced sensing variants without consistently separating wireless-only units from hybrid or system-level spend. |
The spread in the table is mainly explained by what is included in the counted product set and how pricing is carried forward year to year. By keeping the scope tied to wireless sensor unit revenue and cross-checking adoption and ASP assumptions with field feedback, the final estimate remains traceable to practical demand drivers that can be revisited and updated.


Key Questions Answered in the Report
What is the projected size of the wireless occupancy sensors market by 2031?
The market is expected to reach USD 2.63 billion by 2031, reflecting a 15.62% CAGR.
Which region shows the fastest growth potential for wireless occupancy sensors?
Asia-Pacific is forecast to grow at a 17.32% CAGR, driven by China’s smart-city rollouts and Japan’s zero-energy-building initiatives.
Why are Dual-Tech sensors gaining popularity?
They combine PIR and ultrasonic detection to cut false triggers, leading to a 20.08% CAGR, the highest among technology segments.
How do battery-free sensors impact total cost of ownership?
Kinetic and solar energy-harvesting designs remove battery replacement labor and disposal fees, significantly lowering lifecycle costs.
What application segment is expanding fastest in this industry?
HVAC & Ventilation integration is advancing at a 18.74% CAGR as buildings tie airflow to real-time occupancy data to meet ESG goals.
What key restraint could slow adoption?
Data-privacy and cybersecurity concerns, especially under GDPR rules, can lengthen procurement cycles and curb deployment speed.
Page last updated on:





