
Market Overview
| Study Period | 2021 - 2031 |
|---|---|
| Market Size (2026) | USD 47.64 Billion |
| Market Size (2031) | USD 57.17 Billion |
| Growth Rate (2026 - 2031) | 3.71 % |
| Fastest Growing Market | Asia Pacific |
| Largest Market | North America |
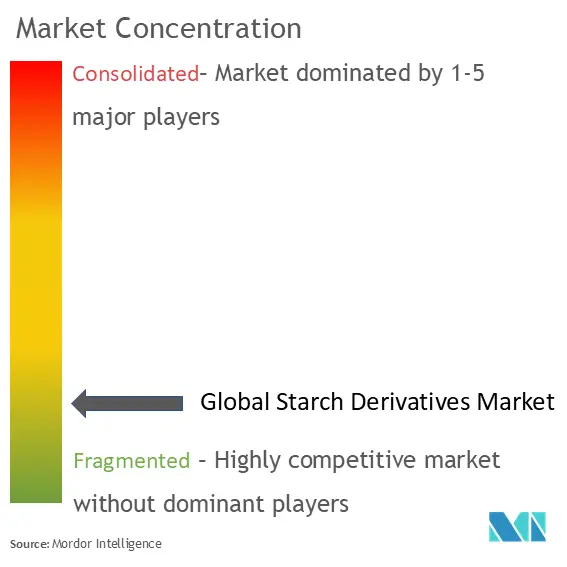
| Market Concentration | Low |
Major Players
*Disclaimer: Major Players sorted in no particular order Image © Mordor Intelligence. Reuse requires attribution under CC BY 4.0. |
|
Starch Derivatives Market Analysis by Mordor Intelligence
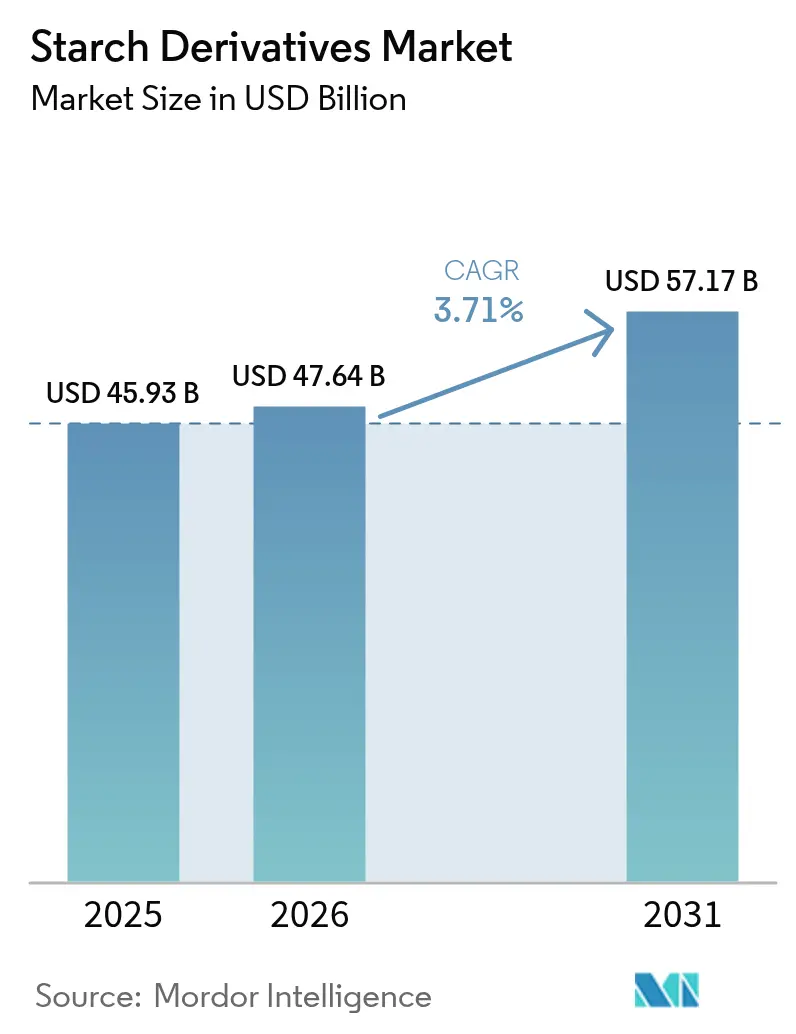
The starch derivatives market size is expected to grow from USD 45.93 billion in 2025 to USD 47.64 billion in 2026 and is forecast to reach USD 57.17 billion by 2031 at 3.71% CAGR over 2026-2031. Moderate but steady expansion reflects the transition from bulk commodities to specialty derivatives that command premium pricing. Regulatory agencies now favor plant-based inputs, enabling broader use of maltodextrin, cyclodextrin, and glucose syrups in food, beverage, and pharmaceutical formulations. Investment continues to move toward enzymatic processing that lowers energy use and simplifies compliance with environmental rules. North American suppliers benefit from a mature Food and Drug Administration (FDA) framework, while Asia-Pacific manufacturers gain momentum through harmonized safety standards and rising nutraceutical demand. Across all regions, clean-label and non-GMO positioning is no longer optional; it has become a key competitive lever for branded ingredient suppliers that target global food and drug customers.
Key Report Takeaways
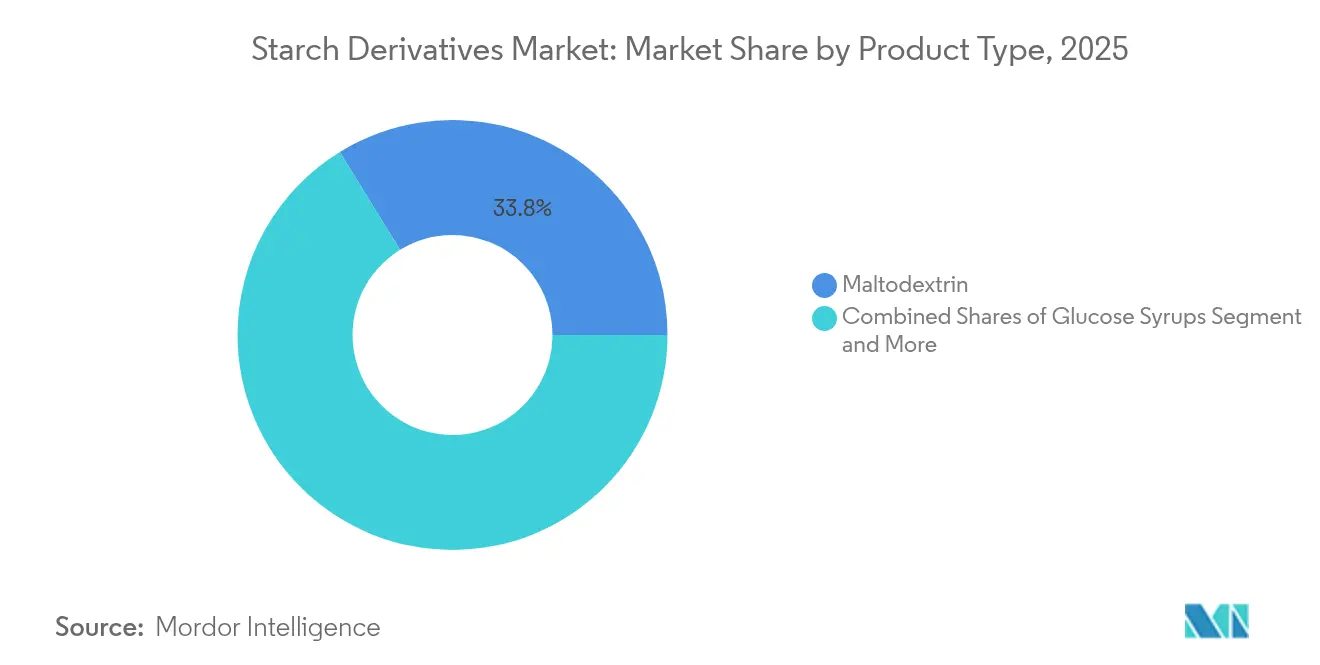
- By type, maltodextrin held 33.78% of the starch derivatives market share in 2025, while cyclodextrin is projected to grow at a 4.92% CAGR from 2026-2031.
- By source, maize dominated with a 62.61% share in 2025; tapioca is set to expand at a 4.7% CAGR through 2031.
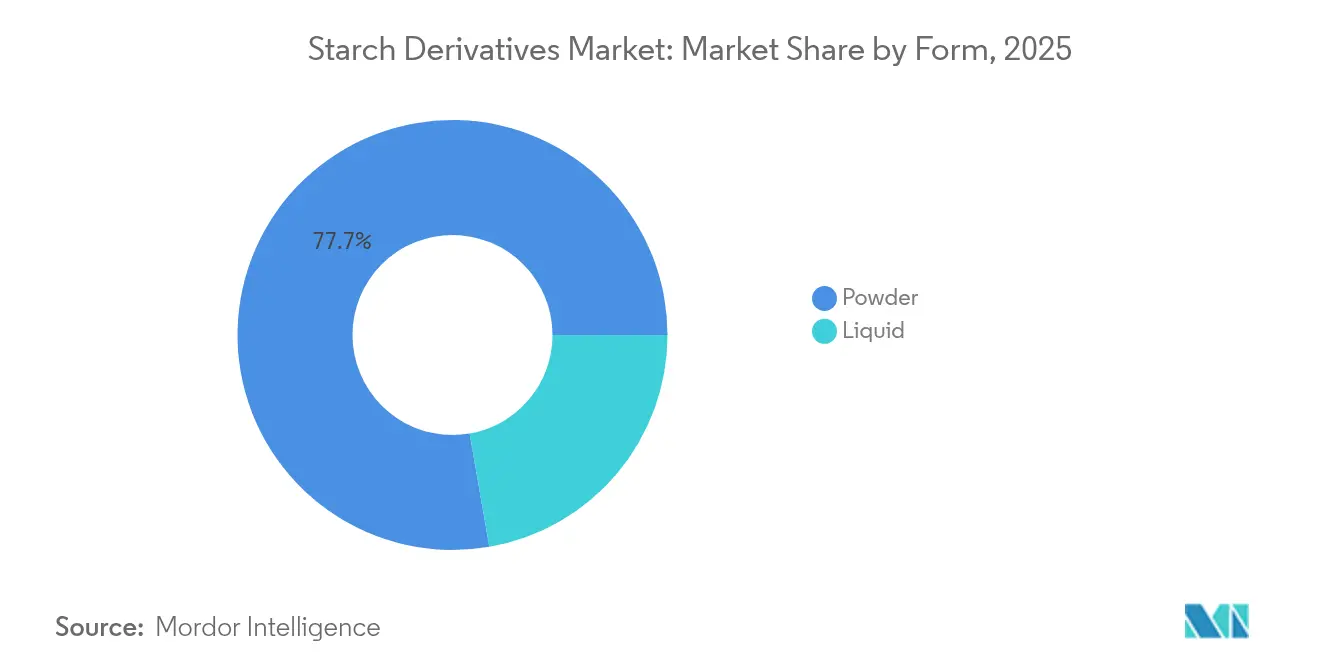
- By form, powder accounted for 77.74% revenue in 2025, whereas liquid derivatives are forecast to post a 4.45% CAGR to 2031.
- By application, food and beverage captured 65.55% of the starch derivatives market size in 2025, and pharmaceutical applications will register the fastest 5.18% CAGR between 2026-2031.
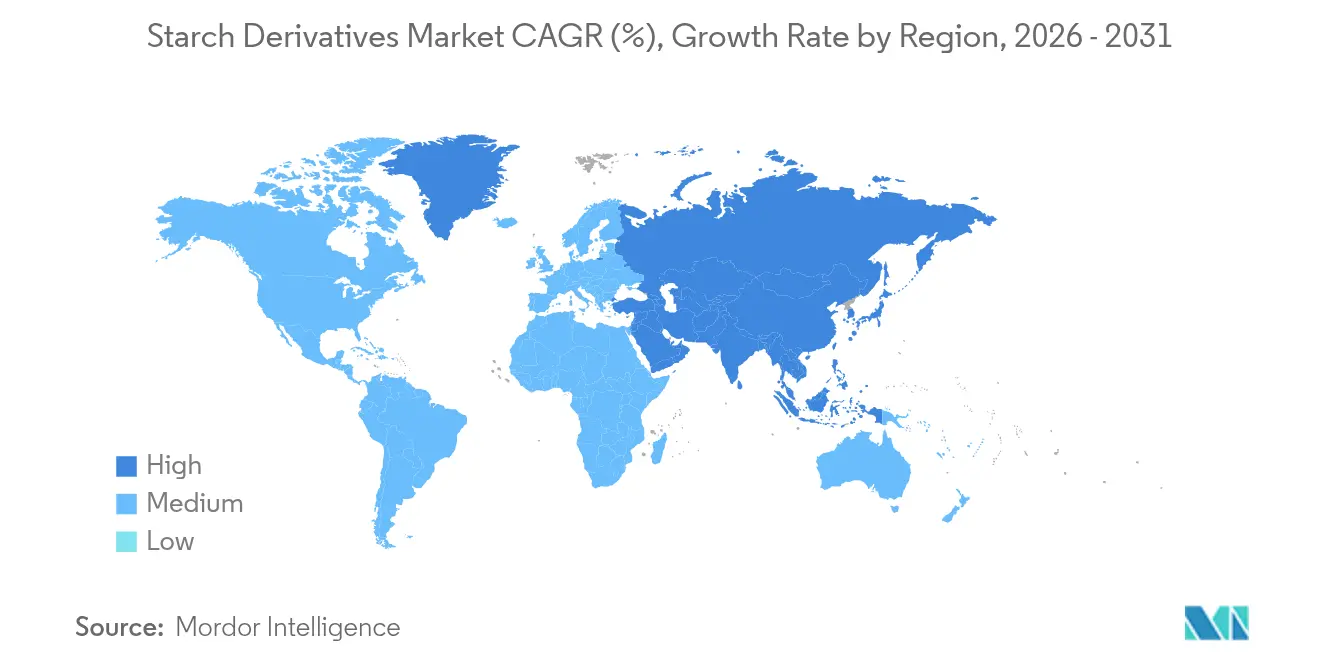
- By geography, North America led with a 35.96% share in 2025; Asia-Pacific is expected to rise at a 5.02% CAGR through 2031.
Note: Market size and forecast figures in this report are generated using Mordor Intelligence’s proprietary estimation framework, updated with the latest available data and insights as of 2026.
Market Trends and Insights
Drivers Impact Analysis of Starch Derivatives Market*
| Drivers | (~) % Impact on CAGR Forecasts | Geographic Relevance | Impact Timeline |
|---|---|---|---|
| Growing Demand for Natural Sweeteners in Food and Beverage | +0.8% | Global, with strongest impact in North America & Europe | Medium term (2-4 years) |
| High Demand for Starch-Based Glucose Syrup in Bakery and Confectionary | +0.6% | Global, concentrated in Asia-Pacific and Europe | Short term (≤ 2 years) |
| Increased Adoption of High Fructose Corn Syrup (HFCS) in Beverage Formulation | +0.5% | North America & Latin America primarily | Short term (≤ 2 years) |
| Multi-Functional Benefits Associated with Starch Derivatives | +0.7% | Global, with early adoption in developed markets | Medium term (2-4 years) |
| Amplifying Demand for Clean Label and Non-GMO Ingredients | +0.9% | North America & Europe leading, expanding to Asia-Pacific | Long term (≥ 4 years) |
| Technological Advancements in Enzymatic Processing of Starch | +0.4% | Global, with innovation centers in Europe & North America | Long term (≥ 4 years) |
| Source: Mordor Intelligence | |||
Growing Demand for Natural Sweeteners in Food and Beverage
Regulatory frameworks increasingly favor naturally-derived sweeteners over synthetic alternatives, with the FDA's Generally Recognized as Safe (GRAS) designation streamlining approval pathways for starch-based sweetening systems. The FDA's classification of maltodextrin as a non-sweet saccharide polymer with dextrose equivalent below 20 positions it advantageously against synthetic alternatives in food applications. Consumer preference shifts toward natural ingredients drive reformulation initiatives across beverage categories, creating sustained demand for starch-derived texturizing agents that maintain mouthfeel while reducing synthetic additive content. The trend extends beyond beverages into functional foods, where clean-label requirements drive specification of naturally-derived starch modifications over chemically-processed alternatives. Regulatory bodies' emphasis on ingredient transparency strengthens the competitive position of starch derivatives in applications requiring natural ingredient declarations.
High Demand for Starch-Based Glucose Syrup in Bakery and Confectionary
Bakery and confectionery applications leverage glucose syrups' unique functional properties, particularly their ability to control crystallization and extend shelf life while maintaining compliance with food safety regulations. The FAO's Codex Alimentarius standards recognize glucose syrups as essential functional ingredients in processed foods, supporting their adoption across global markets. Enzymatic processing innovations enable glucose syrup production with tailored dextrose equivalent values, allowing manufacturers to optimize sweetness intensity and browning characteristics for specific applications while maintaining regulatory compliance. European food safety frameworks favor naturally-derived glucose syrups over synthetic alternatives in premium confectionery segments, creating market differentiation opportunities. The application's technical complexity and regulatory requirements create barriers to entry, enabling established players with approved formulations to maintain pricing power while expanding into adjacent categories.
Increased Adoption of High Fructose Corn Syrup (HFCS) in Beverage Formulation
HFCS adoption in beverage formulation reflects regulatory acceptance and established safety profiles, with FDA approval supporting its use across multiple food categories despite evolving consumer preferences. The ingredient's superior solubility and flavor enhancement properties make it indispensable for carbonated soft drinks and energy beverages, where functional requirements align with regulatory specifications. Regional regulatory differences create market segmentation opportunities, with established approval pathways in North American markets supporting continued growth while European markets maintain stricter labeling requirements. The FDA's food additive regulations provide clear guidelines for HFCS usage levels, enabling manufacturers to optimize formulations within approved parameters. Regulatory stability in key markets supports long-term supply agreements and production planning, despite evolving consumer preferences toward natural alternatives.
Amplifying Demand for Clean Label and Non-GMO Ingredients
Clean label requirements fundamentally alter starch derivative specifications, with regulatory frameworks like the EU's Novel Food Regulation strengthening natural ingredient positioning by requiring extensive safety documentation for synthetic alternatives. The USDA's National Organic Program standards create certification pathways for organic starch derivatives, enabling premium pricing for certified ingredients that meet consumer expectations. EFSA's[1]European Food Safety Authority, "Extension of use of isomalto-oligosaccharide as a novel food according to Regulation (EU) 2015/2283", www.efsa.com safety assessments of food additives increasingly favor naturally-derived ingredients with established safety profiles, creating competitive advantages for starch-based alternatives over synthetic additives. Regulatory frameworks emphasizing ingredient transparency strengthen the competitive position of starch derivatives in applications requiring natural ingredient declarations. Supply chain transparency requirements, supported by regulatory traceability standards, become competitive differentiators for companies investing in sustainable sourcing programs.
Restraints Impact Analysis of Starch Derivatives Market*
| Restraints | (~) % Impact on CAGR Forecasts | Geographic Relevance | Impact Timeline |
|---|---|---|---|
| Volatility in Agricultural Raw Material Costs Affect Industry Profitability | -0.7% | Global, with highest impact in commodity-dependent regions | Short term (≤ 2 years) |
| Health Concerns Linked to High Fructose Corn Syrup Consumption | -0.4% | North America & Europe primarily | Medium term (2-4 years) |
| Rising Consumer Shift Away from Artificial Additives | -0.3% | Developed markets leading, expanding globally | Long term (≥ 4 years) |
| Allergy Risks and Labeling Requirements for Various Starch Additives | -0.2% | Global, with strictest requirements in EU & North America | Medium term (2-4 years) |
| Source: Mordor Intelligence | |||
Volatility in Agricultural Raw Material Costs Affect Industry Profitability
Raw material price volatility significantly impacts starch derivative profitability, with agricultural commodity markets subject to weather-related disruptions and geopolitical tensions affecting global supply chains. USDA[2]U.S. Department of Agriculture, “World Agricultural Supply and Demand Estimates,” usda.gov crop reports indicate significant yield variations in key starch-producing regions, directly affecting raw material availability and pricing for downstream processors. Corn starch markets demonstrate particular sensitivity to agricultural policy changes and trade regulations, with price fluctuations creating margin pressure for integrated processors. Weather-related disruptions in key agricultural regions force manufacturers to maintain higher inventory levels, increasing working capital requirements and reducing operational flexibility. Government agricultural support programs and trade policies create additional uncertainty in raw material pricing, requiring sophisticated hedging strategies to manage cost volatility.
Rising Consumer Shift Away from Artificial Additives
Consumer preferences increasingly favor naturally-derived ingredients, supported by regulatory frameworks that require clear labeling of synthetic additives and processing aids. European Union [3]European Commission, “Regulation (EU) No 1169/2011 on Food Information to Consumers,” ec.europa.euregulations on food additives create stricter approval pathways for synthetic ingredients while maintaining streamlined processes for naturally-derived alternatives. The FDA's food additive approval process increasingly emphasizes safety data for synthetic compounds while maintaining GRAS pathways for natural ingredients with established safety profiles. This regulatory environment creates competitive advantages for starch-based alternatives over synthetic additives in applications requiring clean-label positioning. Government consumer protection agencies' emphasis on ingredient transparency strengthens market demand for naturally-derived starch modifications over chemically-processed alternatives.
*Our forecasts treat driver/restraint impacts as directional, not additive. The impact forecasts reflect baseline growth, mix effects, and variable interactions.
Starch Derivatives Market Segment Analysis
By Type:
Pharmaceutical Applications Drive Specialty GrowthCyclodextrin emerges as the fastest-growing segment with 4.92% CAGR through 2031, driven by FDA approvals for pharmaceutical applications where its unique molecular structure enables drug solubility enhancement and controlled release formulations. The FDA's recognition of cyclodextrins as safe excipients in drug delivery systems supports commercial viability across multiple therapeutic categories. Maltodextrin commands 33.78% market share in 2025, reflecting its versatility as a bulking agent and flavor carrier with established GRAS status across food applications. Glucose syrups maintain steady demand in bakery applications, supported by FAO Codex standards that recognize their functional benefits in processed foods. Dextrins benefit from expanding industrial uses in adhesives and biodegradable packaging, where environmental regulations favor naturally-derived alternatives.
Recent regulatory approvals for cyclodextrin-based pharmaceutical formulations demonstrate the segment's evolution toward sophisticated drug delivery platforms, with applications extending across multiple therapeutic areas. The type segmentation increasingly reflects regulatory compliance requirements rather than traditional commodity categories, with specialty derivatives commanding premium pricing through technical differentiation and established approval pathways. Modified cyclodextrins receive regulatory recognition for enhanced solubility properties, creating opportunities for application-specific derivatives in pharmaceutical and nutraceutical markets.



By Source:
Regulatory Compliance Drives DiversificationTapioca represents the fastest-growing source at 4.7% CAGR through 2031, benefiting from its naturally gluten-free properties and compliance with clean-label regulations across global markets. Maize dominates with a 62.61% market share in 2025, supported by established USDA quality standards and a comprehensive supply chain infrastructure that ensures consistent quality and regulatory compliance. Wheat-based derivatives serve specialized applications in European markets, where EU quality standards support premium positioning in food applications. Potato starch commands premium pricing in applications requiring superior film-forming properties, supported by regulatory recognition of its functional benefits. Rice starch gains importance in Asian markets, where local food safety regulations support its use in traditional and modern food applications.
Source diversification strategies reflect regulatory risk management considerations, with companies maintaining multiple source approvals to ensure supply chain resilience despite regulatory changes. The comparative regulatory status of different starch sources creates market segmentation opportunities, with organic and non-GMO certifications enabling premium positioning in health-conscious consumer segments. Regulatory frameworks governing agricultural inputs and processing methods increasingly influence source selection decisions, favoring suppliers with comprehensive compliance programs.
By Form:
Processing Regulations Shape Market DynamicsLiquid derivatives grow at 4.45% CAGR through 2031, driven by industrial processing applications where FDA good manufacturing practice guidelines favor continuous processing systems. Powder form maintains dominance with 77.74% market share in 2025, reflecting regulatory advantages in storage stability and transportation compliance across international markets. The form segmentation reflects regulatory requirements for food safety and quality control, with powder forms offering advantages in microbiological stability and shelf life extension. Processing regulations increasingly influence form selection, with liquid forms preferred in applications requiring precise dosing and mixing under controlled conditions.
Recent developments in processing technology enable form modifications that comply with environmental regulations while maintaining functional performance characteristics. The choice between powder and liquid forms increasingly depends on regulatory compliance requirements, with liquid forms advantageous in pharmaceutical applications requiring sterile processing conditions. Innovation in form development includes regulatory-compliant encapsulation technologies that protect sensitive derivatives during storage and transportation.
By Application:
Regulatory Pathways Enable Pharmaceutical GrowthPharmaceutical applications emerge as the fastest-growing segment with 5.18% CAGR through 2031, driven by FDA and EMA approval pathways that recognize starch derivatives as safe and effective excipients in drug formulations. Food and beverage applications command 65.55% market share in 2025, supported by comprehensive regulatory frameworks that establish safety parameters for starch-based ingredients across multiple food categories. Personal care applications benefit from FDA cosmetic regulations that recognize starch derivatives' functional properties in topical formulations. Animal feed applications provide stable demand for lower-grade derivatives, supported by USDA feed safety regulations that ensure product quality and safety.
The pharmaceutical segment's growth reflects regulatory acceptance of cyclodextrin-based formulations, with established approval pathways enabling commercial viability across therapeutic categories. Within food applications, regulatory frameworks increasingly favor naturally-derived starch modifications over synthetic alternatives, creating competitive advantages for compliant suppliers. Application diversification strategies enable companies to leverage regulatory expertise across multiple sectors while reducing dependence on single application categories.
Geography Analysis
North America Starch Derivatives Market
North America maintains market leadership with 35.96% share in 2025, supported by comprehensive FDA regulatory frameworks that establish clear pathways for starch derivative approval across food and pharmaceutical applications. The region benefits from USDA agricultural quality standards that ensure consistent raw material supply and established good manufacturing practices that support export competitiveness. Regulatory stability in pharmaceutical applications creates competitive advantages for North American suppliers, with FDA approval pathways enabling premium positioning in global markets. The region's mature regulatory environment supports innovation in specialty applications while maintaining safety standards that ensure consumer protection.
APAC Starch Derivatives Market
Asia-Pacific emerges as the fastest-growing region with 5.02% CAGR through 2031, driven by regulatory harmonization initiatives across ASEAN markets that create standardized approval pathways for starch derivatives. Regional food safety frameworks increasingly align with international standards, reducing compliance costs for multinational suppliers while ensuring product quality and safety. The region's growth reflects expanding pharmaceutical manufacturing capabilities supported by regulatory frameworks that recognize international quality standards. Government initiatives promoting food processing industrialization create demand for technically sophisticated starch derivatives that comply with evolving safety requirements.
Europe Starch Derivatives Market
Europe demonstrates steady growth supported by comprehensive EFSA safety assessments that establish clear guidelines for starch derivative applications across food and pharmaceutical sectors. The region's stringent regulatory framework creates barriers to entry while protecting established suppliers with approved product portfolios and comprehensive compliance programs. EU environmental regulations favor biodegradable starch-based materials over petroleum-based alternatives, creating market opportunities for sustainable packaging applications. The region's focus on sustainability drives regulatory support for naturally-derived starch modifications that comply with circular economy principles and environmental protection standards.

Regulatory Landscape
Starch derivatives are subject to food additive and ingredient rules that differ by end use (food, pharma excipients, plant protection, and industrial applications) and by region. Global alignment is supported by Joint FAO/WHO Expert Committee on Food Additives (JECFA) monographs for modified starches (INS 1400-1451). In the European Union, Commission Regulation (EU) 2026/196 (published January 2026) amended usage conditions and specifications for multiple additives, including starch sodium octenyl succinate (E 1450), and set staged compliance windows (from August 2026 through February 2028) that require suppliers to manage specification updates across product lines and customer labels.
In China, updated national standards tightened baseline requirements for starch inputs used downstream in derivative production and formulation. GB 31637-2025 for edible starch entered into force in March 2026, replacing the prior 2016 version and updating parameters such as moisture limits and hydrocyanic acid indicators, while additional food additive standards (for example, GB 1886.41-2025 for xanthan gum) also took effect on March 2, 2026, reinforcing a broader shift toward refreshed additive compliance packages for processed foods. Trade and customs compliance remains a parallel constraint in global supply, because modified starches can be sensitive to tariff classification (such as headings under HS 3505) and can be affected by changing trade policy positions in negotiations where starch-derived products are explicitly debated.
Value Chain Analysis
The value chain starts with agricultural sourcing (maize, tapioca/cassava, potato, wheat, and rice) and moves into primary starch extraction, followed by conversion into derivatives through acid, enzymatic, or physical modification. It then progresses through blending, drying (powder) or concentration (liquid syrups), quality assurance, and regulatory documentation for food and pharmaceutical customers. Upstream volatility in crop pricing and quality feeds into conversion economics, which encourages processors to invest in process efficiency, particularly enzymatic routes, and to secure multi-origin approvals to support continuity for applications spanning bakery and confectionery to drug delivery excipients.
Downstream distribution and application support increasingly depend on regional production footprints and specialist ingredient distributors that provide formulation assistance, local warehousing, and compliance-ready documentation. In Europe and North America, distribution partnerships have expanded access to potato starch and derivatives, with Brenntag Specialties and Royal Avebe extending collaboration to Poland (March 2025) and then into North America (July 2025). Manufacturing capacity additions and realignments also influence flows: Cargill inaugurated a corn milling plant in Gwalior, India (March 2025) via an arrangement with Saatvik Agro Processors (initial 500 tons per day), and a May 2026 partnership between Sanstar Limited and Ingredion established a joint venture in India to manufacture and distribute specialty pharmaceutical and food ingredients, signaling deeper integration between conversion assets and customer-facing specialty portfolios.
Competitive Landscape
The starch derivatives market shows low fragmentation score. This structure stems from regulatory barriers that benefit established companies possessing comprehensive approval portfolios and quality control systems. The competitive landscape focuses on regulatory compliance and technical differentiation rather than price, as companies invest in quality assurance capabilities and regulatory expertise to serve premium market segments. Companies with existing FDA and EFSA approvals maintain competitive advantages, while new entrants face high regulatory compliance costs that limit market entry. The leading companies in the starch derivatives market, such as Archer Daniels Midland Company, Cargill, Incorporated, Ingredion Inc., and Tate & Lyle Plc, distinguish themselves through innovation, broad product portfolios, and substantial production capacities.
These players focus on developing new applications of starch derivatives in emerging sectors like biofuels and bioplastics, which enhances their market share. Additionally, their ability to adapt to evolving consumer preferences, particularly in the food industry, by offering clean-label and non-GMO starch derivatives, positions them as market leaders. The starch derivatives production processes employed by these companies are continuously refined to improve efficiency and sustainability.
A significant trend in the starch derivatives market is the shift toward sustainable and clean-label products, driven by consumer demand for healthier and environmentally friendly options. Companies are investing in sustainable sourcing of raw materials and improving production efficiency to reduce their environmental footprint. Another critical success factor is the ability to customize products to meet specific industry requirements, especially in the rapidly evolving food and beverage sector. Firms that can align with these trends are poised for continued growth and market leadership.
Starch Derivatives Industry Leaders
-
Archer Daniels Midland Company
-
Cargill, Incorporated
-
Ingredion Inc.
-
Tate & Lyle Plc
-
Roquette Frères S.A.
- *Disclaimer: Major Players sorted in no particular order
Starch Derivatives Market Companies Covered in this Report
- Archer Daniels Midland Company
- Cargill, Incorporated
- Ingredion Inc.
- Tate & Lyle Plc
- Roquette Freres S.A.
- Sudzucker AG
- Angel Starch & Food Pvt Ltd
- Tereos S.A.
- Royal Avebe
- Grain Processing Corp.
- Universal Starch Chem Allied Ltd.
- Gujarat Ambuja Exports Limited
- Thai Wah Public Co.
- Qingdao CBH Co.
- Matsutani Chemical Industry Co., Ltd.
- DSM-Firmenich
- Sunar Group
- Shandong Baolingbao
- Crespel & Deiters GmbH & Co. KG
- Bharat Starch

Market Opportunities and Future Outlook
A clear opportunity is in specialty and clean-label starch derivatives that replace chemically modified inputs while meeting tighter customer specifications for transparency and globally usable regulatory files. In 2026, market activity reflects investment behind this shift in higher-growth end uses such as processed foods and pharma-adjacent ingredients. Gujarat Ambuja Exports Limited began commercial production at a new maltodextrin facility in Hubli, Karnataka in March 2026, adding 16,000 MTPA of capacity, and Regaal Resources commissioned new liquid glucose and maltodextrin powder facilities in Bihar in May 2026, lifting total milling capacity from 825 TPD to 1,650 TPD. These capacity additions expand local availability of glucose syrups and maltodextrin for bakery, confectionery, dairy, and nutrition formulations, while reducing lead times for customers seeking consistent quality and documentation.
Application-led innovation also opens room for differentiation where functionality drives adoption, including texture and stability solutions for functional foods and newer processing formats (for example, physical and enzymatic treatments such as heat-moisture treatment, extrusion, and pre-gelatinization to emulate the performance of chemically modified starches). In India, the proposal by Matix Fertilisers and Chemicals Limited (July 2026) for a starch derivatives and sweeteners complex at Panagarh Industrial Park in West Bengal (888 TPD) highlights continued industrialization of derivative supply in emerging manufacturing hubs, supporting broader penetration into food processing and adjacent industrial uses where reliable local sourcing and compliance-ready specifications are decisive.
Recent Industry Developments in Starch Derivatives Market
- June 2026: Ingredion Incorporated announced a recommended all-cash acquisition of Tate & Lyle Plc, with an implied total enterprise value of about GBP 3.7 billion (USD 5.0 billion). The transaction targets scale in specialty ingredients, expanding portfolio breadth and customer reach in starch-derived solutions across food and beverage formulations.
- May 2026: Cargill completed the divestment of its corn wet milling facility in Davangere, Karnataka, India, to Riddhi Siddhi Gluco Biols Ltd. The transaction reshapes regional supply dynamics for corn-based starch derivatives by transferring ownership to a local producer with an established distribution network. This divestment aligns Cargill's portfolio with geography-specific manufacturing and could influence sourcing strategies for confectionery, dairy, and pharmaceutical customers that rely on local inputs.
- March 2025: Cargill inaugurated a new corn milling plant in Gwalior, Madhya Pradesh, India, through a business arrangement with Saatvik Agro Processors, with an initial capacity of 500 tons per day. The added conversion capacity supports downstream demand from confectionery, infant formula, and dairy customers that require reliable starch inputs and derivative streams.


Starch Derivatives Market Report Scope and Research Methodology
Market Definition and Coverage
For this study, the starch derivatives market is counted as the global value of commercial starch-derived ingredients that are sold into food and beverage and industrial uses, across key forms and product families, and tracked in USD for the stated period.
Scope exclusions: We exclude on-farm starch crop value, finished branded foods where the ingredient value cannot be separated, and internal plant transfer pricing that does not reflect an external market transaction.
Segments Covered in This Report
-
By Type
- Glucose Syrups
- High Fructose Corn Syrup (HFCS)
- Maltodextrin
- Cyclodextrin
- Dextrins
- Others
-
By Source
- Maize
- Wheat
- Potato
- Tapioca
- Others
-
By Form
- Powder
- Liquid
-
By Application
-
Food and Beverage
- Bakery
- Confectionery
- Beverage
- Others
- Pharmaceutical
- Personal Care and Cosmetics
- Animal Feed
- Others
-
Food and Beverage
-
By Geography
-
North America
- United States
- Canada
- Mexico
- Rest of North America
-
Europe
- Germany
- United Kingdom
- Italy
- France
- Spain
- Netherlands
- Rest of Europe
-
Asia-Pacific
- China
- India
- Japan
- Australia
- Rest of Asia-Pacific
-
South America
- Brazil
- Argentina
- Rest of South America
-
Middle East and Africa
- South Africa
- Saudi Arabia
- United Arab Emirates
- Rest of Middle East and Africa
-
North America
Data Sources, Market Sizing, and Validation
Desk Research
Desk work started with building a clear boundary for what gets counted as starch derivatives versus what does not, then collecting public indicators that support the direction of demand and pricing. We used sources such as USDA data for corn and sweetener balance sheets, FAOSTAT for crop production context, UN Comtrade for trade signals on related starch-based ingredients, and the OECD-FAO outlook series to sanity-check longer-term demand patterns.
We also reviewed public company filings and investor decks for capacity additions, product mix, and volume commentary, and we used association and regulator websites that describe labeling and food additive usage rules. For pricing sanity checks and conversion to comparable USD series, we used paid access to company financials and intelligence, plus a paid patent database to identify where new derivative functionality is being targeted. The desk sources named here are illustrative only, and many other public documents and data releases were also referenced for validation and clarification.
Primary Interviews and Surveys
To firm up assumptions that are not visible in public data, we ran expert conversations and short surveys with producers, distributors, and large end users across food, paper, pharma, feed, and fermentation-linked applications. The inputs were used to confirm typical contract structures, application-level substitution behavior, and the practical split between liquid and powder forms across regions, and then to stress-test our final totals.
Distribution of primary research fieldwork respondents
| Company type | Respondent position | Region |
|---|---|---|
| Top tier: 30% | CXOs: 15% | APAC: 40% |
| Mid tier: 48% | Functional/Unit leaders: 28% | EMEA: 37% |
| Smaller Players: 22% | Managers: 57% | Americas: 23% |
Market-Sizing & Forecasting
Sizing was first built from a top-down demand pool, where starch crop availability, conversion pathways into key derivative families, and end-use consumption signals were used to reconstruct the value base by region and application. Once that frame was set, we applied selective bottom-up checks using sampled volume and price points, channel discussions, and a limited roll-up of supplier revenue exposure to starch derivatives, which helped correct any over-counting.
A few practical inputs that moved the model were regional processed food output trends, paper and packaging activity where starch binders are relevant, fermentation and sweetener demand signals, import-export movements for starch-based ingredients, and observed pricing direction for corn-linked and cassava-linked feedstocks. Average selling prices were treated as a mix of contract and spot behavior, then normalized to a consistent currency timing so year values stay comparable. For forecasting, scenario analysis was used, with assumptions on feedstock cost pass-through, application substitution limits, and capacity additions being reviewed with primary respondents to keep growth paths realistic. Where bottom-up signals were missing for smaller countries, gaps were filled using regional ratio methods linked to consumption proxies, then rechecked against trade and production context.
Data Validation & Update Cycle
Model outputs were checked against independent signals such as trade flows, crop and sweetener balance sheets, and announced capacity or utilization shifts, and then outliers were reviewed before internal sign-off. When a region showed an unusual jump, we revisited the price and volume drivers, and we re-contacted sources if the change could not be explained by a visible market event.
The study is refreshed on an annual cycle, and interim updates are made when material changes occur, such as major feedstock price shocks, regulatory shifts affecting sweeteners, or large capacity starts and shutdowns. Before delivery, the numbers are re-run with the latest available public series so clients receive an updated view, rather than an older snapshot.
Mordor Intelligence's Global Starch Derivatives Market Market Size Compared With Other Published Estimates
Published market values for starch derivatives can look far apart because each publisher makes different calls on what gets counted, which year is treated as the anchor, and how prices are converted into USD. Even when product labels are similar, the mix of liquid syrups versus powders and the handling of industrial uses can shift the total significantly.
A refresh-led gap is common in this market because feedstock-linked price moves can change reported value quickly, and currency conversion timing can add drift across regions. By locking the model to a consistent currency window, rechecking ASP progressions against contract behavior, and revalidating key drivers before publication, Mordor Intelligence keeps the 2026 value closer to observable demand and price reality than estimates that rely on an older price base or broader ingredient definitions.
Benchmark comparison
| Source | Market Size | Gaps in Research Methodology |
|---|---|---|
| Mordor Intelligence | USD 47.64 B (2026) | |
| Global Consultancy A | USD 83.87 B (2024) | Uses a different base year and a wider value boundary that appears to include more sweetener and industrial ingredient lines, and the price normalization and currency timing are not clearly aligned to the study year. |
| Industry Publisher B | USD 90.14 B (2025) | Reports a higher value that likely reflects a broader scope and a more aggressive price and demand path into the mid term, with limited visibility on how regional ASPs and contracts were validated. |
The spread is largely explained by differences in year selection, scope edges around sweeteners and adjacent starch-based ingredients, and how fast-changing prices are translated into annual USD values. When the steps are tied to clear demand indicators and repeatable price logic, decision-makers get a number that is easier to reconcile across regions and update when market conditions shift.


Key Questions Answered in the Report
What is the current size of the starch derivatives market?
The starch derivatives market is valued at USD 47.64 billion in 2026 and is projected to reach USD 57.17 billion by 2031.
Which product type leads the market?
Maltodextrin holds the largest 33.78% share, supported by widespread use as a bulking agent in beverages and instant foods.
Which region is growing the fastest?
Asia-Pacific is forecast to expand at a 5.02% CAGR from 2026-2031, driven by harmonised regulations and growing nutraceutical demand.
Why are cyclodextrins gaining momentum?
Regulatory approvals for cyclodextrin-based drug delivery systems enhance solubility and extend release, driving a 4.92% CAGR for this segment.
Page last updated on:


 Your data is secure and never sold or shared.


