Market Overview
| Study Period | 2020 - 2031 |
|---|---|
| Market Volume (2026) | 186.99 Million units |
| Market Volume (2031) | 269.90 Million units |
| Growth Rate (2026 - 2031) | 7.62% CAGR |
| Fastest Growing Market | Africa |
| Largest Market | Asia Pacific |
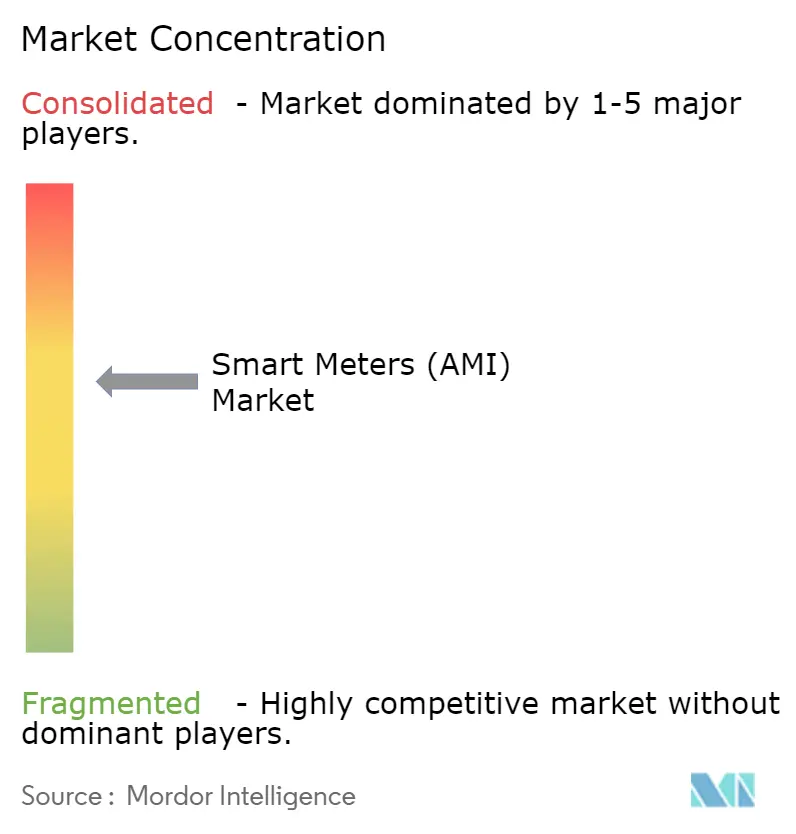
| Market Concentration | Medium |
Major Players *Disclaimer: Major Players sorted in no particular order Image © Mordor Intelligence. Reuse requires attribution under CC BY 4.0. | |

Smart Meters (AMI) Market Analysis by Mordor Intelligence
The smart meters market size reached USD 186.99 Million Units in 2026 and is projected to climb to USD 269.90 Million Units by 2031, translating into a 7.62% CAGR over the period. Adoption is accelerating because digitized interval data creates new demand-response revenue, slashes non-technical losses, and satisfies government obligations that tie cost recovery to advanced metering infrastructure roll-outs. Growing distributed energy resources and behind-the-meter solar are pushing distribution companies toward bi-directional measurement that legacy electromechanical devices cannot provide. Municipal water systems, grappling with 20%–40% non-revenue water, are turning to acoustic leak sensors coupled with cellular meters, while telecom operators are driving down connectivity costs by repurposing 4G and 5G spectrum for utility data. Semiconductor shortages eased in 2025, yet utilities continue to dual-source chips and vertically integrate assembly to insulate projects from future shocks. Finally, ESG-linked financing now requires verifiable consumption data, prompting even capital-constrained distribution companies to digitize billing and grid-edge analytics.
Key Report Takeaways
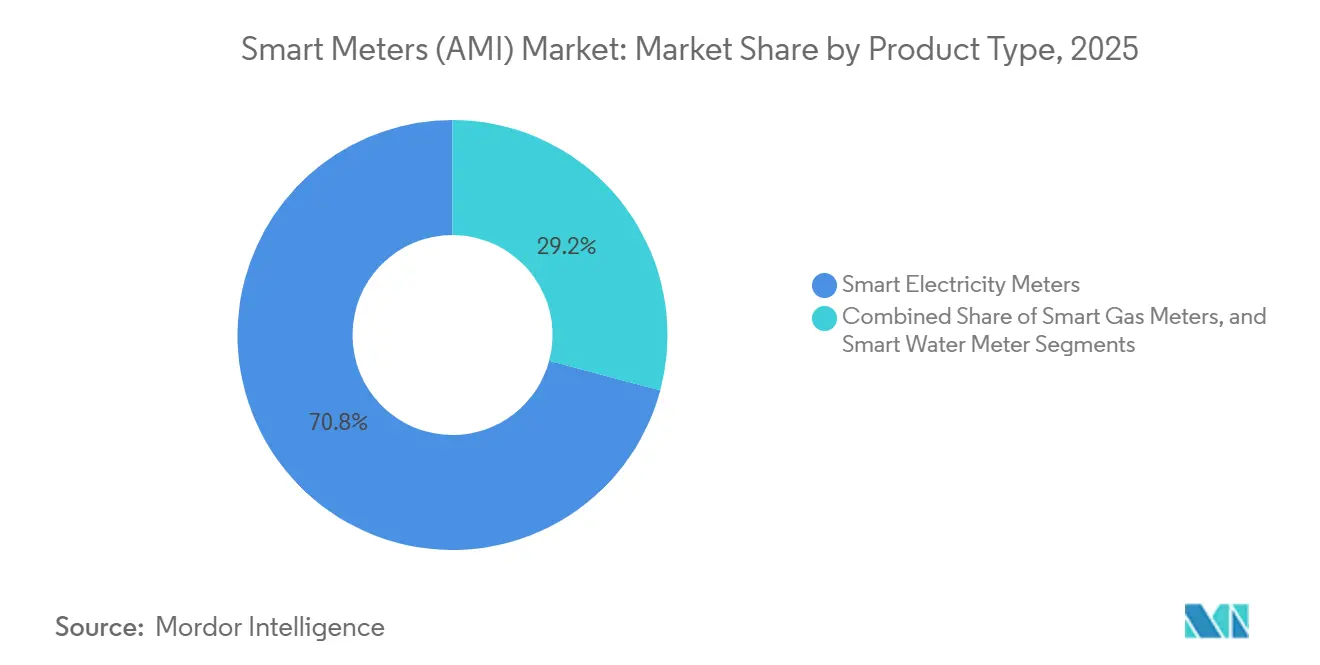
- By product type, smart electricity meters held 70.84% of the smart meters market share in 2025, while smart water meters are forecast to expand at a 9.62% CAGR through 2031.
- By communication technology, RF mesh accounted for 57.24% of the smart meters market share in 2025; narrowband IoT is projected to grow at an 8.02% CAGR to 2031.
- By component, hardware captured 62.56% share of the smart meters market size in 2025, whereas software is poised to post a 9.24% CAGR through 2031.
- By end-user, residential installations represented 72.44% of the smart meters market share in 2025, yet the industrial and utility segment is expected to advance at a 9.42% CAGR to 2031.
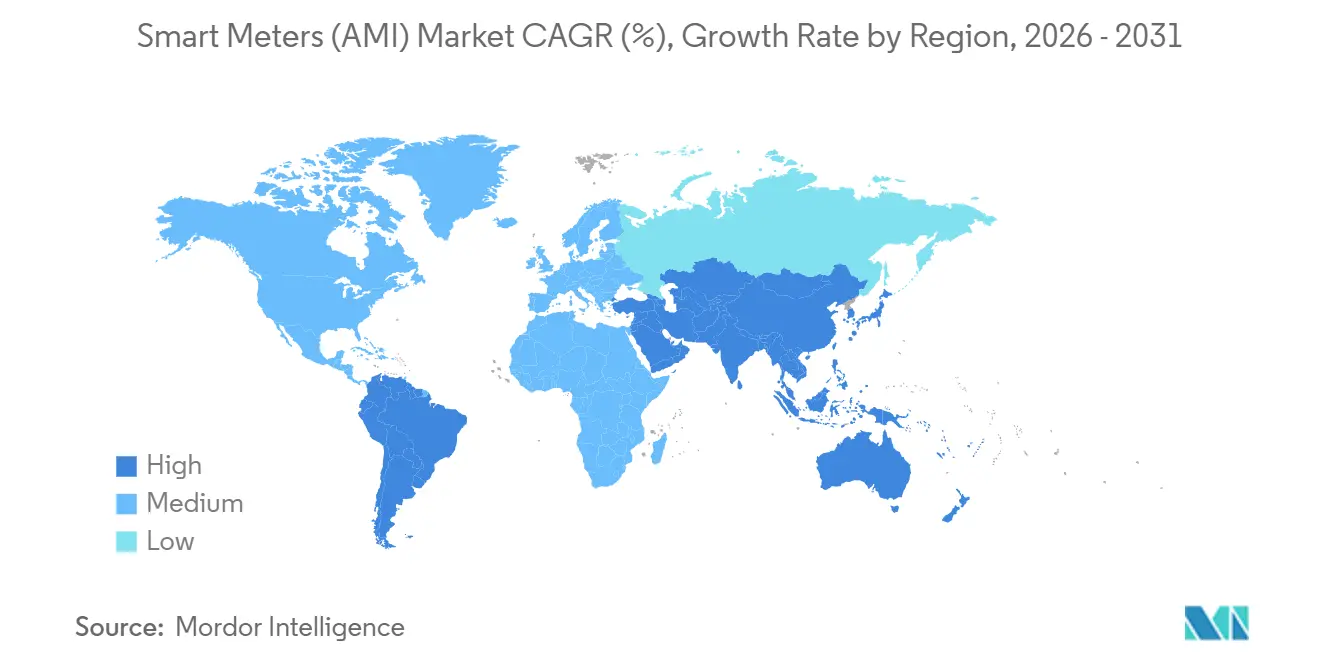
- By geography, Asia Pacific commanded 48.58% of the smart meters market share in 2025, and Africa is projected to record the fastest 8.44% CAGR through 2031.
Note: Market size and forecast figures in this report are generated using Mordor Intelligence’s proprietary estimation framework, updated with the latest available data and insights as of January 2026.
Global Smart Meters (AMI) Market Trends and Insights
Drivers Impact Analysis
| Driver | ( ~ ) % Impact on CAGR Forecast | Geographic Relevance | Impact Timeline |
|---|---|---|---|
| Government Mandates for Nationwide Roll-outs | +1.8% | Global, with highest intensity in EU, China, India, and select U.S. states | Medium term (2-4 years) |
| Utility Efficiency and Non-Technical-Loss Reduction | +1.5% | Global, particularly acute in Africa, South Asia, Latin America | Short term (≤ 2 years) |
| Grid Modernisation and DER Integration Programs | +1.3% | North America, Europe, Australia, with spillover to APAC | Medium term (2-4 years) |
| Smart-City and IoT Infrastructure Expansion | +1.0% | APAC core (China, India, South Korea), Middle East (UAE, Saudi Arabia) | Long term (≥ 4 years) |
| ESG-Linked Financing Requiring Digital Metering | +0.9% | Europe, North America, with emerging adoption in Latin America | Medium term (2-4 years) |
| AI-Ready Edge Analytics Unlocking New Revenue Streams | +0.7% | North America, Europe, select APAC markets | Long term (≥ 4 years) |
| Source: Mordor Intelligence | |||
Government Mandates for Nationwide Roll-outs
Mandated deployments remain the most potent catalyst for the smart meters market. The European Union’s Energy Efficiency Directive compelled members to reach 80% penetration, extending procurement pipelines for Landis and Gyr and Itron into 2026.[1]European Commission, “Smart Grids and Meters,” europa.eu California utilities completed state-ordered programs, and Texas retail competition continues to reward real-time pricing enabled by AMI. China’s State Grid scheduled replacement of 300 Million meters during 2024-2029 to accommodate vehicle-to-grid functionality, a move absorbing capacity from Hexing Electrical and Wasion Holdings. India earmarked INR 3.03 Trillion (USD 36.4 Billion) under its Revamped Distribution Sector Scheme, awarding 2025 tenders to Larsen and Toubro and Energy Efficiency Services Limited. While mandates de-risk investment, they expose vendors to political delays that can compress margins when roll-out schedules slip.
Utility Efficiency and Non-Technical-Loss Reduction
Non-technical losses drain an estimated USD 96 Billion annually, and utilities in Nigeria, South Africa, and Latin America are using tamper-proof meters and remote disconnects to address the gap.[2]World Bank, “Energy Data,” worldbank.org Abuja Electricity Distribution Company cut losses by 15% within a year after installing 500,000 prepaid meters in 2024. Eskom’s Johannesburg pilot utilized blockchain time stamping to thwart post-facto tampering, attracting interest across Kenya and Ghana. U.S. systems waste 6 Billion gallons daily, prompting Los Angeles and Phoenix to adopt acoustic leak detection that alerts crews within 15 minutes.[3]American Water Works Association, “Water Loss Control,” awwa.org Operational savings often recoup annualized AMI costs inside five years, making loss reduction a self-funding driver in cash-strapped territories.
Grid Modernization and DER Integration Programs
The shift from unidirectional to bidirectional grids has elevated meters from billing devices to grid-stabilization sensors. California’s Rule 21 revisions require IEEE 2030.5 compliant communication, effectively mandating smart meters in all new distributed energy resource interconnections. Germany’s Messstellenbetriebsgesetz obliges households exceeding 7 kW solar capacity to install certified gateways, widening the order book for Landis and Gyr and EMH Metering. Australia committed AUD 200 Million (USD 130 Million) in 2025 to pilot dynamic operating envelopes that rely on sub-minute meter data to prevent voltage rise on low-voltage feeders. Collectively, these programs justify premium analytics licenses and open recurring software revenue streams.
Smart-City and IoT Infrastructure Expansion
Cities are embedding meters within converged IoT platforms to amortize connectivity costs across multiple applications. Dubai installed 1.2 Million electricity and water meters on a common NB-IoT backbone that also serves parking sensors and waste bins. South Korea’s K-City testbed integrates vehicle-to-grid chargers with residential meters, deferring a planned USD 150 Million substation upgrade. China selected 100 pilot cities where State Grid mandates that new meters host multi-application firmware, giving full-stack suppliers such as Huawei and Siemens a competitive edge.
Restraints Impact Analysis
| Restraint | ( ~ ) % Impact on CAGR Forecast | Geographic Relevance | Impact Timeline |
|---|---|---|---|
| High Upfront CAPEX and Long Payback Cycles | -1.2% | Global, most acute in Sub-Saharan Africa, South Asia, parts of Latin America | Short term (≤ 2 years) |
| Cyber-Security and Data-Privacy Risks | -0.8% | North America, Europe, with rising concern in APAC | Medium term (2-4 years) |
| Legacy Grid and IT Integration Complexity | -0.6% | North America, Europe, select APAC markets with aging infrastructure | Medium term (2-4 years) |
| Semiconductor Supply-Chain Volatility | -0.5% | Global, with highest impact in 2024-2025 | Short term (≤ 2 years) |
| Source: Mordor Intelligence | |||
High Upfront CAPEX and Long Payback Cycles
All-in deployment costs range from USD 150 to USD 300 per endpoint, translating into USD 150 Million-USD 300 Million for a 1 Million-customer utility. Payback can stretch to 8-12 years if regulators prohibit time-of-use tariffs or resource adequacy payments. Kenya Power paused a 3 Million-meter tender in 2024 after its National Treasury withheld loan guarantees over debt concerns. Argentina’s Córdoba and Mendoza utilities similarly downsized tenders in 2025 after peso depreciation inflated imported meter costs by 40%. Water utilities feel an even tighter squeeze because cost-of-service rules cap returns at 6%-8%, limiting capital formation without subsidies.
Cyber-Security and Data-Privacy Risks
Granular usage profiles reveal occupancy patterns, triggering privacy pushback. NISTIR 7628 Revision 1 in 2024 mandated end-to-end encryption and secure firmware, adding USD 8–USD 12 per device. Europe’s NIS2 Directive requires incident reporting within 24 hours and can fine utilities up to 2% of global turnover for non-compliance. A 2025 ransomware event encrypted billing records for 200,000 U.S. meters, forcing estimated bills and sparking a class action. California and Germany now allow opt-outs, fragmenting installed bases and complicating demand-response aggregation.
Segment Analysis
By Product Type: Water Meters Narrow the Gap
Smart electricity meters commanded 70.84% share in 2025, reflecting decades of regulatory focus. The segment has reached high penetration in many developed grids, so growth aligns mainly with replacement cycles. Smart water meters, by contrast, are poised for a 9.62% CAGR to 2031 as cities target non-revenue water that often exceeds 30% of supply. Acoustic leak detection embedded in meters deployed by Los Angeles and Singapore in 2024-2025 demonstrated sub-15-minute burst identification, enabling crews to triage repairs without wholesale main replacement. Gas meters remain smaller in volume, yet Europe’s Gas Directive drove nationwide roll-outs in Italy and the Netherlands by 2025, validating remote shut-off as a safety and billing tool.
Many municipalities still rely on quarterly manual reads or flat-rate billing, leaving substantial digital headroom. Compliance with ISO 24516 leak detection targets in the Middle East and Southern California adds urgency. Gas meter adoption remains constrained by lower energy density and minimal price differentiation throughout the day, reducing the benefit of granular interval data. However, safety regulations are nudging utilities toward automated shut-off, which could bolster smart gas penetration over the next decade.
Note: Segment shares of all individual segments available upon report purchase
Get Detailed Market Forecasts at the Most Granular Levels
Download PDF
By Communication Technology: Cellular Gains on Mesh
RF mesh technology held a 57.24% share in 2025 because self-healing topology minimizes the need for licensed spectrum and supports dense urban deployments. Even so, narrowband IoT is projected to advance at an 8.02% CAGR through 2031. Vodafone and China Mobile slashed per-device data tariffs below USD 1 per month in 2024, realigning total cost of ownership and enabling utilities to outsource network operations. Power-line communication retains a foothold in European markets favoring PRIME and G3-PLC protocols, yet noisy feeders in parts of Asia and Africa limit scalability. Low-power wide-area networks such as LoRaWAN fill rural gaps but suffer from ecosystem fragmentation and limited roaming.
Utilities increasingly prefer cellular because 3GPP Release 17 extends battery life past 10 years while guaranteeing 99.5% uptime. The model converts capital outlay for private mesh into a predictable operating expense, aligning with regulatory requirements that favor rate-base efficiency. Mesh will remain relevant where density justifies localized relay, yet the growth trajectory clearly tilts toward licensed cellular platforms.
By Component: Software Outpaces Hardware
Hardware generated 62.56% of 2025 revenue, covering meters, communication modules, and concentrators. Software encompassing meter-data-management, head-end systems, and edge analytics is projected to rise at a 9.24% CAGR through 2031. Utilities are migrating to cloud-hosted platforms from vendors such as Oracle and Itron that apply machine learning for anomaly detection, demand forecasting, and outage restoration. Managed services agreements appeal to smaller utilities lacking internal IT capacity, effectively bundling software and operations into subscription models.
The pivot mirrors a broader commoditization trend. Chinese manufacturers continue to compress unit hardware prices, prompting Western incumbents to emphasize analytics that unlock value from existing assets. Participation in wholesale markets under the U.S. Federal Energy Regulatory Commission’s Order 2222 requires time-synchronized data, further elevating the role of software. As value shifts, software revenue grows faster than hardware, reshaping vendor profit pools toward recurring fees.

Note: Segment shares of all individual segments available upon report purchase
Get Detailed Market Forecasts at the Most Granular Levels
Download PDF
By End-User: Industrial Segment Accelerates
Residential roll-outs accounted for 72.44% of installations in 2025, driven by European and North American mandates. Growth in this segment is moderating as penetration climbs beyond 50% in developed economies. Industrial and utility customers are set to grow at a 9.42% CAGR to 2031 because ISO 50001 certification and participation in ancillary service markets demand sub-minute interval data. Data centers owned by Amazon Web Services and Microsoft Azure installed one-second granularity sub-metering in 2024 to track power usage effectiveness and qualify for green certificates. Commercial buildings, roughly 35% of global electricity consumption, need smart meters to comply with standards such as New York City’s Local Law 97, which imposes carbon caps and fines.
Industrial clients offer higher average revenue per unit and willingly pay for power quality monitoring and harmonic analysis. Utilities in deregulated markets have begun offering performance-based contracts that share savings from load optimization, aligning incentives and accelerating adoption. Residential replacements will sustain volume in mature regions; however, the strongest incremental growth will come from service-oriented industrial deals that monetize data rather than kilowatt-hours.
Geography Analysis
Asia Pacific secured 48.58% of the smart meters market share in 2025, powered by China’s 14th Five-Year Plan and India’s Revamped Distribution Sector Scheme. State Grid deployed 280 Million meters during 2020-2025, enabling time-of-use tariffs that shifted 12% of residential load to off-peak hours. Japan and South Korea, early adopters, are now upgrading first-generation devices to support vehicle-to-grid aggregation. Southeast Asia remains uneven; Thailand and Vietnam launched pilots in 2024 but face funding gaps, while Australia and New Zealand completed mandatory roll-outs by 2024 with a focus on rooftop solar integration.
Africa is the fastest expanding region at 8.44% CAGR to 2031. Nigeria’s Meter Asset Provider program financed 4 Million prepaid meters, trimming aggregate losses from 35% to 28% inside 18 months. South Africa’s split-prepaid systems allow mobile money purchases and remote disconnect, an approach Kenya, Ghana, and Tanzania are now testing. Egypt awarded Elsewedy Electric a USD 300 Million contract in 2025 to supply 5 Million meters under African Development Bank financing. Political risk and currency volatility temper near-term volume, but demographic growth and electrification targets underpin long-run demand.
Europe maintained 22% share in 2025. Scandinavia, the United Kingdom, and Italy achieved near-universal penetration, while Germany, France, and Spain are midway through compliance with the Energy Efficiency Directive. Eastern European cohesion funds propelled Poland and Romania into tenders during 2024-2025. North America captured roughly 18%, with the United States approaching saturation in investor-owned utility territories but lagging in municipal and cooperative systems. Canada finished provincial roll-outs by 2024, whereas Mexico’s Comisión Federal de Electricidad targets 10 Million meters by 2027. South America and the Middle East each accounted for 5%–7% of revenues, with Brazil, Argentina, Saudi Arabia, and the United Arab Emirates driving localized initiatives.
Get Analysis on Important Geographic Markets
Download PDF
Competitive Landscape
The market remains moderately fragmented. The top five suppliers—Landis and Gyr, Itron, Sensus, Honeywell, and Kamstrup—controlled about 40% of global revenue in 2025. Chinese manufacturers such as Hexing Electrical, Wasion Holdings, and Holley Technology dominate Asia Pacific by leveraging 30%–40% lower unit costs through vertical integration. Western incumbents are pivoting to software-as-a-service; Itron’s 2024 acquisition of Comverge added demand-response algorithms, while Landis and Gyr bundles analytics that enable participation in wholesale capacity markets.
Technology differentiation is shifting toward artificial intelligence and digital twins. Siemens and Schneider Electric integrate meters into simulation platforms that let utilities test distributed energy scenarios before field deployment. Compliance with IEC 62052 and IEC 62056 remains mandatory, yet vendors pursue proprietary enhancements such as Landis and Gyr’s Gridstream mesh and Itron’s OpenWay Riva multi-protocol stack. Patent activity in 2024-2025 clustered around edge computing, blockchain settlement, and quantum-resistant encryption, anticipating future cybersecurity mandates and positioning suppliers for premium margins once standards mature.
Telecom operators are emerging disruptors. Vodafone and China Mobile bundle narrowband IoT connectivity with hardware, undercutting total ownership cost by 20%–30% and thus loosening the historical grip of meter-only vendors. Water metering and rural electrification programs in Sub-Saharan Africa and South Asia represent white-space opportunities where prepaid platforms and mobile money integration can leapfrog conventional billing. Vendors agile enough to package hardware, connectivity, and analytics stand to gain share as utilities seek turnkey solutions that spread risk across the value chain.
Smart Meters (AMI) Industry Leaders
Landis+Gyr Group AG
Itron Inc.
Sensus USA Inc. (Xylem Inc.)
Honeywell (Elster Group)
Kamstrup A/S
- *Disclaimer: Major Players sorted in no particular order
Need More Details on Market Players and Competitors?
Download PDF
Recent Industry Developments
- January 2026: Landis and Gyr won a USD 180 Million contract to deliver 3 Million prepaid meters for Uttar Pradesh and Bihar, installation slated through Dec 2027.
- December 2025: Itron closed its USD 45 Million acquisition of GridKey, adding low-voltage monitoring to its portfolio.
- November 2025: Siemens secured a EUR 120 Million (USD 128 Million) deal with E.ON for 2.5 Million gateways compliant with German law.
- October 2025: Sensus launched the Ally water meter with acoustic leak detection and commenced a Los Angeles pilot.
Research Methodology Framework and Report Scope
Market Definitions and Key Coverage
Our study defines the smart meter market as utility-owned electronic meters that record electricity, gas, or water usage in preset intervals and transmit data through two-way networks to the utility head-end for billing, analytics, and remote service actions. We cover factory-built meters that follow ANSI C12, DLMS/COSEM, or equivalent protocols and integrate RF-Mesh, PLC, cellular NB-IoT, or similar communication modules.
Devices used only for building sub-metering, retrofit communication add-ons, and electromechanical meters without digital telemetry are excluded.
Segmentation Overview
- By Product Type
- Smart Electricity Meters
- Smart Gas Meters
- Smart Water Meters
- By Communication Technology
- RF Mesh
- Power-Line Communication (PLC)
- Cellular (2G-5G / NB-IoT / LTE-M)
- Low-Power Wide Area (LoRaWAN / Sigfox / Wize)
- By Component
- Hardware
- Software
- Services
- By End-User
- Residential
- Commercial
- Industrial and Utilities
- By Geography
- North America
- United States
- Canada
- Mexico
- South America
- Brazil
- Argentina
- Rest of South America
- Europe
- Germany
- United Kingdom
- France
- Italy
- Spain
- Russia
- Rest of Europe
- Asia Pacific
- China
- Japan
- India
- South Korea
- Australia and New Zealand
- Southeast Asia
- Rest of Asia Pacific
- Middle East
- Saudi Arabia
- United Arab Emirates
- Turkey
- Rest of Middle East
- Africa
- South Africa
- Nigeria
- Egypt
- Rest of Africa
- North America
Detailed Research Methodology and Data Validation
Primary Research
We spoke with distribution utilities across Asia Pacific, module suppliers in Europe, and regulators in North America. Those conversations clarified annual procurement plans, average selling prices, favored communication stacks, and looming policy tweaks, letting us cross-verify secondary numbers.
Desk Research
We gathered baseline figures by tapping freely available datasets from the International Energy Agency, Eurostat's rollout dashboard, the US EIA advanced metering file, India's RDSS tender portal, and trade tallies linked to HS codes. Our team also reviewed tariff filings, utility annual reports, and policy briefs, while D&B Hoovers, Dow Jones Factiva alerts, and Questel patent counts helped benchmark producer capacity and technology shifts. This list is illustrative; many additional sources underpinned data checks and clarifications.
A second pass compared regional adoption ratios with customs shipment trends and manufacturer disclosures, allowing us to spot gaps early.
Market-Sizing & Forecasting
The 2024 installed base was rebuilt through a top-down meter penetration audit against grid connections, then validated by selective bottom-up shipment samples from leading vendors. Key inputs include new service connections, mandated replacement cycles, chipset import volumes, typical meter life, and observed ASP drift. A multivariate regression links connection growth and policy scores to project 2025-2030 demand, while scenario analysis cushions chip-supply swings. Where supplier samples under-cover a region, interpolation is constrained by historical penetration ceilings.
Data Validation & Update Cycle
Variance dashboards flag anomalies over three percentage points, prompting re-contact of respondents before sign-off. Mordor analysts refresh every study each year and issue interim tweaks when major tenders or mandates surface.
Why Mordor's Smart Meters (AMI) Baseline Commands Reliability
Published estimates often diverge because firms alternate between unit and revenue metrics, widen scope to software, or carry forward assumptions for years. We update yearly and stay disciplined on metric choice, which keeps our figures grounded.
Key gap drivers include metric selection (Mordor reports unit shipments), inclusion of aftermarket upgrades elsewhere, differing ASP curves, and slower refresh cadence among other publishers.
Benchmark comparison
| Market Size | Anonymized source | Primary gap driver |
|---|---|---|
| 173.29 million units (2025) | Mordor Intelligence | - |
| USD 26.36 billion (2024) | Global Consultancy A | Revenue metric that folds in software and services, five-year refresh |
| USD 27.70 billion (2024) | Regional Consultancy B | Limited country sample, no utility primary checks |
| USD 32.57 billion (2024) | Industry Journal C | Aggressive policy scenario, flat ASP assumption |
The comparison shows that by anchoring scope, variables, and yearly validation, Mordor Intelligence delivers a balanced, transparent baseline clients can trust for planning and investment decisions.
Need A Different Region or Segment?
Customize Now
Key Questions Answered in the Report
What is the projected value of the Smart Meters (AMI) Market in 2031?
It is forecast to reach USD 269.90 Million units, reflecting a 7.62% CAGR from 2026.
Which communication technology is expected to grow fastest through 2031?
Narrowband IoT is projected to expand at an 8.02% CAGR, outpacing RF mesh.
Why are smart water meters gaining momentum?
Municipal utilities seek to curb non-revenue water that can exceed 30%, and acoustic leak detection embedded in smart water meters enables rapid pipe repair.
Which region is the fastest growing for deployments?
Africa leads with an 8.44% CAGR as prepaid smart meters improve cost recovery and reduce theft.
How are vendors differentiating as hardware commoditizes?
Leading suppliers emphasize software-as-a-service, edge analytics, and digital twin platforms that monetize data rather than hardware margins.
What key challenge delays adoption in emerging markets?
High upfront capital expenditure of USD 150–USD 300 per endpoint extends payback periods to up to 12 years when regulatory revenue mechanisms are absent.


