
Shopping Tourism Market Size and Share
Market Overview
| Study Period | 2022 - 2032 |
|---|---|
| Market Size (2027) | USD 317.24 Billion |
| Market Size (2032) | USD 498.45 Billion |
| Growth Rate (2027 - 2032) | 9.46 % |
| Fastest Growing Market | Asia-Pacific |
| Largest Market | Asia-Pacific |
| Market Concentration | Low |
Major Players *Disclaimer: Major Players sorted in no particular order Image © Mordor Intelligence. Reuse requires attribution under CC BY 4.0. | |
Shopping Tourism Market Analysis by Mordor Intelligence
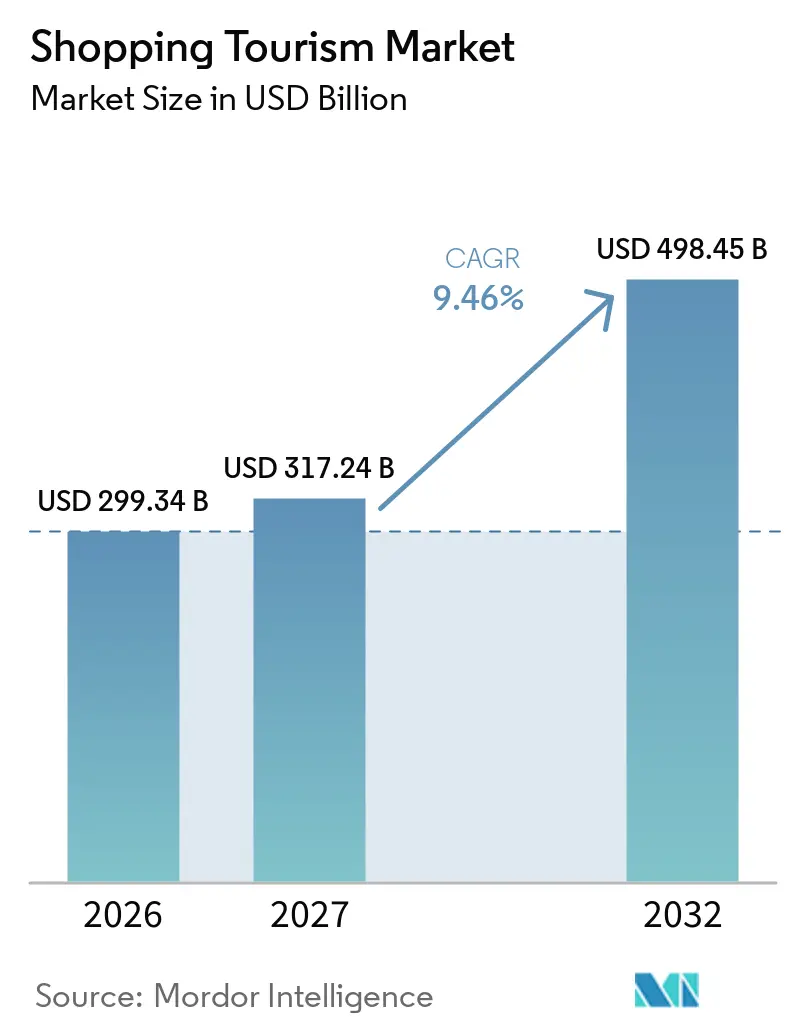
The global shopping tourism market size was valued at USD 299.34 billion in 2026 and is estimated to grow from USD 317.24 billion in 2027 to reach USD 498.45 billion by 2032, at a CAGR of 9.46% during the forecast period 2027 to 2032. The global shopping tourism market is supported by destination-led retail spending, tax-free shopping opportunities, and the integration of shopping into leisure travel. The Singapore Tourism Board reported a 5% year-on-year increase in shopping expenditure from January to September 2024. In Europe, tax-free shopping expenditure rose by 5% in 2025, while spending on watches and jewelry increased by 14%. India’s Domestic Tourism Expenditure Survey for July 2025–June 2026 found that shopping accounted for 26% of same-day trips and represented 51% of rural and 41% of urban same-day trip expenditure[1]. These trends create opportunities for destination malls, outlet centres, airport retail, and local shopping districts. Market competitiveness increasingly depends on product assortment, accessibility, convenient payment options, and tax-refund services.
Key Report Takeaways
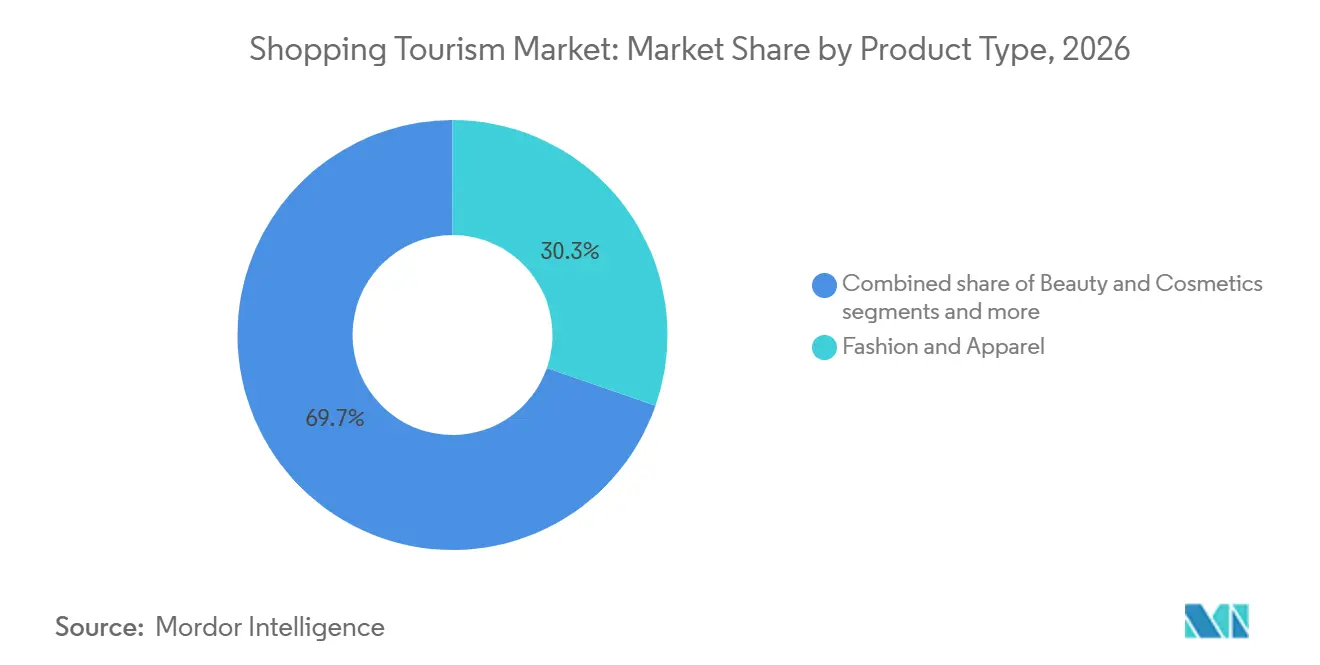
- By product type, fashion and apparel accounted for 30.34% of the global shopping tourism market share in 2026, while beauty and cosmetics are projected to grow at a 10.34% CAGR through 2032.
- By shopping destination, shopping malls and retail complexes accounted for 42.21% of the global shopping tourism market share in 2026, while outlet malls and factory outlets are projected to grow at a 10.45% CAGR through 2032.
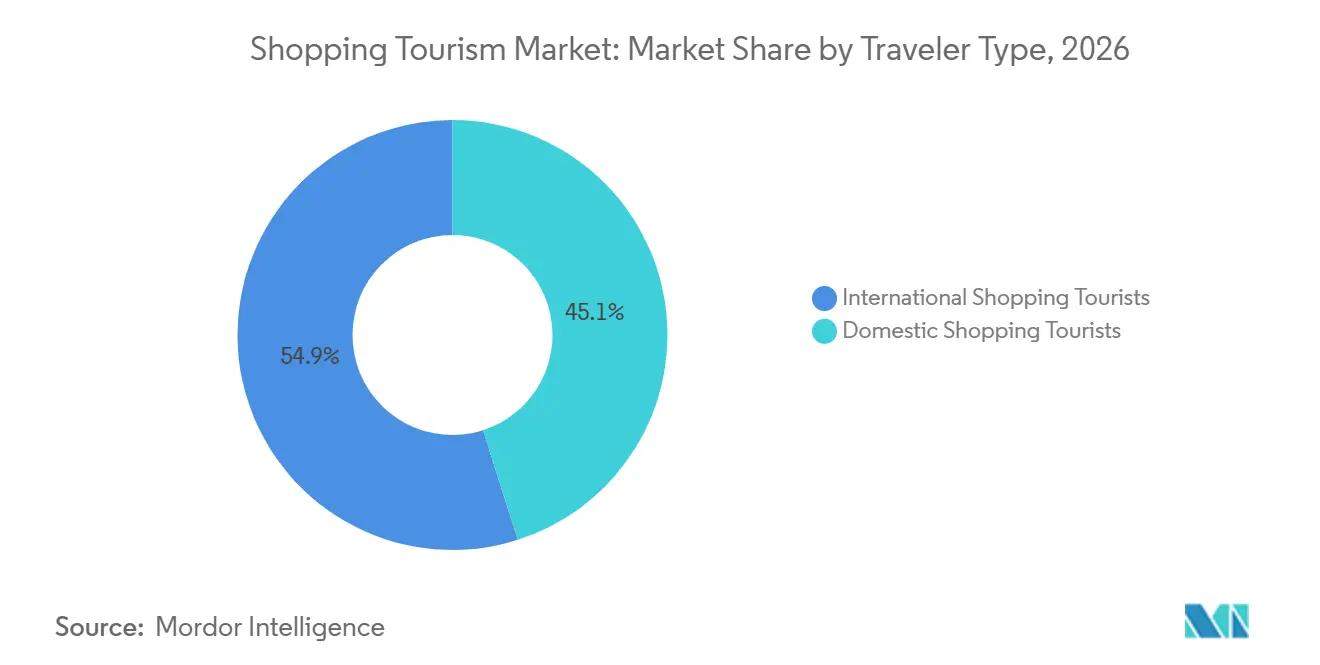
- By traveler type, international shopping tourists accounted for 54.92% of the global shopping tourism market share in 2026, while domestic shopping tourists are projected to grow at a 10.93% CAGR through 2032.
- By geography, Asia-Pacific accounted for 32.24% of the global shopping tourism market share in 2026 and is projected to grow at an 11.13% CAGR through 2032.
Note: Market numbers in this report are based on Mordor Intelligence's proprietary estimation framework, which combines nine months of actuals with Q4 projections for base year 2026.
Global Shopping Tourism Market Trends and Insights
Drivers Impact Analysis*
| Driver | (~) % Impact on CAGR Forecast | Geographic Relevance | Impact Timeline |
|---|---|---|---|
| Rising International Tourist Arrivals and Passenger Throughput | +2.5% | Global | Medium term (2-4 years) |
| Expansion of Travel Retail Infrastructure and Shopping Destinations | +2.0% | Global, with highest intensity in Asia-Pacific and the Middle East | Long term (≥ 4 years) |
| Growth in Disposable Income and Premium Spending | +1.8% | Asia-Pacific, North America, and Europe | Long term (≥ 4 years) |
| Duty-Free, Tax-Refund and Visa Facilitation Policies | +1.5% | Asia-Pacific, with spillover to the Middle East and Europe | Medium term (2-4 years) |
| Social-Commerce-Led Pre-Trip Product Discovery | +1.0% | Global, with strongest relevance in Asia-Pacific | Short term (≤ 2 years) |
| Retailtainment and Destination-Linked Shopping Experiences | +0.8% | Global, concentrated in the Gulf, Southeast Asia, and Europe | Long term (≥ 4 years) |
| Source: Mordor Intelligence | |||
Rising International Tourist Arrivals and Passenger Throughput
The global shopping tourism market is increasingly influenced by airport retail spending patterns and travelers’ purchasing preferences. According to Airports Council International (ACI) Asia-Pacific & Middle East, passenger spending per traveler at Asia-Pacific airports during January-October 2025 was 13% higher than in 2019, while domestic passenger traffic increased by only 2%. The study also found that approximately 70% of airport retail purchases were impulse-driven. Product selection accounted for 39% of purchase motivation, while pricing and promotions accounted for 29%[2]. These trends create opportunities for airport retailers, destination malls, and duty-free operators to enhance product assortments, implement targeted promotions, and provide convenient purchasing experiences. By aligning retail strategies with traveler profiles and regional preferences, operators can increase spending per visitor rather than relying solely on higher footfall.
Expansion of Travel Retail Infrastructure and Shopping Destinations
The global shopping tourism market expands as new terminals, retail concessions, outlet centers, and mall complexes create spending opportunities. In 2025, more than 850 airports across 90 countries involved private-sector commercial participation, while the global pipeline included 132 airport development transactions in January. These developments can expand retail options for passengers before and after flights. Lagardère Travel Retail expanded from 3 to 10 airports in Saudi Arabia in 2025, reflecting airport retail development in the Gulf[3]. Simon Property Group opened Jakarta Premium Outlets in March 2025, its first outlet location in Indonesia. India can link airport, high-street, outlet, and mall developments with leisure corridors rather than treating each asset as a separate retail location.
Growth in Disposable Income and Premium Spending
The global shopping tourism market is influenced by cross-border price differences, product availability, and shopping-led travel experiences. Swiss residents spent nearly CHF 9.2 billion (USD 11.65 billion) on cross-border shopping in 2025, approximately 10% more than in 2022. Food purchases accounted for nearly CHF 4 billion (USD 5.06 billion), highlighting the importance of price competitiveness in shopping decisions. These patterns demonstrate how product pricing and availability influence consumer spending across destinations. In India, destination malls, outlet centres, airport retail, and local shopping districts can attract travelers through distinctive product assortments, convenient access, competitive pricing, and locally relevant retail experiences.
Duty-Free, Tax-Refund and Visa Facilitation Policies
The global shopping tourism market responds to policies that reduce the cost and effort of cross-border purchases. In 2025, Japan recorded JPY 2.5 trillion (USD 0.016 trillion) in inbound shopping expenditure, accounting for 27% of total visitor spending. Tax-free shopping sales in Asia-Pacific rose 46% in January 2025, including increases of 72% in South Korea and 56% in Japan. Clear regulations, efficient verification, and predictable allowances support purchase decisions, while complex procedures can deter high-value purchases requiring documentation. Indian policymakers and airport operators can improve retail conversion by clearly communicating eligibility, refund procedures, and customs requirements before travelers make purchases.
Restraints Impact Analysis*
| Restraint | (~) % Impact on CAGR Forecast | Geographic Relevance | Impact Timeline |
|---|---|---|---|
| Economic Volatility and Currency-Rate Fluctuations | -0.6% | Global, most acute in the Americas and East Asia | Short term (≤ 2 years) |
| Complex Customs, Tax and Cross-Border Compliance Requirements | -0.4% | Global, most severe in South America and South and Southeast Asia | Medium term (2-4 years) |
| Carry-On Restrictions and Limited Traveler Baggage Capacity | -0.2% | Global | Short term (≤ 2 years) |
| High Concession Fees and Uneven Retail Infrastructure at Travel Hubs | -0.3% | Middle East, South America, and Sub-Saharan Africa | Long term (≥ 4 years) |
| Source: Mordor Intelligence | |||
Economic Volatility and Currency-Rate Fluctuations
Currency fluctuations can rapidly alter the value proposition in the global shopping tourism market. Avolta reported that North America accounted for 30% of its CORE turnover in 2025, while currency movements and weaker consumer sentiment affected organic growth. Exchange rate shifts can make the same product affordable for one visitor and expensive for another. In 2025, favorable currency conditions supported strong inbound shopping expenditure in Japan. Conversely, unfavorable currency movements can reduce retail spending even when visitor arrivals remain stable. Indian operators can mitigate this exposure by emphasizing product exclusivity, service quality, and local relevance alongside price comparisons.
Complex Customs, Tax and Cross-Border Compliance Requirements
Differences in tax-refund procedures, customs declarations, and duty-free allowances can complicate international travelers’ purchasing decisions. Documentation requirements and uncertainty about refund eligibility may delay transactions and discourage high-value purchases. These issues can reduce conversions at airport retail stores, downtown duty-free outlets, outlet centers, and cross-border shopping destinations. Digital tax-refund systems, clear eligibility information, and streamlined customs procedures can improve purchase confidence and reduce administrative barriers. In India, multilingual guidance and digital documentation can help international visitors understand requirements and complete retail transactions efficiently.
*Our forecasts treat driver/restraint impacts as directional, not additive. The impact forecasts reflect baseline growth, mix effects, and variable interactions.
Consumer Behavior Analysis
Shopping tourism demand varies by destination appeal, product preferences, and visitor spending patterns. In Singapore, shopping receipts increased by 5% in 2024, accounting for approximately 17% of total tourism receipts. Shopping represented 28% of tourism receipts from Indian visitors, 31% from Indonesian visitors, and 25% from mainland Chinese visitors, underscoring the need to tailor retail assortments to source-market preferences.
Swiss residents spent nearly CHF 9.2 billion (USD 11.65 billion) on cross-border retail shopping in 2025, approximately 10% more than in 2022. Food purchases reached almost CHF 4 billion (USD 5.06 billion), while online cross-border purchases grew 10% to CHF 1.6 billion (USD 2.03 billion). Perceived price advantages and demand for everyday products influence destination choices, enabling retailers to compete through pricing, product availability, and differentiated merchandise.
Shopping Tourism Performance Intelligence
Japan welcomed 42.7 million international visitors in 2025, generating approximately JPY 9.5 trillion (USD 0.061 trillion) in inbound tourism expenditure. This creates opportunities for destination malls, department stores, and regional shopping districts to attract visitors through locally distinctive products, tax-free shopping, and multilingual services. In India, aligning retail offerings with major tourist corridors can help convert visitor growth into retail sales.
Length of stay influences shopping opportunities and potential expenditure per visitor. In Japan, international visitors stayed an average of 9.5 nights in 2025, spending approximately JPY 228,782 (USD 1,464.66) per person, including JPY 61,136 (USD 391.39) on shopping. German visitors stayed an average of 18 nights and spent approximately JPY 392,251 (USD 2,511.18) per trip. These differences highlight the value of tailoring retail offerings to visitor origin and trip duration, although longer stays alone do not guarantee higher shopping expenditure.
Segment Analysis
By Product Type: Beauty Gains Ground at Fashion’s Margins
Fashion and Apparel held 30.34% of the global shopping tourism market share in 2026. The category benefits from broad demand across age groups, travel purposes, and price points. Apparel and accessories work across airport concessions, mall formats, high streets, and outlet centers. Their performance also depends on assortment because travelers may seek global labels, destination-specific goods, or value offers. The category has an advantage where retailers can provide convenient fitting, clear sizing, and packaging suited to travel.
Beauty and Cosmetics is projected to grow at a 10.34% CAGR through 2032. Fragrances and cosmetics generated USD 6.49 billion in global airport-shop sales in the first half of 2025. The category benefits from gift buying, self-purchase, compact product formats, and frequent new launches. Beauty purchases can also respond well to services such as product trials and personalized recommendations. For Indian travelers and visitors, the category can gain when brands pair familiar products with credible local, wellness, or premium offerings.

By Shopping Destination: Outlet Centres Redefine Value Tourism
Shopping malls and Retail Complexes accounted for 42.21% of the global shopping tourism market size in 2026. These locations combine retail, food, services, and entertainment within a single destination. This makes them suitable for families, groups, and visitors with time to spend beyond a single transaction. Malls can also provide a controlled environment where payments, security, wayfinding, and transport links are simpler for unfamiliar visitors. Their role in the global shopping tourism market is strongest when tenants and activities offer more than a standard local shopping trip.
Outlet Malls and Factory Outlets are projected to expand at a 10.45% CAGR through 2032. Their appeal comes from the combination of recognized brands and value-oriented buying. Simon Property Group acquired The Mall Luxury Outlets in Italy for EUR 350 million (USD 411.71 million) in January 2025[4]. The company then opened Jakarta Premium Outlets in Indonesia in March 2025. For India, outlet development can be relevant near major visitor corridors when transport access and brand participation are reliable.
By Traveler Type: The Domestic Shopper Rewrites the Demand Equation
International Shopping Tourists accounted for 54.92% of the global shopping tourism market size in 2026. These visitors often respond to duty-free access, exchange-rate differences, exclusive ranges, and the perceived value of buying at a destination. Japan’s international visitors spent JPY 2.5 trillion (USD 0.016 trillion) on shopping in 2025, confirming the importance of this traveler group. International demand can be volatile because it is affected by air connectivity, currency, visas, and geopolitical conditions. Retailers therefore need a balanced mix of visitors and product categories.
Domestic Shopping Tourists are forecast to grow at a 10.93% CAGR through 2032. Domestic trips can support spending at malls, outlets, airports, and city-center formats even when international arrivals weaken. China’s downtown duty-free program shows how policy can extend retail demand beyond traditional outbound travel. The same principle applies when residents combine leisure travel with planned shopping. For India, domestic tourism can become a stable demand channel if retail experiences are integrated with short-break destinations, major festivals, and city travel. This growth does not replace international demand, but it can make retail economics less dependent on it.
Geography Analysis
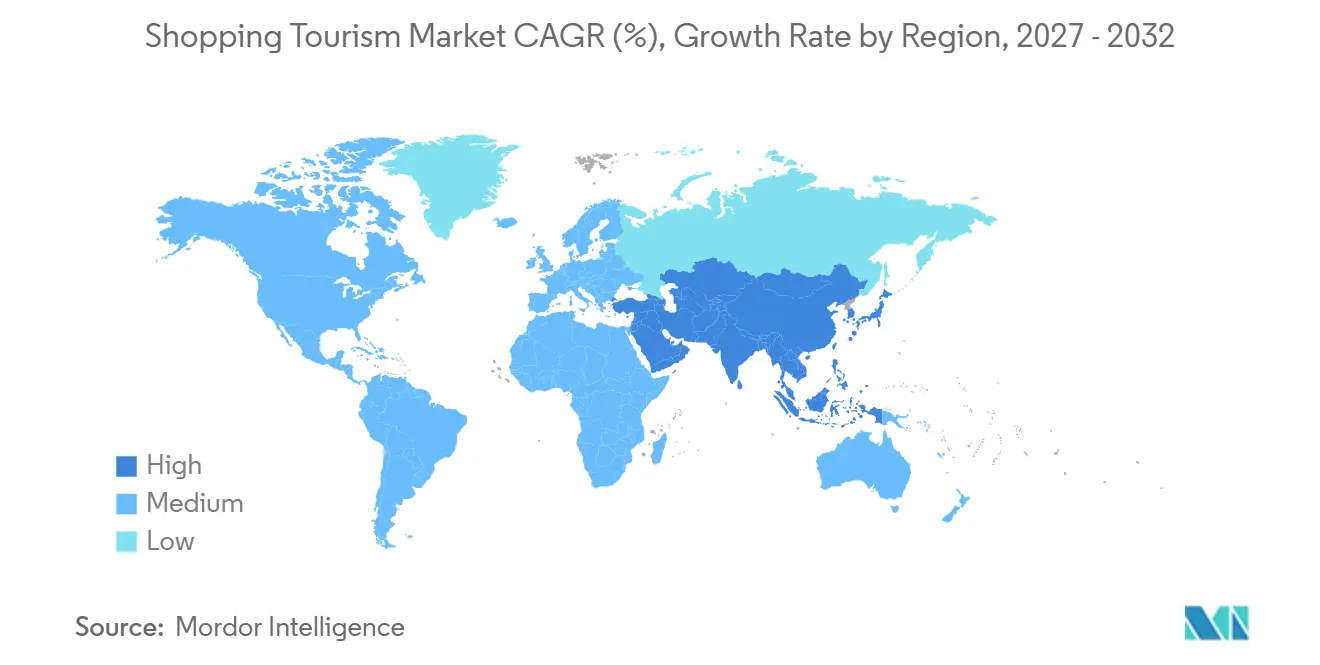
Asia-Pacific holds 32.24% of the global shopping tourism market in 2026 and is projected to grow at an 11.13% CAGR through 2032. Japan welcomed 42.7 million visitors in 2025, and shopping accounted for JPY 2.5 trillion (USD 0.016 trillion) of visitor spending. Tax-free shopping sales in Asia-Pacific rose 46% in January 2025. Large source markets, aviation connectivity, and retail networks support the region. It provides useful comparisons for India, where travelers expect digital information, branded choices, and efficient tax refund and payment processes. Europe remains an important shopping destination, combining high streets, airport retail, luxury brands, and outlet formats. It received 793 million international arrivals in 2025, while airport duty-free sales reached EUR 10.13 billion (USD 11.92 billion). Infrastructure supports demand, although regulatory and currency changes affect purchase behavior.
The Middle East approached 100 million international arrivals in 2025, 39% above pre-pandemic levels. Airport investments, destination malls, and retail events support its position. Dubai demonstrates how promotions and entertainment can integrate retail into visitor itineraries. North and South America have large domestic markets and varied cross-border travel patterns. Indian companies should assess regional differences in traveler mix, tax rules, retail access, and product demand rather than treat global footfall as a single opportunity.
Shopping Tourism Supply & Development Intelligence
Airport retail capacity is expanding with passenger traffic, but operators must prioritize spending potential alongside footfall. ACI World reported 9.8 billion global airport passengers in 2025, while an ACI Asia-Pacific & Middle East study found that 70% of airport retail purchases were impulse-driven (February 2026). In India, retail concessionaires and terminal operators can use these insights to optimize store locations, displays, promotions, and merchandise planning.
Malls and outlet centers can also drive shopping-led visits. VIA Outlets reported EUR 1.52 billion (USD 1.79 billion) in brand sales and 33 million visits across 11 destinations in nine European countries in 2025. Sales grew 4.9%, exceeding 2.5% footfall growth. In India, branded merchandise, dining, entertainment, local products, and convenient transport can support destination appeal.
Competitive Landscape
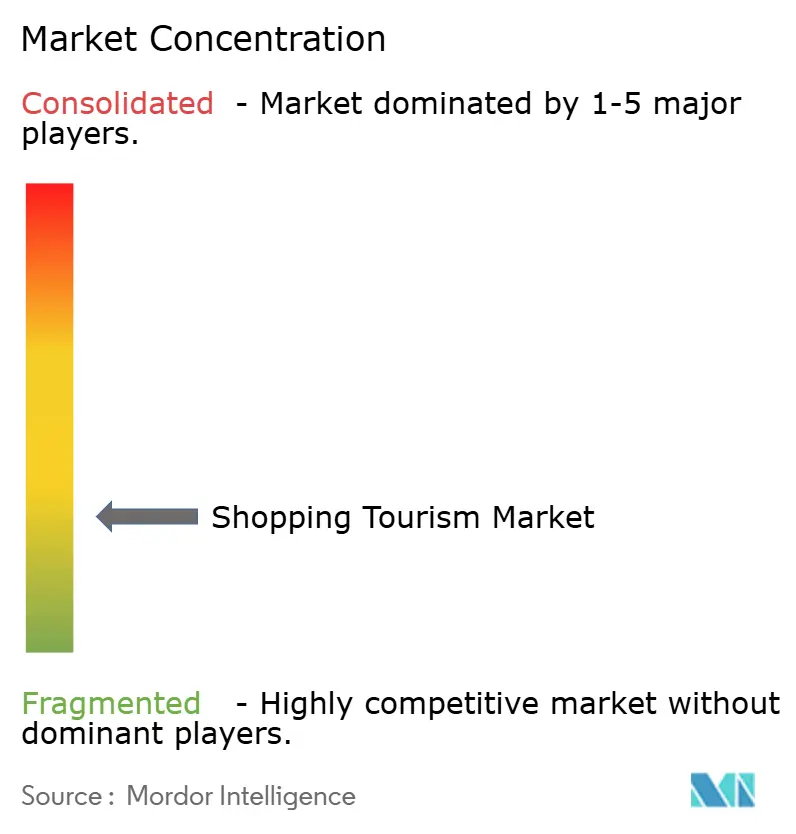
The global shopping tourism market is fragmented, with competition spanning airports, shopping malls, outlet centers, and city-center retail districts, differentiated by destination appeal, brand mix, pricing, and traveler preferences. Avolta reported CORE turnover of CHF 13.72 billion (USD 17.37 billion) in 2025 and operated nearly 5,100 outlets. Lagardère Travel Retail generated EUR 7.6 billion (USD 8.94 billion) in sales in 2024. The market remains fragmented, with mall owners, airport concessionaires, local retailers, luxury brands, and destination operators serving different parts of the traveler journey.
Strategic activity has focused on securing high-quality locations and serving a broader range of travelers. In May 2025, Lagardère Travel Retail acquired a 70% interest in Schiphol Consumer Services Holding through a joint venture with Schiphol Group. Simon Property Group acquired The Mall Luxury Outlets in Italy in January 2025. Avolta acquired Free Duty in Hong Kong in December 2025, expanding access to railway travelers. Access to passenger flows and destination retail locations remains a key competitive asset.
Digital engagement is an area of competition. Retailers support product discovery before travel and fulfill commitments on stock, price, collection, and service upon arrival. Loyalty programs, pre-order capabilities, and local assortments can increase spending. Smaller retailers compete through distinctive beauty, food, craft, or cultural products. Indian firms can combine trusted local products with accessible service standards for domestic and international travelers.
Shopping Tourism Industry Leaders
-
Avolta AG
-
DFS Group
-
China Tourism Group Duty Free Corporation Limited
-
Lotte Duty Free
-
Lagardère Travel Retail
- *Disclaimer: Major Players sorted in no particular order
Recent Industry Developments
- October 2026: Avolta, through its Hudson brand, secured a 20-year duty-free contract at Seattle-Tacoma International Airport, covering more than 2,800 m² across three concourses in partnership with local businesses.
- August 2026: Avolta entered Kolkata Airport through a seven-year duty-free contract at Netaji Subhash Chandra Bose International Airport, expanding its presence in India’s travel retail market.
- May 2025: Lagardère Travel Retail acquires a 70% interest in Schiphol Consumer Services Holding BV, forming a joint venture with Schiphol Group to operate duty-free at Amsterdam Airport Schiphol.
- March 2025: Simon Property Group opens Jakarta Premium Outlets, a 302,000-sq. ft. center and its first location in Indonesia, in a joint venture with Genting Plantations.
Global Shopping Tourism Market Report Scope
The global shopping tourism market report analyzes shopping-related travel activities across major tourism and retail destinations worldwide. The market is segmented by product type (Fashion and Apparel, Beauty and Cosmetics, Electronics and Gadgets, Jewelry and Watches, Food and Beverages, and Other Product Types), shopping destination, traveler type (Domestic and International Shopping Tourists), and geography. The study examines key drivers, including rising tourist arrivals, disposable income, travel retail expansion, duty-free policies, and retailtainment experiences, alongside restraints such as currency fluctuations, economic uncertainty, customs regulations, and baggage restrictions. It evaluates tourist arrivals, shopping behavior, spending patterns, destination infrastructure, regulatory developments, and competitive intensity using Porter’s Five Forces Analysis. The report provides market size and growth forecasts, market share analysis, competitive landscape assessment, strategic developments, and profiles of leading operators. It also explores opportunities in omnichannel shopping, click-and-collect services, and integrated retail and cultural experiences. Market estimates and forecasts are presented in value (USD) across all covered segments.
Key Questions Answered in the Report
What is driving growth in shopping tourism?
International arrivals, new retail infrastructure, premium spending, duty-free access, and pre-trip digital product discovery support demand.
Which product category leads shopping tourism?
Fashion and Apparel held a 30.34% share in 2026, while Beauty and Cosmetics is projected to grow at a 10.34% CAGR through 2032.
Which shopping destination format is growing fastest?
Outlet Malls and Factory Outlets are projected to grow at a 10.45% CAGR through 2032, supported by brand access and value-oriented purchases.
Why are domestic shopping travelers becoming more important?
Domestic Shopping Tourists are projected to grow at a 10.93% CAGR through 2032 as leisure trips and policy-supported retail formats widen demand.
Which region has the strongest outlook for shopping tourism?
Asia-Pacific held a 32.24% share in 2026 and is projected to grow at an 11.13% CAGR through 2032.
What should Indian retail and tourism operators prioritize?
They should connect retail with travel routes, improve digital discovery and fulfillment, and make payments, tax information, and visitor services easier to use.