
Market Overview
| Study Period | 2020 - 2031 |
|---|---|
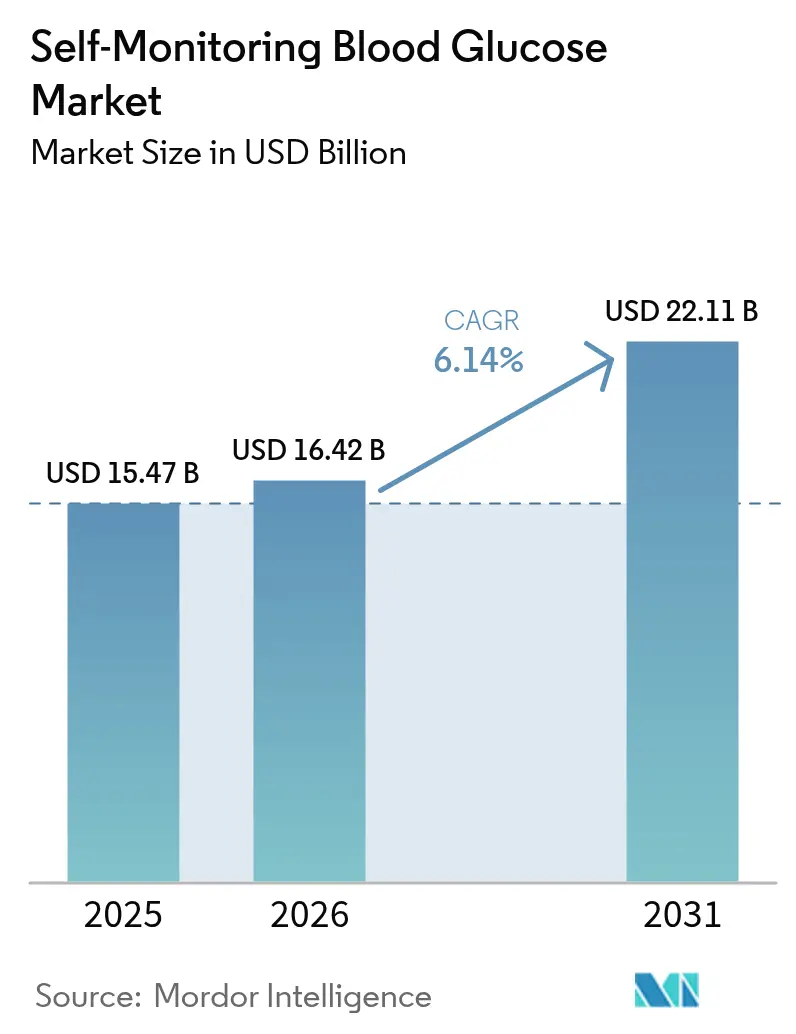
| Market Size (2026) | USD 16.42 Billion |
| Market Size (2031) | USD 22.11 Billion |
| Growth Rate (2026 - 2031) | 6.14 % |
| Fastest Growing Market | Asia Pacific |
| Largest Market | North America |
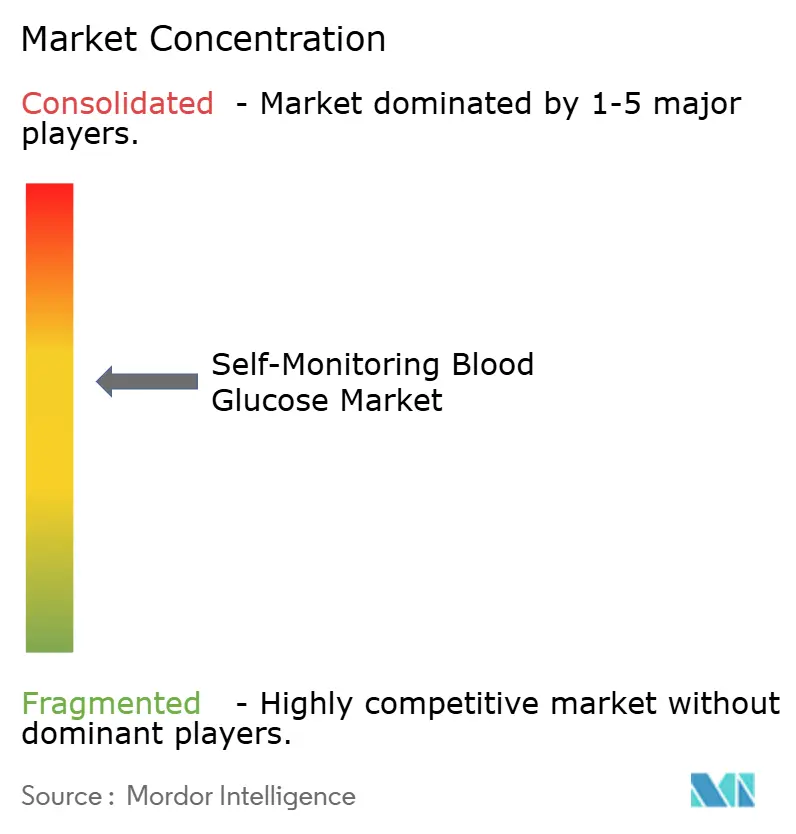
| Market Concentration | Medium |
Major Players *Disclaimer: Major Players sorted in no particular order Image © Mordor Intelligence. Reuse requires attribution under CC BY 4.0. | |
Self-Monitoring Blood Glucose Market Analysis by Mordor Intelligence
Self-Monitoring Blood Glucose market size in 2026 is estimated at USD 16.42 billion, growing from 2025 value of USD 15.47 billion with 2031 projections showing USD 22.11 billion, growing at 6.14% CAGR over 2026-2031. Robust demand stems from the sharp rise in diabetes prevalence, continuing migration toward home-based management, and rapid adoption of digitally connected meters that relay readings to smartphones and cloud portals for data-driven care. Price competition in test strips remains intense, yet recurring strip consumption still anchors revenue. Suppliers are differentiating through eco-friendly materials, longer-life sensors, and Bluetooth-enabled devices that fit seamlessly into tele-diabetes workflows. North America retains leadership owing to broad reimbursement coverage, while Asia-Pacific delivers the fastest unit growth as rising incomes intersect with expanding insurance schemes.
Key Report Takeaways
- By product type, test strips led with 76.12% revenue share in 2025, whereas glucose meters are projected to accelerate at a 10.85% CAGR through 2031.
- By technology, electrochemical sensors captured 89.30% of Self-Monitoring Blood Glucose market share in 2025, while photometric platforms are forecast to grow 9.45% annually to 2031.
- By modality, hand-held conventional meters held 86.25% of volume in 2025; the wearable/connected segment is advancing at the same 13.10% CAGR to 2031.
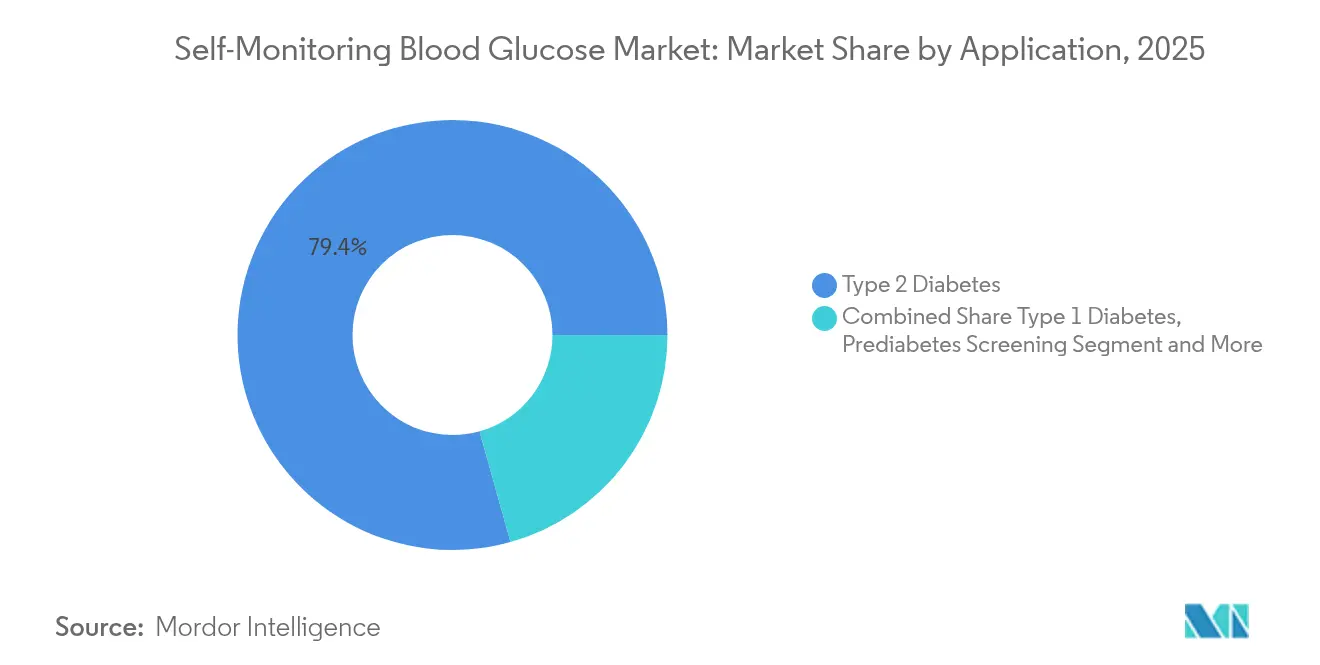
- By application, type 2 diabetes commanded 79.35% of the Self-Monitoring Blood Glucose market size in 2025 and the pre-diabetes screening segment is poised for a 10.05% CAGR between 2026-2031.
- By end user, home-care settings accounted for 60.40% share in 2025, while ambulatory surgical centers record the highest projected 8.95% CAGR through 2031.
- By distribution channel, retail pharmacies captured 43.55% of market share in 2025 and online pharmacies is rising at an 12.75% CAGR through 2031.
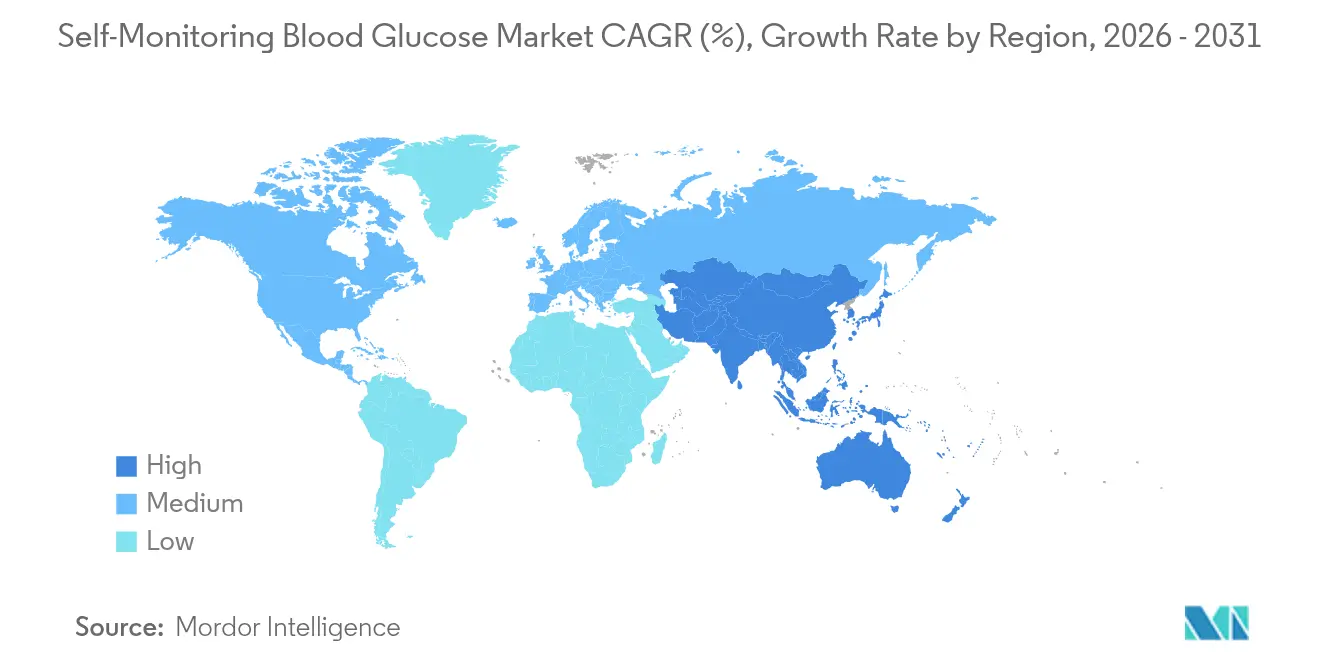
- By geography, North America represented 39.45% of global revenue in 2025; Asia-Pacific is set to surge at 9.18% CAGR to 2031.
Note: Market size and forecast figures in this report are generated using Mordor Intelligence’s proprietary estimation framework, updated with the latest available data and insights as of 2026.
Market Trends and Insights
Drivers Impact Analysis of Self-Monitoring Blood Glucose Market*
| Driver | (~) % Impact on CAGR Forecast | Geographic Relevance | Impact Timeline |
|---|---|---|---|
| Escalating global diabetes prevalence and earlier diagnostic rates | +2.1% | Global, with highest impact in Asia-Pacific and Middle East | Long term (≥ 4 years) |
| Shift toward home-based, patient-empowered glucose management | +1.5% | North America, Europe, developed Asia-Pacific | Medium term (2-4 years) |
| Expanding third-party reimbursement and insurance coverage for SMBG supplies across major economies | +1.2% | North America, Europe, Australia | Medium term (2-4 years) |
| Rising disposable income and diabetes awareness in high-growth emerging markets | +0.8% | Asia-Pacific, Middle East and Africa, South America | Medium term (2-4 years) |
| Integration of SMBG data with digital health & tele-diabetes platforms driving value-added services | +0.7% | North America, Europe, developed Asia-Pacific | Short term (≤ 2 years) |
| Source: Mordor Intelligence | |||
Escalating Global Diabetes Prevalence
International agencies warn that diabetes cases surpassed 800 million adults in 2024 and could hit 1.31 billion by 2025, amplifying the imperative for frequent glucose checks. Type 2 diabetes represents 96% of diagnoses, with high body-mass index driving more than half of related disability-adjusted life years[1]International Diabetes Federation, “IDF Global Clinical Practice Recommendations for Managing Type 2 Diabetes – 2025,” idf.org. Annual direct medical spending linked to diabetes is projected at USD 413 billion, prompting insurers to emphasize early intervention using reliable self-monitoring devices. Consensus guidelines released in 2025 reinforce structured testing as foundational to avoid complications. The scale of the burden ensures that even incremental gains in testing penetration translate into substantial unit demand.
Shift Toward Home-Based Glucose Management
COVID-19 catalyzed a broad redesign of care pathways, normalizing home-use meters for both inpatient and outpatient monitoring under emergency protocols later made permanent by regulators. Evidence linking self-testing to 0.3–0.5 percentage-point reductions in HbA1c has convinced physicians to endorse more frequent home checks for insulin and non-insulin users alike. Remote meter readings transmitted to clinicians support medication titration without clinic visits, lowering costs for payers while improving convenience. Manufacturers are countersinking test-strip subsidies into integrated meter-and-app bundles to deepen patient engagement and defend pricing.
Expanded Reimbursement for SMBG Supplies
Medicare’s decision to reimburse over-the-counter glucose meters for treatment decisions removed a longstanding barrier and triggered parallel moves by commercial insurers and state Medicaid programs[2]Centers for Medicare & Medicaid Services, “Glucose Monitor – Policy Article (A52464),” cms.gov. Germany, the United Kingdom, and Australia reported double-digit rises in self-monitoring after government subsidies broadened eligibility. U.S. payers shifting coverage from durable medical equipment budgets to pharmacy benefits have simplified access and reduced paperwork. Reimbursement certainty stabilizes demand forecasts, enabling suppliers to expand local strip production and invest in connected platforms that qualify for higher fee schedules.
Digital Integration with Tele-Diabetes Platforms
Smartphone penetration exceeds 85% in many advanced markets; thus, Bluetooth-enabled meters that sync to cloud dashboards have moved from niche to mainstream. Clinicians value automated logs that reduce manual diaries, while patients appreciate trend graphs and reminders. Artificial-intelligence tools are layering predictive alerts onto SMBG data, flagging impending hyper- or hypoglycemia events hours in advance. System-level connections to electronic health records are enhancing population-health analytics and facilitating pay-for-performance contracts based on objective adherence metrics.
Restraints Impact Analysis of Self-Monitoring Blood Glucose Market*
| Restraint | (~) % Impact on CAGR Forecast | Geographic Relevance | Impact Timeline |
|---|---|---|---|
| Intensifying price competition and commoditization of test strips compressing margins | -0.8% | Global, with highest impact in North America and Europe | Short term (≤ 2 years) |
| Stringent regulatory & quality-compliance requirements prolonging product approval timelines | -0.6% | North America, Europe, developed Asia-Pacific | Medium term (2-4 years) |
| Environmental and waste-management concerns over single-use strips and lancets | -0.4% | Europe, North America, developed Asia-Pacific | Long term (≥ 4 years) |
| Source: Mordor Intelligence | |||
Intensifying Price Pressure on Test Strips
Generic strips and private-label pharmacy offerings have eroded average selling prices by 5-7% annually since 2023 in mature markets[3]U.S. Food and Drug Administration, “Self-Monitoring Blood Glucose Test Systems for Over-the-Counter Use,” fda.gov. With strips accounting for roughly three-quarters of total revenue, margin compression is steering incumbents toward volume-based tactics or migration to premium connected ecosystems. Pharmacy benefit managers conduct annual tenders that intensify competition, forcing manufacturers to bundle coaching apps and extended warranties to defend shelf space. Large players are exploring backward integration into enzyme production to recapture cost advantages.
Stringent Regulatory Compliance Hurdles
Glucose meters straddle consumer electronics and medical device categories, complicating approval pathways. FDA policy divides products into Class II 510(k) and Class III PMA routes depending on intended use, sample type, and connectivity level. Smaller innovators struggle with the USD 1–2 million cost of conformity testing and clinical trials, delaying commercialization by 18–24 months on average. Public pressure for faster access collides with watchdog insistence on accuracy within ±15 mg/dL, particularly for insulin dosing. Companies with global ambitions face an additional layer of regional audits and post-market surveillance rules.
*Our forecasts treat driver/restraint impacts as directional, not additive. The impact forecasts reflect baseline growth, mix effects, and variable interactions.
Self-Monitoring Blood Glucose Market Segment Analysis
By Product Type:
Test Strips Anchor Recurring RevenueTest strips generated 76.12% of Self-Monitoring Blood Glucose market revenue in 2025, propelled by the necessity for multiple daily measurements among insulin users. This consumable model insulates suppliers from hardware replacement cycles, though commoditization has narrowed unit margins. Strip innovations now target capillary volumes below 0.4 µL and 5-second read times to boost adherence. The Self-Monitoring Blood Glucose market size tied to glucose meters is expanding swiftly which deliver 10.85% forecast CAGR through 2031, offering richer data and value-added services that justify premiums. Manufacturers partner with smartphone-app developers to merge nutrition logs, step counts, and medication reminders, enhancing differentiation. Efforts to minimize strip environmental footprint-bioplastic housings and corrugated paper packaging-address rising consumer sustainability expectations.
Second-generation strips incorporate multi-electrode designs that cross-check hematocrit and ambient temperature, cutting user error. Suppliers bundle loyalty programs that discount bulk packs, locking patients into proprietary ecosystems. Conversely, healthcare systems in lower-income regions still prioritize affordability over connectivity, sustaining basic strip demand even as unit prices slip.




By Technology:
Electrochemical Sensors Retain PrimacyElectrochemical sensors underpin 89.30% of devices sold, testament to decades of reliability and cost efficiency. Their enzyme-mediated current output correlates linearly with glucose concentration, simplifying calibration. Continued miniaturization using carbon-nanotube electrodes enables thinner, shorter strips that require less blood. Photometric methods hold only a modest share today yet post the highest growth trajectory at 9.45% owing to optical chips that promise non-enzymatic detection and potential sweat-based applications. The Self-Monitoring Blood Glucose market share advantage of electrochemical platforms remains secure until optical accuracy and unit economics converge.
Researchers are experimenting with surface-enhanced Raman spectroscopy to resolve interstitial glucose yet face challenges such as skin-tone variability and signal-to-noise. Hybrid meters that incorporate both electrochemical and photometric modules are emerging, offering redundancy and facilitating transition paths for users. Regulatory agencies mandate tight mean absolute relative difference thresholds; thus, new technologies must surpass electrochemical benchmarks to gain clinical legitimacy.
By Modality:
Connected Devices Re-Envision User ExperienceHand-held conventional meters delivered 86.25% of units in 2025, favored for low entry price and simple workflow. However, connected wearables-arm-band or wrist-strap format-are expected to post a 13.10% CAGR as younger cohorts seek seamless health dashboards. The Self-Monitoring Blood Glucose market size attributable to connected modalities will grow as cloud-sync subscriptions and coaching packages unlock recurring revenue streams. Hardware advances such as low-energy Bluetooth, NFC tap-upload, and color touchscreens are enhancing convenience.
Legacy meters remain indispensable where cellular coverage or smartphone ownership is limited. Manufacturers offer hybrid kits bundling a basic reader with upgrade coupons for connected models, nurturing step-up migration. Hospitals value connected devices for auto-charting capabilities that cut nursing documentation time by up to 30%, aligning with electronic medication administration records.
By Application:
Type 2 Diabetes Commands VolumeType 2 diabetes patients accounted for 79.35% of Self-Monitoring Blood Glucose market demand in 2025, yet individual testing frequency ranges widely depending on therapy intensity. Insulin-treated type 2 segments test nearly as often as type 1 counterparts, whereas diet-controlled cohorts may monitor only weekly. Structured testing protocols promoted by professional societies are lifting strip volumes even in non-insulin users. The Self-Monitoring Blood Glucose market size linked to pre-diabetes screening-especially among weight-loss program participants-records the fastest 10.05% CAGR as employers subsidize metabolic wellness benefits.
Type 1 diabetes, though smaller in patient numbers, generates high device turnover due to obligatory insulin dosing decisions. Product design is increasingly sensitive to pediatric needs, adding animated feedback and voice prompts. Gestational diabetes monitoring demand is growing with rising maternal age and obesity; disposable lancets with integrated needles address infection-control requirements in obstetric settings.
By End User:
Home-Care Leads, Ambulatory Centers RiseHome users generated 60.40% of revenue in 2025, underscoring the shift to patient-empowered management. Digital literacy gains and remote coaching programs reinforce adherence. Hospitals and clinics remain important, particularly for perioperative glucose control; consensus guidelines endorse hourly checks for certain inpatients, supporting premium strip variants validated for critical care. Ambulatory surgery centers show 8.95% CAGR as same-day procedures proliferate, necessitating rapid-turnaround glucose verification.
Pharmacists increasingly act as device educators, yet surveys reveal average didactic time on glucose monitoring is under 60 minutes during doctorate curricula, prompting calls for expanded training. Telepharmacy models now deliver virtual onboarding sessions, boosting rural patient access. Diagnostic laboratories leverage high-throughput strip analyzers for point-of-care outreach programs, widening community screening.
By Distribution Channel:
Retail Pharmacies Maintain First PositionRetail pharmacies captured 43.55% of sales in 2025, capitalizing on walk-in convenience and the ability to bill insurance plans in real time. Chain operators stock private-label strips priced 20-30% below brands, pressuring incumbents. Hospital pharmacies supply meters for inpatient use and dispense starter kits at discharge to support continuity of care. Online pharmacies, while only mid-teens share today, are expanding at 12.75% CAGR as free two-day shipping and automatic refill services resonate with tech-savvy users.
Manufacturers run direct-to-consumer web stores that bundle supplies with tele-coaching, bypassing wholesale mark-ups. Subscription models ship strips monthly, smoothing cash flow and improving adherence. Regulatory clarity around e-prescriptions in multiple U.S. states has accelerated digital pharmacy adoption, enabling frictionless device provisioning under payer formularies.
Geography Analysis
North America Self-Monitoring Blood Glucose Market
North America accounted for 39.45% of 2025 revenue, anchored by the United States where diabetes prevalence stood at 11.3% of adults and healthcare spend per capita remains the world’s highest. Medicare and private insurers reimburse both meter hardware and supplies, sustaining sizeable Self-Monitoring Blood Glucose market share and funding next-generation connected devices. Canada mirrors these dynamics, although provincial formularies emphasize price caps on strips, spurring growth of lower-cost brands. Widespread 4G/5G coverage underpins tele-diabetes platforms that integrate meter feeds directly into electronic health records.
Europe Self-Monitoring Blood Glucose Market
Europe ranks second, with Germany alone holding more than one quarter of regional revenue in 2025. Statutory insurance schemes reimburse unlimited strips for insulin users, driving volumes despite fierce tender-led price erosion. Environmental directives such as the European Green Deal elevate scrutiny of single-use plastic components, prompting suppliers to introduce recyclable cartridges and take-back pilots. Nations like Sweden and France have begun factoring carbon-footprint metrics into procurement scoring, offering early-mover advantages to eco-forward brands.
APAC Self-Monitoring Blood Glucose Market
Asia-Pacific is the fastest-growing region at 9.18% CAGR through 2031. China’s adult diabetes prevalence of 10.9% translates into more than 140 million potential users; domestic manufacturers leverage scale to supply low-priced strips, while foreign brands compete on accuracy and connectivity. India’s expanding middle class and government health insurance schemes such as Ayushman Bharat widen access, yet rural distribution gaps persist. Smartphone penetration exceeding 70% across urban Southeast Asia accelerates adoption of app-linked meters. Local language interfaces and cloud servers hosted within national borders address regulatory and cultural preferences, facilitating uptake.

Regulatory Landscape
Self-monitoring blood glucose (SMBG) systems are regulated as in vitro diagnostic (IVD) or medical device products depending on intended use and configuration. In the United States, the FDA sets distinct expectations for over-the-counter SMBG test systems versus prescription or point-of-care blood glucose monitoring systems, and manufacturers commonly enter via the Class II 510(k) pathway. A concrete example is ACON Laboratories receiving FDA 510(k) clearance (K250085) in October 2025 for the On Call Sure GK blood glucose and ketone monitoring system.
In Europe, SMBG products fall under Regulation (EU) 2017/746 (IVDR) as IVDs, while some continuous in vivo glucose monitoring configurations are treated as medical devices. Regulatory capacity and transition timing remain key constraints, and Regulation (EU) 2024/1860 entered into force on 9 July 2024 to extend IVDR transition periods for legacy devices to mitigate supply risk. The European Commission also published COM(2025) 1023 on 16 December 2025 to address MDR/IVDR bottlenecks and coordination. Standards evolution continues to affect compliance roadmaps, with ISO/AWI 15197 (self-testing blood glucose monitoring systems) progressing, an effective registration date of 19 December 2024, and committee drafting activity in 2026.
Competitive Landscape
The Self-Monitoring Blood Glucose market is moderately concentrated, with the top five manufacturers accounting significant global revenue. Abbott, Roche, and LifeScan remain dominant based on broad strip portfolios, proprietary enzyme technologies, and global sales footprints. Abbott strengthened ecosystem stickiness in 2025 by integrating its LibreView platform with multiple telehealth providers, enabling one-click data sharing that anchors device selection. Roche advanced sustainability credentials by moving to paper-based test-strip vials that cut plastic by 45%.
Emerging challengers focus on connected value propositions. Ascensia’s 2024 FDA-cleared CONTOUR PLUS BLUE meter pairs via Bluetooth to its app, pushing personalized insights and weekly glycemic reports. Start-ups are trialing optical micro-sensors embedded in smartwatch straps, though most remain in investigational stages. Contract manufacturing in Malaysia and Mexico expands capacity while trimming lead times for regional supply.
Strategic alliances proliferate. Device firms partner with insulin-delivery companies to offer integrated dosing calculators, raising competitive barriers. Vertical integration trends include enzyme production acquisitions and strip-printing technology licensing, aiming to offset price compression. Intellectual-property litigation persists over electrode coatings and data-format protocols, yet cross-licensing deals are emerging as companies prioritize platform interoperability to satisfy payer requirements for open data sharing.
Self-Monitoring Blood Glucose Industry Leaders
F. Hoffmann-La Roche AG
Ascensia Diabetes Care
LifeScan Inc.
ARKRAY Inc.
Abbott Laboratories
- *Disclaimer: Major Players sorted in no particular order
Self-Monitoring Blood Glucose Market Companies Covered in this Report
- Abbott Laboratories
- Roche
- Lifescan
- Ascensia
- Arkray
- Terumo Corp.
- i-SENS Inc.
- Nova Biomedical
- Bionime
- AgaMatrix
- Acon Laboratories
- Trividia Health
- Rossmax
- Ypsomed
- OK Biotech Co. Ltd.
- SD Biosensor Inc.
- Sinocare
- B. Braun
- A. Menarini Diagnostics (GlucoMen)
- Beurer

Market Opportunities and Future Outlook
Product differentiation is moving beyond single-analyte glucose readings toward broader metabolic decision support, which creates room for premium systems that add actionable context while staying compatible with home-care workflows (which accounted for 60.40% of revenue in 2025). Abbott’s May 2026 CE Mark for Libre Duo and Libre Duo 10 Day, dual glucose-ketone sensing systems, is a visible proof point, indicating regulator acceptance of multi-analyte platforms that can support sick-day management and ketone-aware interventions. As payers and providers lean more on remote monitoring, connected meters and apps that streamline data sharing and documentation also gain traction, consistent with the report’s emphasis on tele-diabetes integration.
Regulatory and standards activity also points to execution opportunities for suppliers that can manage compliance at scale. The ISO 15197 update process advanced in 2026, supporting clearer performance and validation targets for self-testing systems, while EU actions to manage IVDR transition timelines reduce disruption risk for compliant portfolios. On the supply side, capacity plans and diabetes-care device ecosystem moves support distribution continuity and bundling strategies: Roche’s July 2026 announced work to expand its Indianapolis diagnostics hub to manufacture Accu-Chek SmartGuide CGMs, and CDMO-led scaling by device-adjacent firms (for example, ViCentra scaling consumables production via Phillips Medisize in May 2026) reinforce the path for broader kit-based propositions that pair SMBG supplies with digital services, pharmacy benefit access, and patient education programs.
Recent Industry Developments in Self-Monitoring Blood Glucose Market
- May 2026: Abbott secured a CE Mark for its dual glucose-ketone sensing technology, Libre Duo and Libre Duo 10 Day systems. The move extends addressable use-cases from glucose-only tracking to ketone-informed management, and it increases pressure on incumbent SMBG portfolios to add higher-acuity features and connectivity.
- December 2025: Abbott expanded access to its Lingo continuous glucose monitor by making the Lingo app available on Android in the United States and the United Kingdom. Broader smartphone compatibility supports higher user onboarding through retail and direct-to-consumer channels, reinforcing the market shift toward app-centric data sharing and coaching.
- February 2024: Ascensia Diabetes Care received FDA clearance for the CONTOUR PLUS BLUE blood glucose monitoring system with Bluetooth connectivity. The authorization strengthens Ascensia’s connected SMBG position, aligning conventional strip-based testing with cloud and smartphone workflows used for remote diabetes management.


Self-Monitoring Blood Glucose Market Report Scope and Research Methodology
Market Definition and Coverage
For this study, the self blood glucose monitoring market covers products used by individuals to check blood glucose through fingerstick testing. It includes glucose meters, test strips, and lancets sold through common healthcare channels across major regions.
Scope exclusions: continuous glucose monitoring systems, sensors, transmitters, and professional or hospital-only glucose testing systems are not counted under this market definition.
Segments Covered in This Report
- By Product Type
- Glucose Meters
- Test Strips
- Lancets
- By Technology
- Electrochemical
- Photometric
- By Modality
- Hand-held Conventional
- Wearable / Connected
- By Application
- Type 1 Diabetes
- Type 2 Diabetes
- Gestational Diabetes
- Prediabetes
- By End-user
- Hospitals & Clinics
- Home-care Settings
- Diagnostic Laboratories
- Ambulatory Surgical Centers
- By Distribution Channel
- Retail Pharmacies
- Hospital Pharmacies
- Online Pharmacies
- Others
- Geography
- North America
- United States
- Canada
- Mexico
- Europe
- Germany
- United Kingdom
- France
- Italy
- Spain
- Rest of Europe
- Asia-Pacific
- China
- Japan
- India
- Australia
- South Korea
- Rest of Asia-Pacific
- Middle East and Africa
- GCC
- South Africa
- Rest of Middle East and Africa
- South America
- Brazil
- Argentina
- Rest of South America
- North America
Data Sources, Market Sizing, and Validation
Desk Research
Desk work started with building a clean fact base on diabetes burden, testing habits, and access, since these drive recurring strip demand more than one-time device sales. We mainly used public sources such as the World Health Organization, International Diabetes Federation update materials, U.S. CDC and NHANES tables, OECD health statistics, and World Bank population and health spend series.
To keep the supply side and pricing logic practical, we also reviewed company annual reports, regulatory and recall notices, and reimbursement or coverage notes published by national payers. Reputable medical journals were used for SMBG accuracy standards and testing frequency in real-world settings. Where needed, paid subscriptions were used for company financials and news screening, patent trend checks, and import or export shipment-level signals to sanity check volume patterns. These desk sources are illustrative, and many other public documents and datasets were also used to collect, validate, and clarify data points during the build.
Primary Interviews and Surveys
Primary inputs were collected through expert interviews and structured surveys with stakeholders across the value chain, including device and consumable suppliers, distributors, pharmacy channel participants, clinicians, and diabetes educators. Because it is a global market, feedback was balanced across APAC, EMEA, and the Americas so regional reimbursement, strip usage patterns, and price erosion assumptions could be checked and then adjusted where needed.
Distribution of primary research fieldwork respondents
| Company type | Respondent position | Region |
|---|---|---|
| Top tier: 25% | CXOs: 14% | APAC: 40% |
| Mid tier: 57% | Functional/Unit leaders: 34% | EMEA: 37% |
| Smaller Players: 18% | Managers: 52% | Americas: 23% |
Market-Sizing & Forecasting
Market sizing was built using a top-down demand reconstruction where the diabetes population and treatment mix are translated into a tested cohort, and then into annual test strip consumption by region before applying pricing in USD. After the demand pool was formed, we corroborated totals with selective bottom-up checks such as sampled retail price points, distributor channel splits, and a supplier roll-up for consumables, to make sure the final number stayed consistent with what could be explained.
Key inputs used in the model included diabetes prevalence and diagnosis rates, testing frequency assumptions by patient type, reimbursement coverage and out-of-pocket sensitivity, strip and lancet replacement cycles, average selling price progression (including strip price erosion), and regional currency conversion timing. When interview inputs showed material differences by country, we used proxy markets with similar reimbursement and care pathways, and then rechecked those choices in a second pass.
For forecasting, scenario analysis was used so the outlook could reflect how changes in reimbursement, adoption of connected meters, and patient self-management programs shift testing volumes and pricing differently across regions. Assumptions for each scenario were aligned to what experts described as realistic, and then smoothed so year-to-year changes remained explainable.
Data Validation & Update Cycle
Validation relied on cross-checking modeled totals against independent signals such as diabetes population trends, shipment and trade direction, and the expected mix between devices and recurring consumables. Outliers were reviewed at country and regional levels, and any large variances triggered a re-look at testing frequency, pricing, or channel weights before internal sign-off.
Each report is refreshed annually, and interim updates are made when major events occur that can move demand or pricing in a visible way. Before delivery, analysts do a final pass to confirm the latest public statistics and market events are reflected, so clients get an updated view.
Mordor Intelligence's Global Self Blood Glucose Monitoring Market Size Compared Against Other Published Estimates
Published market values for self blood glucose monitoring can look far apart because firms sometimes count different product sets, use different base years, or apply different price and usage assumptions for strips, where most spending sits.
The main gap comes from whether continuous glucose monitoring and related sensor hardware are bundled into the same total. Mordor Intelligence counts only fingerstick SMBG components (meters, test strips, and lancets), and then sizes demand using the tested cohort and strip consumption logic before applying region-wise pricing.
Benchmark comparison
| Source | Market Size | Gaps in Research Methodology |
|---|---|---|
| Mordor Intelligence | USD 16.42 B (2026) | |
| Industry Statistics Outlet A | USD 9.55 B (2024) | Uses an earlier base year and appears to group SMBG inside a broader blood glucose monitoring devices view. This can shift what is counted and how pricing is treated across meters, strips, and adjacent device categories. |
| Global Research Publisher B | USD 30.87 B (2025) | Likely applies a wider scope and a higher spending assumption per patient. This can happen when self-monitoring is interpreted to include more connected monitoring solutions, or when strip usage and ASP trajectories are not constrained by reimbursement and real-world testing frequency checks. |
The spread across sources is mainly explained by scope selection and the way strip volumes and pricing are carried forward year by year. Keeping the model tied to a clear tested cohort, realistic testing frequency, and region-level price movement makes the final value easier to audit and reproduce when assumptions need to be updated.


Key Questions Answered in the Report
How large is the Self-Monitoring Blood Glucose market in 2026?
The Self-Monitoring Blood Glucose market size is USD 16.42 billion in 2026, with a 6.14% CAGR outlook to 2031.
Which product type generates the most revenue?
Test strips dominate, holding 76.12% of 2025 revenue thanks to high daily consumption.
What region is growing fastest through 2031?
Asia-Pacific posts the highest 9.18% CAGR, driven by rising diabetes prevalence and broader insurance access.
How are connected devices impacting adoption?
Bluetooth-enabled meters upload readings to apps, driving a 13.10% CAGR in the wearable/connected modality segment and improving patient engagement.
What sustainability steps are manufacturers taking?
Firms are introducing recyclable strip vials, bioplastic components, and programs such as Novo Nordisks ReMed take-back initiative to cut device waste.
Why are price pressures acute in test strips?
Generic alternatives and pharmacy private labels have pushed selling prices down 5-7% annually in mature markets, compelling differentiation through digital features and services.
Page last updated on:


 Your data is secure and never sold or shared.


