
Renewable Natural Gas Market Size and Share
Market Overview
| Study Period | 2022 - 2032 |
|---|---|
| Market Size (2027) | USD 20.40 Billion |
| Market Size (2032) | USD 31.86 Billion |
| Growth Rate (2027 - 2032) | 9.32 % |
| Fastest Growing Market | Europe |
| Largest Market | North America |
| Market Concentration | Medium |
Major Players *Disclaimer: Major Players sorted in no particular order Image © Mordor Intelligence. Reuse requires attribution under CC BY 4.0. | |
Renewable Natural Gas Market Analysis by Mordor Intelligence
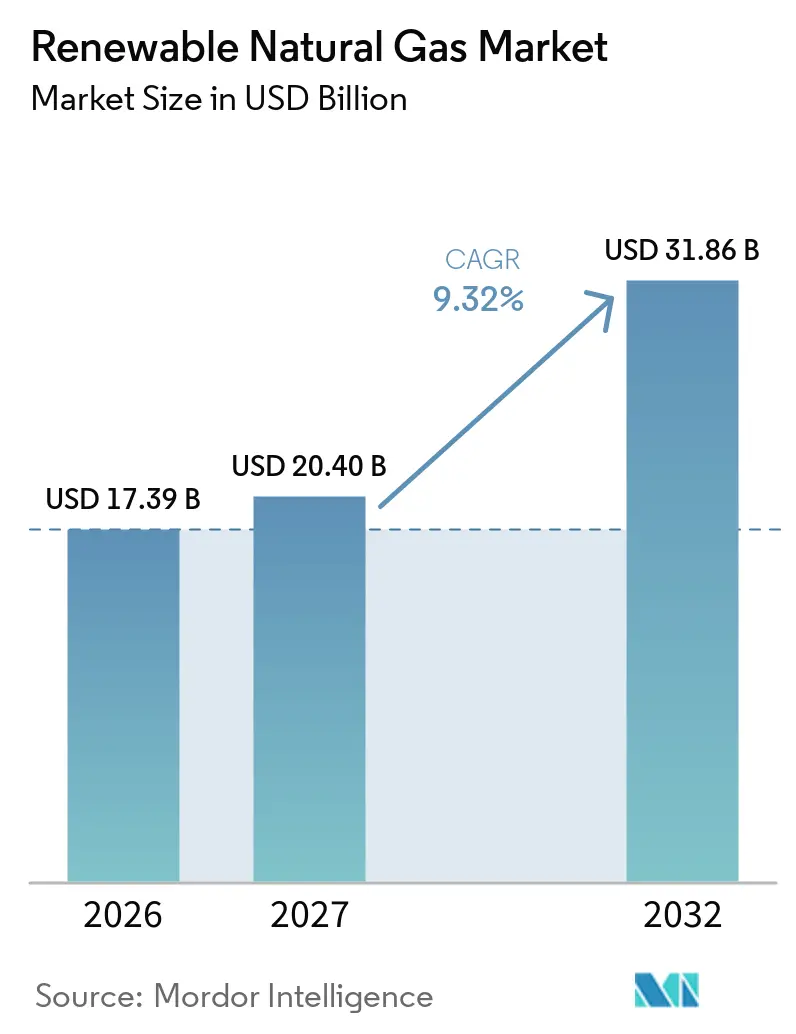
The global renewable natural gas market size is expected to grow from USD 17.39 billion in 2026 to USD 20.40 billion in 2027 and is forecast to reach USD 31.86 billion by 2032 at 9.32% CAGR over 2027-2032. The market benefits from shared use of existing pipelines, compressors, and storage assets that already serve natural gas, reducing the need for new delivery infrastructure. Regulatory obligations in North America and Europe are supporting demand by linking low-carbon fuel use with compliance programs. Organic waste rules are also directing feedstock supply toward more formal collection systems. Developers are combining waste access, gas upgrading, pipeline interconnection, and long-term offtake contracts to improve project financing. Credit-price volatility and high connection costs continue to favor larger projects with established feedstock positions.
Key Report Takeaways
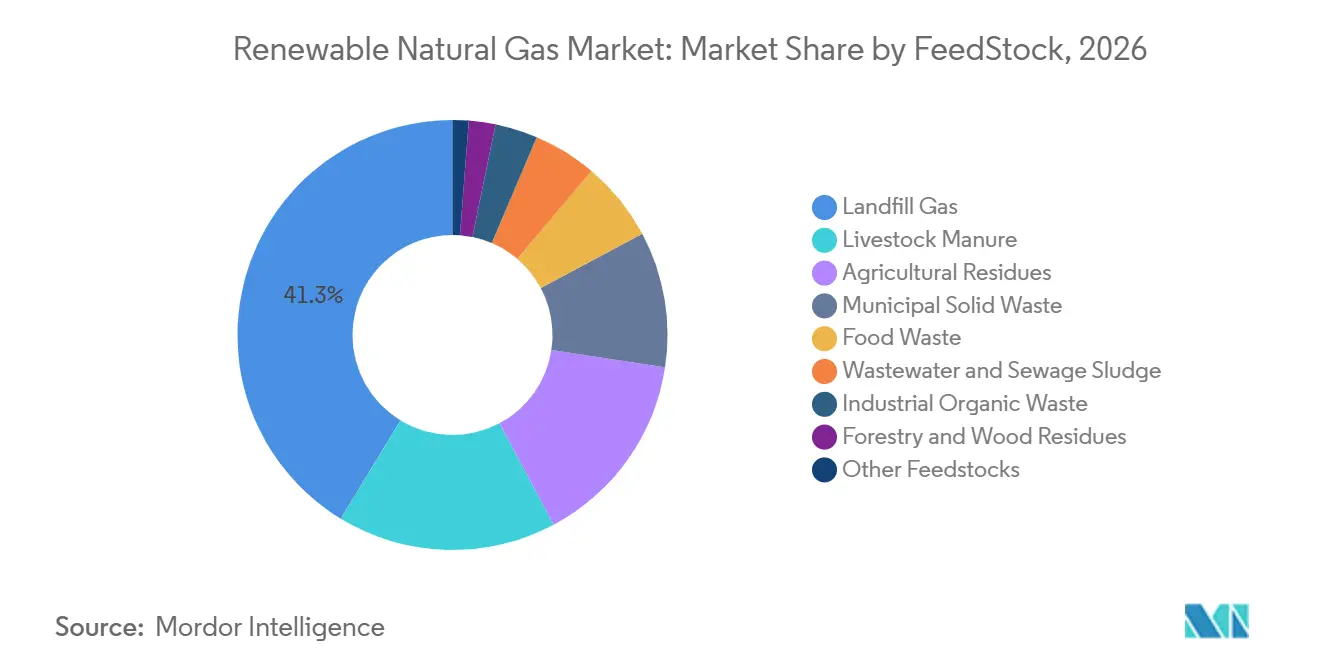
- By feedstock, landfill gas held 41.3% of the renewable natural gas market share in 2026, while food waste is forecast to grow at a 9.7% CAGR through 2032.
- By production pathway, anaerobic digestion accounted for 56.7% of the renewable natural gas market share in 2026, while gasification is projected to expand at a 10.3% CAGR through 2032.
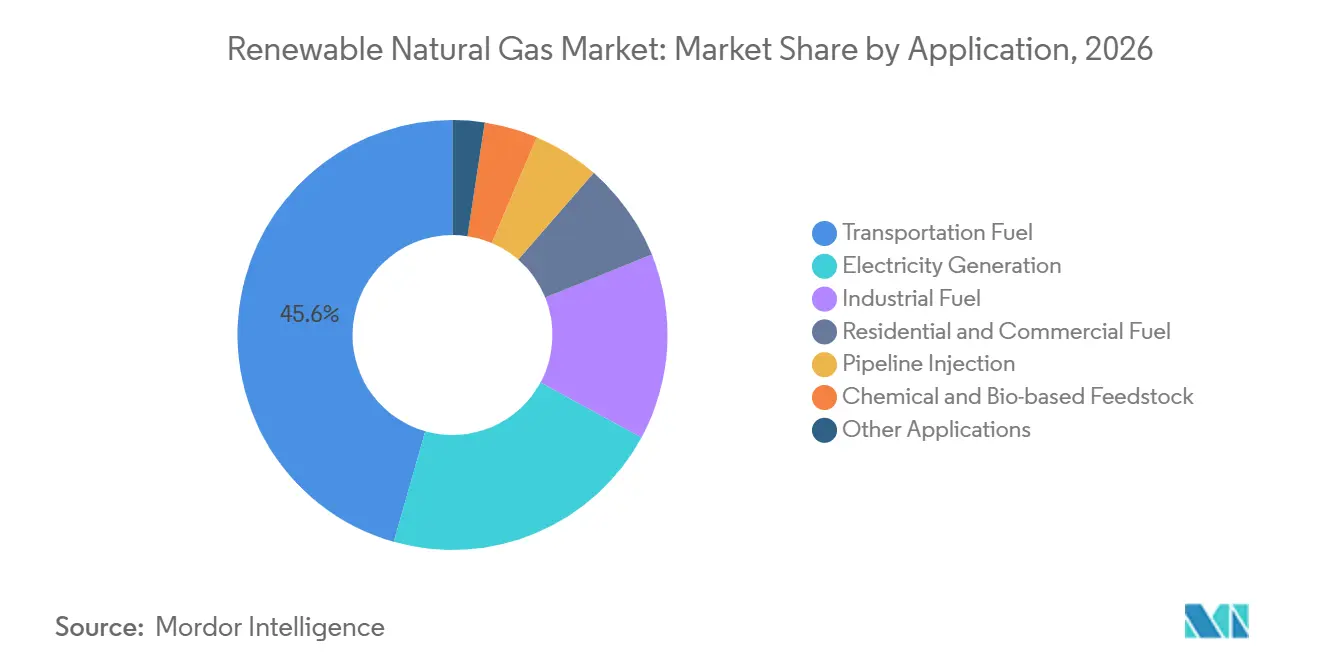
- By application, transportation fuel held 45.6% of the renewable natural gas market share in 2026, while industrial fuel is projected to grow at a 10.1% CAGR through 2032.
- By form, pipeline-injected gas accounted for 46.2% of the renewable natural gas market share in 2026, while liquefied renewable natural gas (RNG) is forecast to expand at a 10.5% CAGR through 2032.
- By geography, North America held 44.7% of the renewable natural gas market share in 2026, while Europe is projected to grow at a 10.9% CAGR through 2032.
Note: Market numbers in this report are based on Mordor Intelligence's proprietary estimation framework, which combines nine months of actuals with Q4 projections for base year 2026.
Market Trends and Insights
Drivers Impact Analysis of Renewable Natural Gas Market*
| Driver | (~) % Impact on CAGR Forecast | Geographic Relevance | Impact Timeline |
|---|---|---|---|
| Policy-Driven Demand for Low-Carbon Transport Fuel | +2.6% | North America and Europe, with spillover to Brazil and Asia-Pacific | Medium term (2-4 years) |
| Mandatory Organic-Waste Diversion and Methane-Abatement Rules | +1.7% | Global, with early gains in the United States, Germany, France, and the Netherlands | Short term (≤ 2 years) |
| Expansion of Anaerobic Digestion and Landfill-Gas Upgrading | +1.5% | North America, with spillover to Europe and Asia-Pacific | Medium term (2-4 years) |
| Industrial and Fleet Decarbonization Through Existing Gas Infrastructure | +1.2% | North America and Europe, with emerging activity in Australia and Japan | Long term (≥ 4 years) |
| Corporate Long-Term RNG Offtake and Environmental-Attribute Procurement | +0.9% | North America and Europe, with growing activity in Australia and New Zealand | Short term (≤ 2 years) |
| Digital Feedstock Monitoring and Higher-Yield Co-Digestion | +0.7% | United States, Germany, the Netherlands, and France | Long term (≥ 4 years) |
| Source: Mordor Intelligence | |||
Policy-Driven Demand for Low-Carbon Transport Fuel
The renewable natural gas market draws much of its near-term demand from transportation policies in the United States. The Environmental Protection Agency set cellulosic biofuel volumes at 1.36 billion D3 Renewable Identification Numbers (RINs) for 2026 and 1.43 billion for 2027. The rule applied a 9% annual production-growth assumption and provided pipeline-connected projects with a clearer planning basis. D3 RIN prices traded between USD 2.50 and USD 3.00 per RIN during 2024 through 2026, making credit income an important factor in project returns. Brazil established a Biomethane Certificate of Origin under Law No. 14,993/2024 and set a 0.5% biomethane blending requirement for natural gas in 2026. Its mandate is intended to rise to 10%, broadening the policy base beyond North America and Europe.[1]
Mandatory Organic-Waste Diversion and Methane-Abatement Rules
Rules that separate organic material from waste streams are changing the feedstock base for the renewable natural gas market. Food-waste-only biogas investment in the United States reached USD 325 million in 2025, more than double the prior-year level. Biogas capture at dedicated food-waste facilities rose 18% to 28 billion cubic feet (Bcf) annually.[2] As jurisdictions limit landfill disposal of organics, developers can rely less on spot-market feedstock procurement, making the renewable natural gas market more closely tied to waste-collection systems and local compliance rules. Germany recorded 12.3 TWh of biomethane injection in 2025 across 268 grid-connected sites, an increase of 12% from 2024.[3]
Expansion of Anaerobic Digestion and Landfill-Gas Upgrading
Investment in anaerobic digestion and landfill-gas upgrading is expanding the project base of the renewable natural gas market. The United States invested USD 2.1 billion in 70 new biogas projects in 2025 and reached 659 facilities producing pipeline-quality gas. Output totaled 225.6 million MMBtu, equivalent to fueling 8.2 million vehicles. Landfill gas received USD 912 million, or 43%, of this investment, while capacity rose 8% to 559 Bcf per year across 599 sites. Greenlane Renewables reported 99.5% methane (CH4) recovery in May 2026 testing of its Linear Nitrogen Rejection Unit. Higher recovery rates can improve the economics of landfill sites with nitrogen-bearing gas.
Industrial and Fleet Decarbonization Through Existing Gas Infrastructure
Existing gas infrastructure gives the renewable natural gas market a role in processes that are difficult to electrify. Food and beverage drying, ceramic kilns, industrial boilers, and chemical feedstock operations require steady high-temperature heat. Renewable natural gas can serve these applications with less equipment modification than an all-electric conversion. Natural gas vehicle stakeholders reported that renewable natural gas use in California rose 28% from 2020 to 2025. Cummins introduced its X15N 15-liter natural gas engine with Class 8 performance, strengthening the case for heavy-duty fleets. Vanguard Renewables and TotalEnergies supplied 33 GWh of renewable natural gas to AstraZeneca operations in the United States in 2025, demonstrating the role of corporate offtake agreements in project development.
Restraints Impact Analysis of Renewable Natural Gas Market*
| Restraint | (~) % Impact on CAGR Forecast | Geographic Relevance | Impact Timeline |
|---|---|---|---|
| Dependence on Volatile RIN and LCFS Environmental-Attribute Revenue | -2.1% | North America, especially the United States, California, Oregon, and Washington | Short term (≤ 2 years) |
| High Pretreatment, Upgrading, and Pipeline-Interconnection Capital Costs | -1.8% | Global, with the strongest effect in Asia-Pacific and emerging markets | Medium term (2-4 years) |
| Feedstock Contamination and Seasonal Supply Variability | -0.9% | Global, especially food-waste and agricultural pathways | Medium term (2-4 years) |
| Inconsistent Injection Standards and Certification Systems | -0.7% | European cross-border markets, United States interstate markets, and emerging Asia-Pacific markets | Long term (≥ 4 years) |
| Source: Mordor Intelligence | |||
Dependence on Volatile RIN and LCFS Environmental-Attribute Revenue
Credit-market exposure remains a central financial constraint for the renewable natural gas market. D3 RIN prices averaged USD 3.30 per RIN in 2024, while Environmental Protection Agency decisions indicated that compliance volumes can change after projects have secured financing. California credit values also fell from the USD 150 to USD 200 range used in many 2021 and 2022 financing cases. The California Air Resources Board amended its program in November 2024 by raising the 2030 carbon-intensity reduction target from 20% to 30%. It also introduced constraints that can reduce credit generation for some pathways. Long project debt terms of 15 to 20 years do not align well with credit markets that can move within 2 to 4 years.
High Pretreatment, Upgrading, and Pipeline-Interconnection Capital Costs
High initial costs limit smaller participants in the renewable natural gas market. Nitrogen removal equipment for landfill gas can cost materially more than standard upgrading equipment because landfill gas composition is less consistent. Grid-connection charges can range from near zero in cost-sharing systems to more than 30% of project capital expenditure where producers pay the full amount. France installed 1,115 GWh of new biomethane capacity in 2025, down approximately 40% from 1,870 GWh in 2024, after revised tariff rules took effect. Minimum gas-output requirements can also keep small producers outside pipeline markets. These barriers direct capital toward large sites with reliable feedstock and established interconnection options.
*Our forecasts treat driver/restraint impacts as directional, not additive. The impact forecasts reflect baseline growth, mix effects, and variable interactions.
Renewable Natural Gas Market Segment Analysis
By Feedstock:
Landfill Gas Anchors Volume, Food Waste Drives Future SupplyLandfill gas held 41.3% of the renewable natural gas market share in 2026, supported by mature collection systems in North America and Western Europe. United States landfill gas facilities produced 559 billion cubic feet (Bcf) per year across 599 active sites in 2025. Investment in landfill gas projects reached USD 912 million, representing 43% of total United States biogas investment. This feedstock offers established gas collection and more predictable operating conditions than many mixed organic streams. Dairy manure projects are concentrated in the United States Midwest and Pacific Northwest. Wastewater sludge digestion has a larger role in European urban systems.
Food waste is projected to grow at a 9.7% CAGR through 2032 within the renewable natural gas market. Dedicated United States food-waste facilities captured 28 Bcf annually in 2025, and 124 facilities were operating. Around 200 agriculture and wastewater sites also co-processed food waste with primary feedstocks. Diversion mandates make supply more stable than discretionary waste procurement. Agricultural residues remain important in Germany and France, where farm access is supported by national programs. Industrial organic waste and forestry residues remain limited at scale because wider use depends on commercial gasification systems.

By Production Pathway:
Anaerobic Digestion (AD) Scales Steadily, Gasification Reshapes the Long ViewAnaerobic digestion accounted for 56.7% of the renewable natural gas market size in 2026. The process accepts manure, food waste, wastewater sludge, and crop residues. Its position reflects operating experience, established credit eligibility, and revenue from digestate products. Modular plant designs can reduce construction risk and allow phased capacity additions. Landfill gas is the second-largest pathway by volume, although it relies on in-place decomposition rather than controlled digestion. This difference creates greater gas-quality management needs at landfill sites.
Gasification is forecast to grow at a 10.3% CAGR through 2032 in the renewable natural gas market. It can process compostable bags, contaminated organic material, woody residues, and other streams that digestion systems may reject. The Dem-Con and Kanadevia Inova facility in Minnesota is expected to process 75,000 tonnes of organic waste annually from 2027, producing 200,000 million British thermal units (MMBtu) of RNG and 8,000 tonnes of biochar.[4] Oak Ridge National Laboratory estimated United States biomass-derived gasification potential at 9,203 million GJ, with an expected cost range of USD 12 to USD 30 per GJ. Power-to-gas and other synthetic methane routes are currently at demonstration scale as of 2026.
By Application:
Transportation Holds Share, Industrial Fuel Moves FastestTransportation fuel represented 45.6% of renewable natural gas market size in 2026. The segment benefits from fleet demand, California compliance economics, and a developed network for compressed gas. California has RNG capability at 98% of its compressed natural gas fueling stations as of 2026. The Cummins X15N expanded the technical options available to class 8 fleets. Electricity generation and residential or commercial uses continue through pipeline blending and utility programs. Chemical and bio-based feedstock use remains an emerging outlet.
Industrial fuel is projected to expand at a 10.1% CAGR through 2032 in the renewable natural gas market. It serves high-temperature processes where replacing gas-fired equipment with electric alternatives may require process redesign. Existing burners can generally use RNG with limited modifications. Food processing, glass, and ceramics are relevant applications due to their sustained process heat requirements. OPAL Fuels sells compressed and liquefied gas through an integrated fueling-station network, combining fuel supply, logistics, and end-user access within one commercial model.
By Form:
Pipeline Injection Consolidates, Liquefied RNG Leads GrowthPipeline-injected gas held 46.2% of the renewable natural gas market share in 2026. Long-duration utility offtake agreements support this form, as gas can enter established distribution infrastructure. CenterPoint Energy and Vanguard Renewables signed an agreement in Minnesota in 2025. France targets 44 TWh of biomethane pipeline injection by 2030 and 47 to 82 TWh by 2035. Compressed gas remains suitable for short- and medium-haul fleet applications, and its further growth depends on converting diesel fleets that have not yet adopted natural gas vehicles.
Liquefied RNG is expected to grow at a 10.5% CAGR through 2032 in the renewable natural gas market. It supports long-haul routes of 500 km or more, where compressed-gas energy density is less suitable. Bio-LNG recorded a thermal efficiency above 40% in heavy-transport engines. Liquefaction raises capital and operating requirements relative to compressed and pipeline-injected gas. Clean Energy Fuels commissioned its South Fork Dairy project in Texas in December 2025 with USD 85 million of investment. The project processes dairy manure from 17,500 cattle and produces 2.6 million gallons of RNG annually.
Geography Analysis
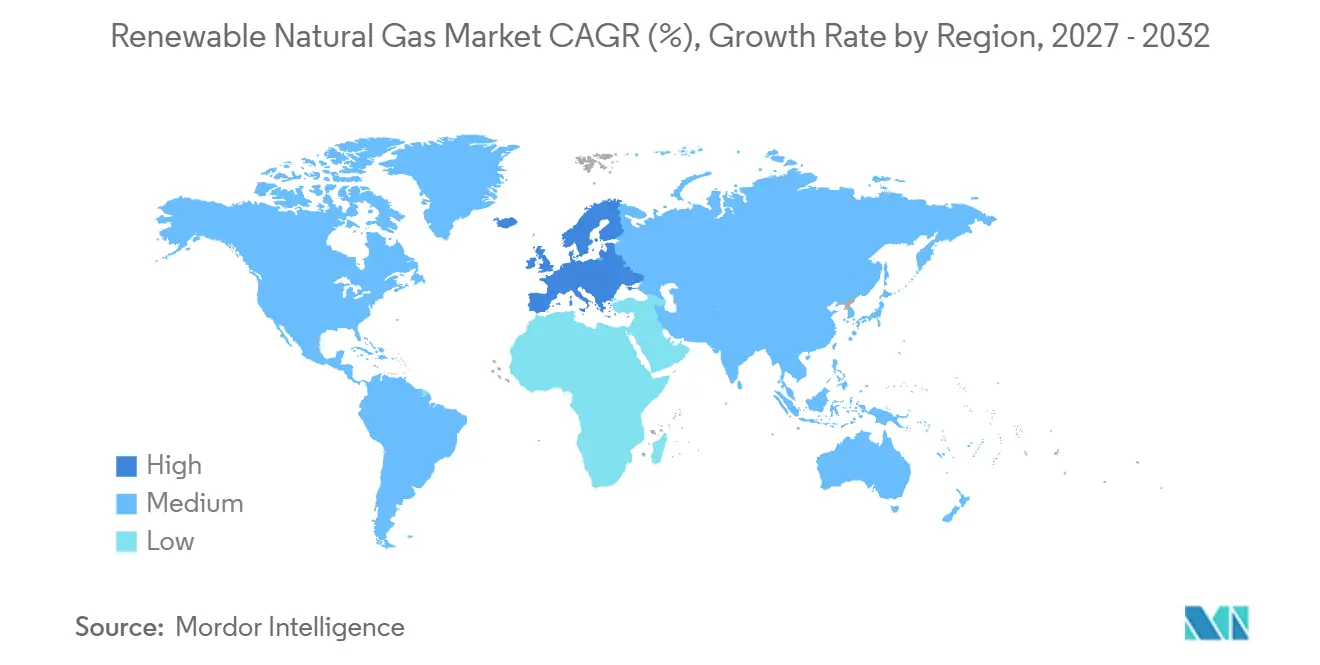
North America held 44.7% of the renewable natural gas market share in 2026. The region has the most developed production and distribution infrastructure, centered on the United States. US investment reached USD 2.1 billion in 2025, with 659 facilities producing pipeline-quality gas. Output reached 225.6 million MMBtu. Canada is expanding through utility offtake agreements and municipal digestion, while Mexico remains at an earlier stage due to limited injection infrastructure.
Europe is forecast to grow at a 10.9% CAGR through 2032 in the renewable natural gas market. The EU has set a target of 35 billion cubic meters (bcm) of biomethane, with national programs being aligned with Renewable Energy Directive III (RED III). Germany reached 12.3 TWh of biomethane injection in 2025 and had 9 facilities in development with 11,280 Nm3/h of capacity. France had 803 active injection installations with 15.5 TWh per year of capacity at the end of 2025. Its development pipeline included 1,117 facilities representing 18.7 TWh per year.
Asia-Pacific, South America, and the Middle East and Africa remain at earlier stages of renewable natural gas market development. China and India offer substantial agricultural waste potential, although monetization frameworks and gas grid access are still developing. India targets 15 million tonnes per year under its Compressed Biogas program by 2028. Japan, South Korea, Australia, and Vietnam are exploring imports and domestic digestion as part of energy security plans. Brazil has commercial sugarcane residue and cattle manure resources, and its 2026 blending requirement provides a formal demand signal. Saudi Arabia, the UAE, Egypt, Morocco, and South Africa are evaluating waste-to-energy systems that could support future supply chains.
Competitive Landscape
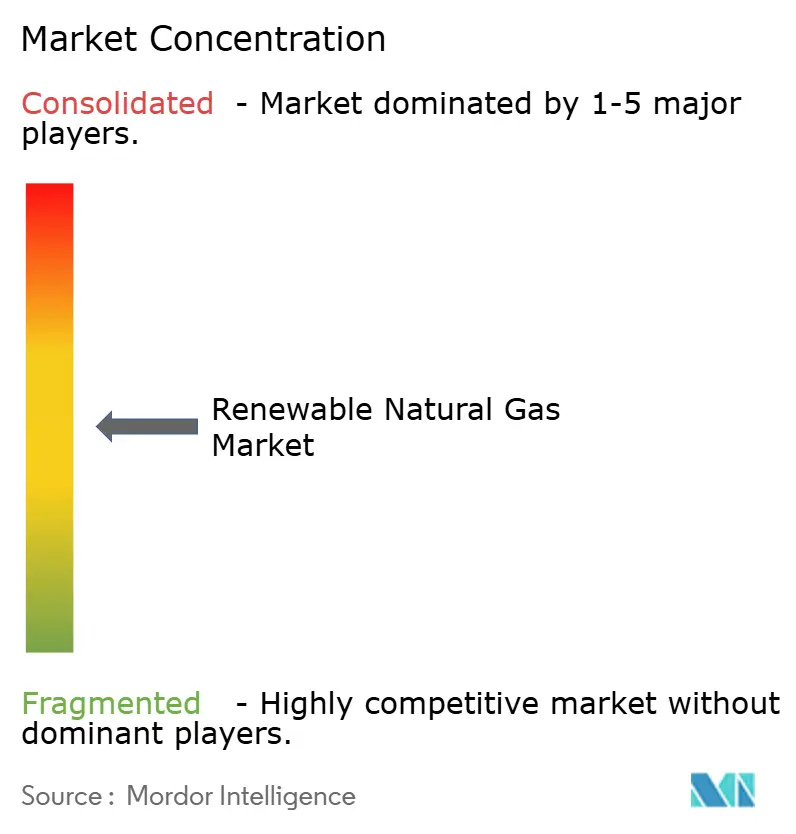
The renewable natural gas market is moderately fragmented across waste owners, developers, technology suppliers, and utilities. Waga Energy, Greenlane Renewables, and DMT Environmental Technology compete on upgrading performance, capital cost, and feedstock flexibility. OPAL Fuels, Montauk Renewables, Clean Energy Fuels, and Ameresco compete on feedstock access, offtake contracts, and financing capacity. Waste Management, Republic Services, Renewi, and Veolia Environnement hold positions based on captive landfill feedstock and regulatory relationships. Nature Energy should be treated as Shell plc's dedicated biomethane business rather than as a separate corporate entry. Chevron has more limited direct production exposure than operators with primary RNG production, upgrading, or injection assets.
The renewable natural gas market has open opportunities in dairy-manure projects at farms with fewer than 500 cattle, city food-waste networks, and gasification projects for mixed waste. These areas have less mature economics or infrastructure than large landfill projects. Waga Energy uses its WAGABOX technology to combine membrane filtration and cryogenic separation for variable landfill gas. In January 2026, Lane County selected Waga Energy for a WAGABOX unit at Short Mountain Landfill under a 25-year agreement. The unit is designed to process up to 2,000 scfm and produce 407,000 MMBtu annually. Technology alternatives may reduce costs if they can remove nitrogen (N2) and carbon dioxide (CO2) at scale.
Consolidation is increasing in the renewable natural gas market as investors seek platforms with feedstock access and contracted output. Mobius Renewables acquired Air Liquide's global biogas operations and GreenGasUSA to build a transatlantic platform. In May 2026, Constellation Energy agreed to acquire equity in five operating Pine Creek RNG facilities producing 1.5 million MMBtu per year. The agreement also provides a framework for 3.0 million MMBtu of additional annual capacity. This trend favors participants that can combine project ownership with long-term commercial relationships.
Renewable Natural Gas Industry Leaders
-
bp plc
-
Shell plc
-
Clean Energy Fuels Corp.
-
Montauk Renewables, Inc.
-
OPAL Fuels Inc.
- *Disclaimer: Major Players sorted in no particular order
Renewable Natural Gas Market Companies Covered in this Report
- Air Liquide S.A.
- Ameresco, Inc.
- Anaergia Inc.
- bp plc
- Chevron Corporation
- Clean Energy Fuels Corp.
- DMT Environmental Technology
- EnviTec Biogas AG
- Gasum Ltd.
- Greenlane Renewables Inc.
- Kinder Morgan, Inc.
- Montauk Renewables, Inc.
- Nature Energy (Shell plc)
- OPAL Fuels Inc.
- Renewi plc
- Republic Services, Inc.
- Shell plc
- SUEZ S.A.
- TotalEnergies SE
- Vanguard Renewables
- Veolia Environnement S.A.
- Verbio SE
- Waga Energy SA
- Waste Management, Inc.
Recent Industry Developments in Renewable Natural Gas Market
- September 2026: Casella Waste Systems and Waga Energy commissioned the McKean Landfill RNG facility in Mount Jewett, Pennsylvania, marking the third project completed under their 2023 partnership. The facility can process up to 3,200 m³/h of landfill gas and produce approximately 407,000 MMBtu (120 GWh) of RNG annually, with all three projects delivered ahead of schedule.
- August 2026: OPAL Fuels reported active construction of the Cottonwood, Burlington, and CMS RNG projects, representing over 2 million MMBtu of combined annual design capacity expected to come online within 12 months. The company also initiated contractor procurement for the Stones Throw and Grady Road RNG projects being developed with GFL Environmental.
- June 2026: Archaea Energy, a subsidiary of BP, and Republic Services inaugurated the first RNG facility developed under their Lightning Renewables joint venture in Fort Wayne, Indiana. The landfill gas-to-RNG facility can process up to 6,400 standard cubic feet per minute (scfm) of landfill gas through a modular skid-based design.
- May 2026: Greenlane Renewables completed testing of its Linear Nitrogen Rejection Unit (NRU), achieving methane recovery rates of up to 99.5% during landfill gas upgrading. The technology expands the number of landfill sites that can economically produce pipeline-quality renewable natural gas.
Global Renewable Natural Gas Market Report Scope
Renewable Natural Gas (RNG), also known as biomethane, is a pipeline-quality fuel produced by capturing and upgrading raw biogas derived from decomposing organic waste, such as agricultural residues, food scraps, and landfill material. Through anaerobic digestion, bacteria break down organic matter to release methane, which is then processed to remove impurities such as carbon dioxide (CO2) and moisture. RNG is chemically identical to conventional fossil-derived natural gas and is fully interchangeable with traditional pipeline networks. It serves as a low-carbon energy substitute for heating, electricity generation, and vehicle transportation.
The global Renewable Natural Gas market is segmented by feedstock into landfill gas, livestock manure, agricultural residues, municipal solid waste, food waste, wastewater and sewage sludge, industrial organic waste, forestry and wood residues, and other feedstocks. By production pathway, the market is segmented into anaerobic digestion-based RNG, landfill gas-based RNG, gasification-based RNG, power-to-gas-based RNG, and other production pathways. By application, the market is segmented into transportation fuel, electricity generation, industrial fuel, residential and commercial fuel, pipeline injection, chemical and bio-based feedstock, and other applications. By form, the market is segmented into compressed RNG, liquefied RNG, and pipeline-injected RNG. Market forecasts are provided in value terms (USD). The report also covers the market size and forecasts for the global Renewable Natural Gas market across 26 countries in key regions. For each segment, market sizing and forecasts are provided on the basis of value (USD).
Segmentation Overview
| Landfill Gas |
| Livestock Manure |
| Agricultural Residues |
| Municipal Solid Waste |
| Food Waste |
| Wastewater and Sewage Sludge |
| Industrial Organic Waste |
| Forestry and Wood Residues |
| Other Feedstocks |
| Anaerobic Digestion-Based RNG |
| Landfill Gas-Based RNG |
| Gasification-Based RNG |
| Power-to-Gas-Based RNG |
| Other Production Pathways |
| Transportation Fuel |
| Electricity Generation |
| Industrial Fuel |
| Residential and Commercial Fuel |
| Pipeline Injection |
| Chemical and Bio-based Feedstock |
| Other Applications |
| Compressed RNG |
| Liquefied RNG |
| Pipeline-Injected RNG |
| North America | United States |
| Canada | |
| Mexico | |
| Europe | Germany |
| France | |
| Italy | |
| Spain | |
| United Kingdom | |
| Poland | |
| Russia | |
| Rest of Europe | |
| Asia-Pacific | China |
| India | |
| Japan | |
| South Korea | |
| Australia | |
| Indonesia | |
| Vietnam | |
| Thailand | |
| Rest of Asia-Pacific | |
| South America | Brazil |
| Argentina | |
| Chile | |
| Rest of South America | |
| Middle East and Africa | Saudi Arabia |
| United Arab Emirates | |
| Egypt | |
| South Africa | |
| Morocco | |
| Rest of Middle East and Africa |
| By Feedstock | Landfill Gas | |
| Livestock Manure | ||
| Agricultural Residues | ||
| Municipal Solid Waste | ||
| Food Waste | ||
| Wastewater and Sewage Sludge | ||
| Industrial Organic Waste | ||
| Forestry and Wood Residues | ||
| Other Feedstocks | ||
| By Production Pathway | Anaerobic Digestion-Based RNG | |
| Landfill Gas-Based RNG | ||
| Gasification-Based RNG | ||
| Power-to-Gas-Based RNG | ||
| Other Production Pathways | ||
| By Application | Transportation Fuel | |
| Electricity Generation | ||
| Industrial Fuel | ||
| Residential and Commercial Fuel | ||
| Pipeline Injection | ||
| Chemical and Bio-based Feedstock | ||
| Other Applications | ||
| By Form | Compressed RNG | |
| Liquefied RNG | ||
| Pipeline-Injected RNG | ||
| Geography | North America | United States |
| Canada | ||
| Mexico | ||
| Europe | Germany | |
| France | ||
| Italy | ||
| Spain | ||
| United Kingdom | ||
| Poland | ||
| Russia | ||
| Rest of Europe | ||
| Asia-Pacific | China | |
| India | ||
| Japan | ||
| South Korea | ||
| Australia | ||
| Indonesia | ||
| Vietnam | ||
| Thailand | ||
| Rest of Asia-Pacific | ||
| South America | Brazil | |
| Argentina | ||
| Chile | ||
| Rest of South America | ||
| Middle East and Africa | Saudi Arabia | |
| United Arab Emirates | ||
| Egypt | ||
| South Africa | ||
| Morocco | ||
| Rest of Middle East and Africa | ||
Key Questions Answered in the Report
What is the projected size of the renewable natural gas market by 2032?
The renewable natural gas market is forecast to reach USD 31.86 billion by 2032, growing at a CAGR of 9.32% from 2027.
Which feedstock leads renewable natural gas production?
Landfill gas held a 41.3% share in 2026, supported by established gas-collection infrastructure.
Which production pathway is growing the fastest?
Gasification is expected to record a CAGR of 10.3% through 2032, as it can process mixed and contaminated waste streams.
Why is industrial demand for renewable natural gas increasing?
Industrial users can deploy renewable natural gas in existing gas equipment, reducing the need for major process changes in high-temperature operations.
Which region is growing the fastest?
Europe is expected to grow at a CAGR of 10.9% through 2032, supported by EU biomethane targets and national support frameworks.
What constrains project development?
Credit-price volatility, gas upgrading costs, and pipeline interconnection charges can make project financing more difficult, particularly for smaller projects.