Market Overview
| Study Period | 2021 - 2031 |
|---|---|
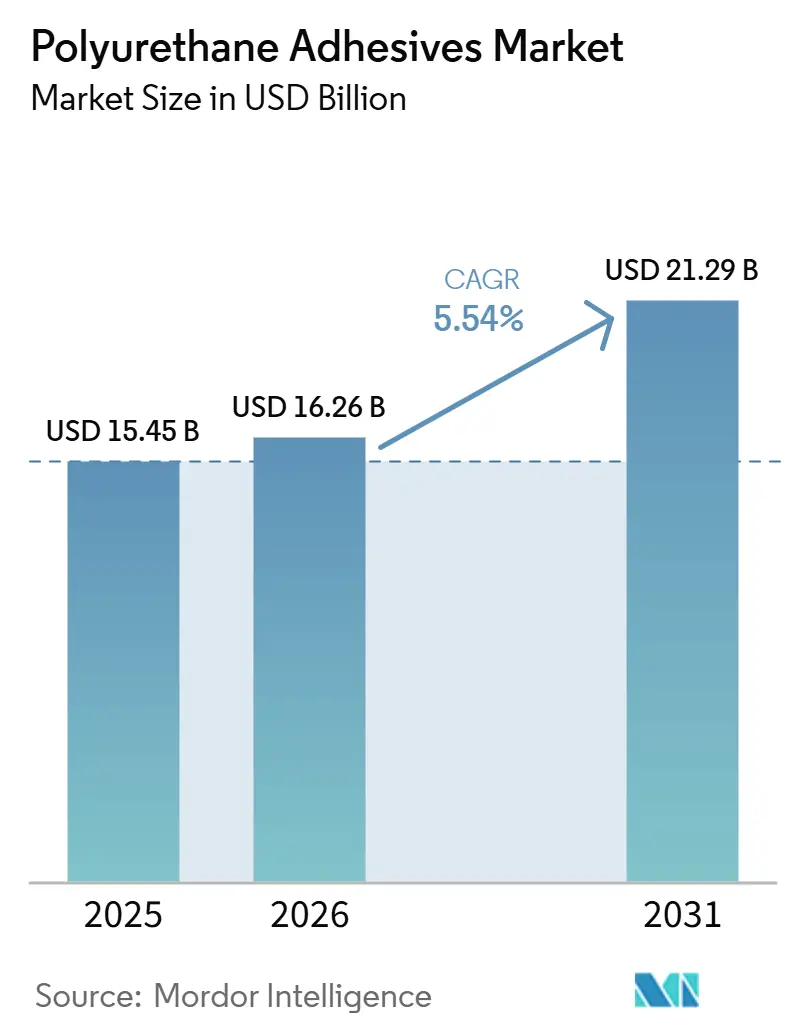
| Market Size (2026) | USD 16.26 Billion |
| Market Size (2031) | USD 21.29 Billion |
| Growth Rate (2026 - 2031) | 5.54% CAGR |
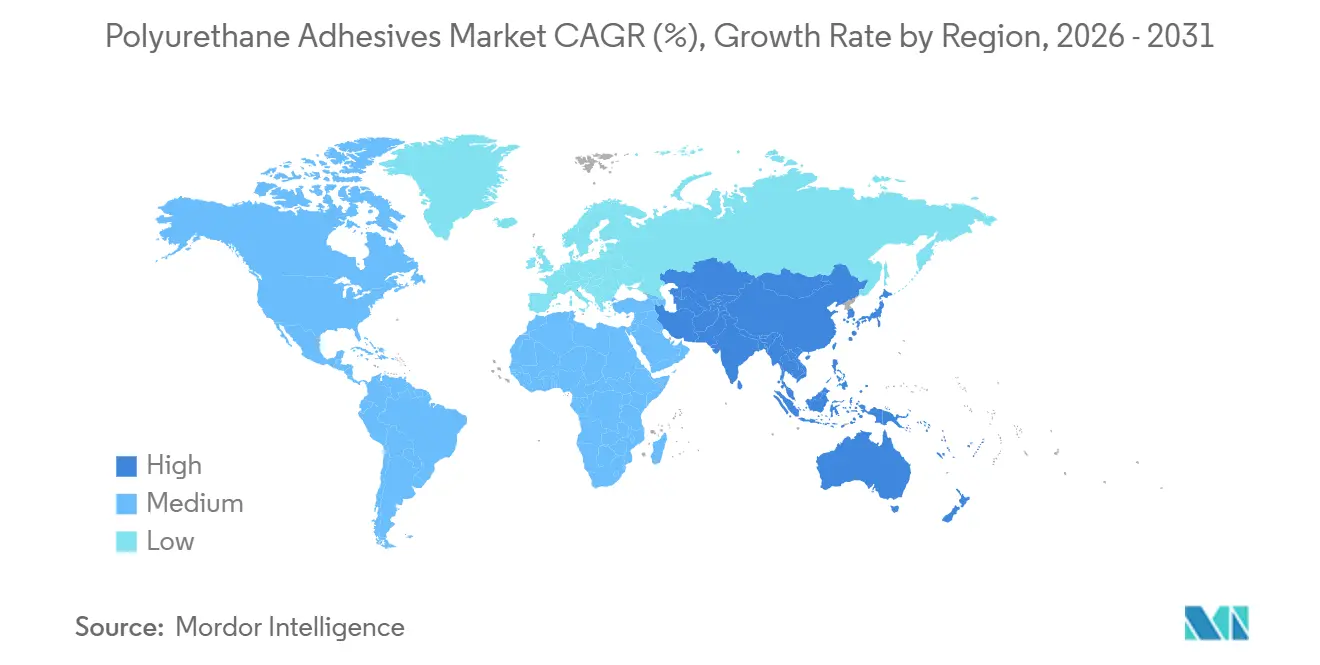
| Fastest Growing Market | Asia Pacific |
| Largest Market | Asia-Pacific |
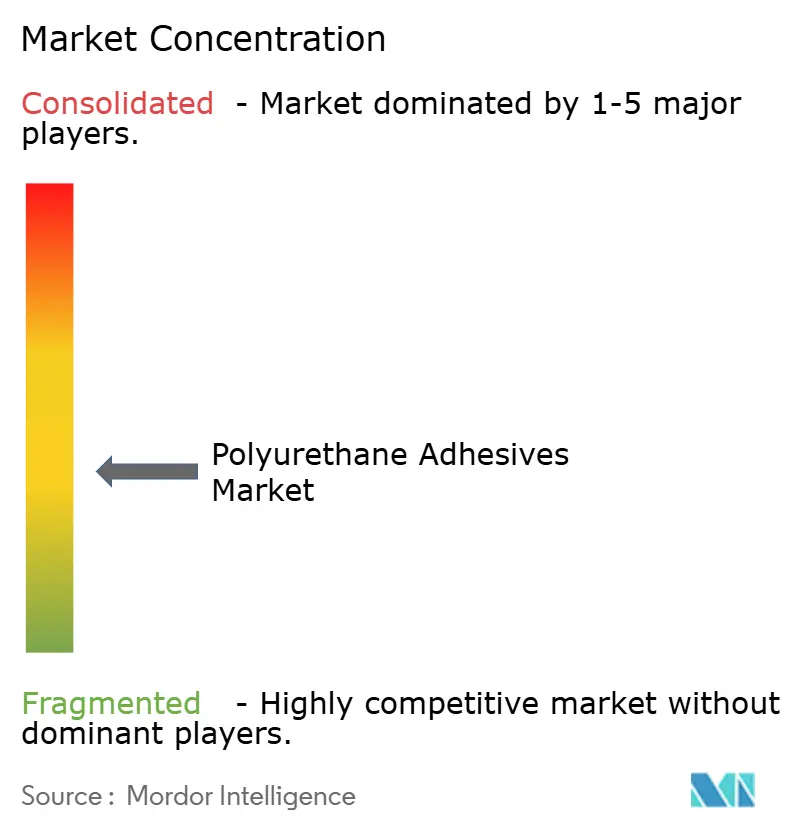
| Market Concentration | Medium |
Major Players *Disclaimer: Major Players sorted in no particular order Image © Mordor Intelligence. Reuse requires attribution under CC BY 4.0. | |
Polyurethane Adhesives Market Analysis by Mordor Intelligence
The Polyurethane Adhesives Market size is expected to increase from USD 15.45 billion in 2025 to USD 16.26 billion in 2026 and reach USD 21.29 billion by 2031, growing at a CAGR of 5.54% over 2026-2031. Regulatory pressures to curb volatile organic compounds are hastening the transition from solvent-borne to reactive and water-borne chemistries, with the European Union's mid-2026 thresholds leading the charge. Concurrently, REACH's limits on isocyanate exposure and the 2025/40 Packaging and Packaging Waste Regulation are pushing industries towards ultra-low-monomer and PFAS-free grades, particularly in packaging and construction. The Asia-Pacific region stands as the primary demand hub, supported by infrastructure investments in China and India and the growing adoption of new-energy vehicles, which are driving significant regional growth. On the supply front, Henkel, Sika, and Arkema's strategic acquisitions hint at a consolidation trend, focusing on specialty technologies and regional reach. Meanwhile, capacity expansions in Suzhou and Sealy are bolstering the local supply of high-viscosity and roofing-grade polyurethane systems.
Key Report Takeaways
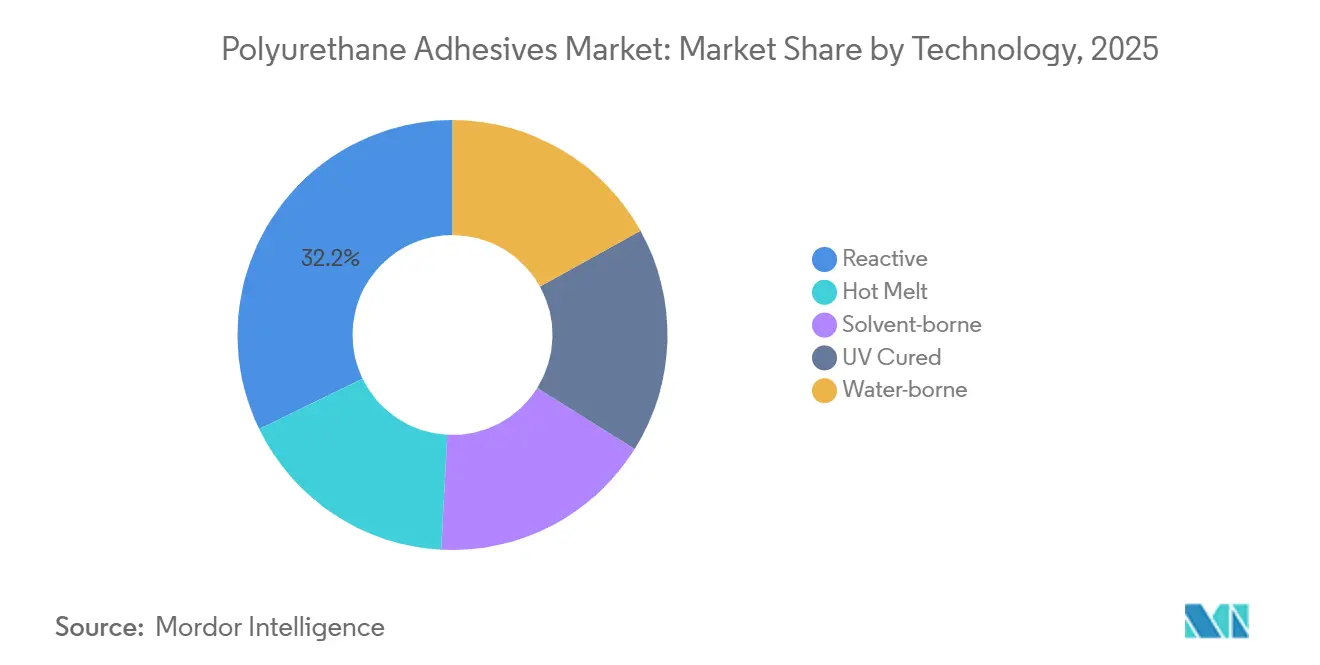
- By technology, reactive polyurethane adhesives led with a 32.21% share of the polyurethane adhesives market in 2025, whereas UV-cured systems are projected to expand at a 7.12% CAGR between 2026 and 2031.
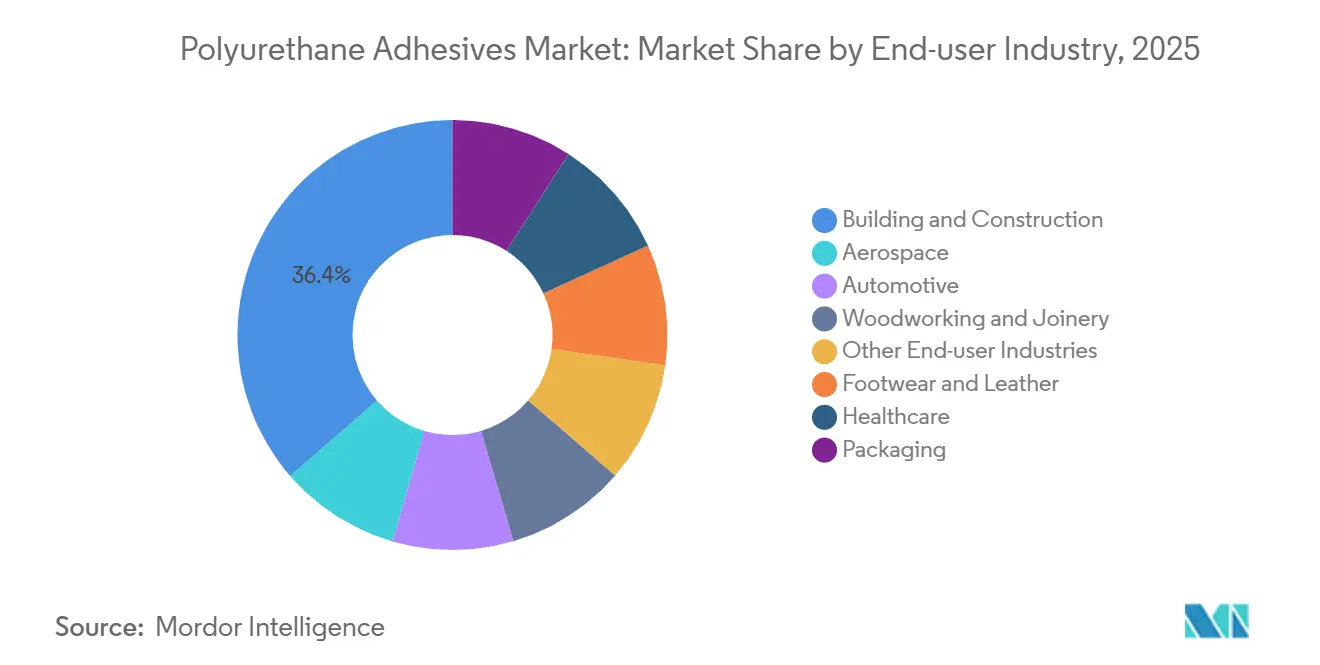
- By end-user industry, building and construction accounted for 36.40% of the polyurethane adhesives market share in 2025, and healthcare is advancing at a 7.45% CAGR between 2026 and 2031.
- By geography, Asia-Pacific held 45.20% of the polyurethane adhesives market share in 2025 and is forecast to grow at a 7.34% CAGR between 2026 and 2031.
Note: Market size and forecast figures in this report are generated using Mordor Intelligence’s proprietary estimation framework, updated with the latest available data and insights as of January 2026.
Global Polyurethane Adhesives Market Trends and Insights
Drivers Impact Analysis*
| Driver | (~) % Impact on CAGR Forecast | Geographic Relevance | Impact Timeline |
|---|---|---|---|
| Construction boom in emerging Asia-Pacific economies | +1.20% | Asia-Pacific (China, India, Indonesia, Thailand) with spillover to the Middle East and Africa | Medium term (2-4 years) |
| Light-weighting trend across automotive and aerospace original equipment manufacturers | +0.90% | Global, with concentration in North America, Europe, and China | Long term (≥ 4 years) |
| Shift from solvent-borne to reactive and eco-friendly chemistries | +1.40% | Europe and North America leading; Asia-Pacific following with regulatory lag | Short term (≤ 2 years) |
| Emergence of modular off-site construction processes | +0.70% | Europe and North America core; expanding to Asia-Pacific urban centers | Medium term (2-4 years) |
| Rapid adoption of AI-controlled dispensing robots on assembly lines | +0.50% | Global, with early adoption in automotive and electronics hubs (Germany, Japan, South Korea, United States) | Short term (≤ 2 years) |
| Source: Mordor Intelligence | |||


Construction Boom in Emerging Asia-Pacific Economies
India’s stepped-up capital expenditure under the National Infrastructure Pipeline is stimulating demand for curtain walls, flooring, and prefab interiors bonded with structural polyurethane adhesives. In China, construction applications already represent a major share of adhesive output value, and growth is pivoting toward battery modules, photovoltaic arrays, and aerospace assemblies that favor low-VOC, fast-cure grades. Suppliers that can certify low residual monomer content and lifecycle durability are gaining preferred-vendor status on large public tenders[1]Bond Tech Industries, “Why Solvent-Free Adhesives Offer Greater Practicality for Manufacturers,” bond-tech-industries.com. The scale of regional infrastructure programs offers procurement leverage that rewards high-volume, sustainability-aligned chemistries. As projects emphasize net-zero targets, polyurethane formulations compatible with automated spraying and panel lamination are displacing solvent-borne epoxies.
Light-Weighting Trend Across Automotive and Aerospace Original Equipment Manufacturers
Automakers are replacing welded reinforcements with adhesive-bonded multi-material joints to enhance fuel economy and crash energy absorption. Polyurethane systems supply vibration damping and gap-filling flexibility, complementing rigid epoxy structures in electric-vehicle battery packs. In aerospace, Hexcel’s Modipur injection polyurethane allows complex composite components to cure at low temperatures and short cycles, broadening high-volume applications. OEM examples such as BMW i3/i8 and Airbus A350 underscore the requirement for adhesives that preserve fiber integrity in carbon composites. The resulting demand shift favors polyurethanes tuned for elongation, thermal cycling, and chemical resistance. Long-term contracts reward suppliers offering validated data for multi-substrate compatibility and fatigue life.
Shift From Solvent-Borne to Reactive and Eco-Friendly Chemistries
The European Union’s mid-2026 VOC limits compel manufacturers to accelerate water-borne and reactive conversions and publish environmental product declarations to maintain market access. In the United States, the EPA and the Southern California AQMD Rule 1168 are driving similar specifications, with project delays and warranty risks for non-compliant products. Solvent-free polyurethane laminating adhesives cut coat-weight to 0.8-2.5 g/m² and enable line speeds up to 350 m/min, reducing energy and solvent-recovery costs. PFAS-free mandates under the EU Packaging and Packaging Waste Regulation 2025/40 are hastening the adoption of precision metering equipment to protect recyclability grades. Formulators that deliver ultra-low-monomer polyurethane chemistries gain a compliance edge while shortening cure and inventory cycles for converters.
Emergence of Modular Off-Site Construction Processes
Developers in Europe and North America are scaling factory-built modules that rely on structural adhesives to distribute stress uniformly and remove heavy fasteners. Smart polyurethane formulations with self-healing or antimicrobial functions extend the service life of healthcare and residential units. Panel lamination for refrigerated trucks and structural insulated panels benefits from gap-filling expansion, chemical resistance, and compatibility with foams and composites. Contractors favor fast-cure, low-VOC grades that integrate smoothly with robotic dispensing and support end-of-life disassembly. Consequently, polyurethane adhesives capturing modular-construction standards secure multi-year framework agreements.
Restraints Impact Analysis*
| Restraint | (~) % Impact on CAGR Forecast | Geographic Relevance | Impact Timeline |
|---|---|---|---|
| Volatility in methylene diphenyl diisocyanate and toluene diisocyanate raw-material prices | -0.80% | Global, with Europe most pressured by high energy costs and Asian import competition | Short term (≤ 2 years) |
| Stringent VOC and isocyanate-exposure regulations, especially in European Union and United States | -0.60% | Europe and North America leading; regulatory tightening spreading to Asia-Pacific | Medium term (2-4 years) |
| Growing competition from silane-modified polyether systems | -0.40% | Global, with early adoption in Europe for construction and assembly adhesives | Long term (≥ 4 years) |
| Source: Mordor Intelligence | |||
Volatility in Methylene Diphenyl Diisocyanate and Toluene Diisocyanate Raw-Material Prices
Weak downstream demand kept isocyanate operating rates moderate in 2025, and price recovery in 2026 hinges more on outages or consolidation than on volume growth. European producers face margin pressure from elevated energy costs and cheaper Asian imports, while the United States-China tariff suspensions have stabilized logistics without boosting demand[2]Regina Sousa, “MDI and TDI Market Review 2025 and Outlook for 2026,” resourcewise.com. Adhesive formulators struggle to pass through cost swings, compressing margins and accelerating the search for ultra-low-monomer or isocyanate-free alternatives. This dynamic nudges converters toward aliphatic solvent-free polyurethane or hybrid chemistries that insulate them from raw-material volatility.
Stringent VOC and Isocyanate-Exposure Regulations
REACH now caps isocyanate content and mandates handler training, whereas OSHA applies exposure limits without a specific training clause, creating compliance complexity for global brands. The EU Packaging regulation also limits primary aromatic amine migration to 0.01 mg/kg, pushing formulators toward faster-curing ultra-low-monomer systems. Public projects guided by LEED and WELL demand documented low-emission adhesives, effectively excluding suppliers lacking transparent certifications. Compliance investments in analytics and safer precursors raise entry barriers but reward early movers with premium positioning.
*Our forecasts treat driver/restraint impacts as directional, not additive. The impact forecasts reflect baseline growth, mix effects, and variable interactions.
Segment Analysis
By Technology: Reactive Grades Dominate While UV-Cure Gains Speed
Reactive systems accounted for a 32.21% share of the polyurethane adhesives market in 2025, reflecting their solvent-free nature, moisture-curing profile, and proven performance on laminates, composites, and multi-layer films. Within this cohort, ultra-low-monomer variants are increasing line speeds and shortening cure windows, thereby expanding the polyurethane adhesives market size for high-throughput flexible packaging lines. UV-cured grades, projected to advance at a 7.12% CAGR between 2026 and 2031, attract medical-device and electronics assemblers that need clear bonds and minimal thermal stress.
Short-wave UV initiators now deliver full cure in under five seconds, enabling inline quality checks and reducing work-in-process inventory. Water-borne polyurethane dispersions are also gaining share in footwear stations that target lower VOC profiles and safer work environments. As converters retrofit lines for precision metering and robot-controlled bead placement, the polyurethane adhesives market records higher pull-through for hybrid chemistries tailored to automated dispensing. Suppliers offering data on rheology drift, nozzle clog resistance, and post-cure green strength solidify preferred-supplier status, expanding the polyurethane adhesives market size within midsize converters upgrading equipment.


By End-User Industry: Construction Leads While Healthcare Accelerates
The building and construction segment generated 36.40% of global demand in 2025, underpinned by panel bonding, curtain-wall sealing, and glass-to-frame adhesion that remove mechanical fasteners and improve aesthetics. High-rise façades in Asia-Pacific often specify ultra-clear, UV-stable polyurethane sealants, keeping the polyurethane adhesives market size firmly anchored in infrastructure cycles.
Healthcare is the fastest-growing end use, projected at a 7.45% CAGR between 2026 and 2031, as regulators phase out DEHP-based PVC and device makers migrate to thermoplastic elastomers bonded with ISO 10993-certified grades such as Loctite AA 3952. Wearable sensors, wound-care films, and minimally invasive devices require skin-friendly, low-extractable adhesives, expanding the polyurethane adhesives market well beyond traditional assembly roles. Automotive and aerospace programs that prioritize lightweighting and battery safety further diversify end-use pull, ensuring sustained momentum for the polyurethane adhesives industry across multiple value chains.
Geography Analysis
Asia-Pacific held 45.20% of the market in 2025 and is forecast to grow at 7.34% through 2026 to 2031. Infrastructure investments in the region are fueling sustained demand for panel, flooring, and module assemblies. In response, domestic leaders are expanding design capacities to meet increasing regional needs in flexible packaging, solar modules, and new-energy vehicles. Additionally, as urban retrofits surge in Indonesia and Thailand, there's an increasing demand for low-VOC façade and interior bonding systems, further amplifying opportunities in the polyurethane adhesives market.
North America and Europe show solid replacement demand for smart structural adhesives in modular housing, automated automotive lines, and aerospace composites. Sika’s expansion in Sealy, Texas, and Henkel’s AI-enabled battery-adhesive platform illustrate regional commitment to high-viscosity and specialty grades that shorten development cycles. Stricter REACH and California AQMD limits steer orders toward water-borne and reactive hybrids, enlarging the polyurethane adhesives market size for compliance-ready chemistries.
South America, the Middle-East, and Africa benefit from Sika’s new mortar and admixture plants in Brazil and Morocco. Public housing programs and renewable-energy parks in Brazil and Morocco favor durable, weather-resistant bond lines, extending polyurethane adhesives market penetration into climates with high UV exposure and thermal cycling. Although per-capita consumption trails developed regions, steady infrastructure pipelines promise double-digit volume gains for suppliers that localize technical support and stocking points.

Competitive Landscape
The Polyurethane Adhesives Market is moderately fragmented. Innovation rivalry centers on bio-based polyols, hybrid silane chemistries, and AI-guided formulation. Wacker’s high-speed hybrid-polymer line in Germany answers European demand for isocyanate-free, tin-free sealants. Henkel and Citrine Informatics use machine learning to predict cure profiles and optimize joint strength, cutting development time by half. Private-equity platforms continue to bolt on regional specialists, pushing valuation multiples higher and intensifying competition for niche assets that expand the polyurethane adhesives market footprint.
Polyurethane Adhesives Industry Leaders
3M
H.B. Fuller Company
Henkel AG & Co. KGaA
Sika AG
Arkema
- *Disclaimer: Major Players sorted in no particular order

Recent Industry Developments
- February 2026: Henkel agreed to acquire Dutch specialty-coatings company Stahl for EUR 2.1 billion (USD 2.5 billion), boosting its Adhesive Technologies unit. This deal is expected to strengthen innovation and expand polyurethane adhesive applications globally.
- February 2026: Sika announced its agreement to acquire Akkim, a Turkey-based adhesives and sealants manufacturer. The acquisition aligns with Sika's Strategy 2028, enhancing production capacity, distribution, and research and development capabilities. It strengthens Sika's polyurethane adhesive innovation and competitiveness in high-growth markets.


Global Polyurethane Adhesives Market Report Scope
Polyurethane adhesives are versatile bonding agents created from polymeric isocyanates and polyols that cure into strong, durable networks. They provide excellent adhesion to diverse substrates such as wood, metal, plastics, composites, and glass. Known for flexibility, moisture resistance, and high mechanical strength, they are widely used in construction, automotive, packaging, footwear, and healthcare industries, enabling lightweight structures, reliable seals, and long-lasting performance across demanding applications.
The Polyurethane Adhesives Market is segmented by technology, end-user industry, and geography. By technology, the market is segmented into hot melt, reactive, solvent-borne, UV cured, and water-borne. By end-user industry, the market is segmented into aerospace, automotive, building and construction, footwear and leather, healthcare, packaging, woodworking and joinery, and other end-user industries. The report also covers the market size and forecasts for the Polyurethane Adhesives Market in 22 countries across major regions. For each segment, the market sizing and forecasts have been done on the basis of value (USD).
By Technology
| Hot Melt |
| Reactive |
| Solvent-borne |
| UV Cured |
| Water-borne |
By End-user Industry
| Aerospace |
| Automotive |
| Building and Construction |
| Footwear and Leather |
| Healthcare |
| Packaging |
| Woodworking and Joinery |
| Other End-user Industries |
By Geography
| Asia-Pacific | China |
| Japan | |
| India | |
| South Korea | |
| Indonesia | |
| Thailand | |
| Malaysia | |
| Singapore | |
| Australia | |
| Rest of Asia-Pacific | |
| North America | United States |
| Canada | |
| Mexico | |
| Europe | Germany |
| France | |
| United Kingdom | |
| Italy | |
| Spain | |
| Russia | |
| Rest of Europe | |
| South America | Brazil |
| Argentina | |
| Rest of South America | |
| Middle-East and Africa | Saudi Arabia |
| South Africa | |
| Rest of Middle-East and Africa |
| By Technology | Hot Melt | |
| Reactive | ||
| Solvent-borne | ||
| UV Cured | ||
| Water-borne | ||
| By End-user Industry | Aerospace | |
| Automotive | ||
| Building and Construction | ||
| Footwear and Leather | ||
| Healthcare | ||
| Packaging | ||
| Woodworking and Joinery | ||
| Other End-user Industries | ||
| By Geography | Asia-Pacific | China |
| Japan | ||
| India | ||
| South Korea | ||
| Indonesia | ||
| Thailand | ||
| Malaysia | ||
| Singapore | ||
| Australia | ||
| Rest of Asia-Pacific | ||
| North America | United States | |
| Canada | ||
| Mexico | ||
| Europe | Germany | |
| France | ||
| United Kingdom | ||
| Italy | ||
| Spain | ||
| Russia | ||
| Rest of Europe | ||
| South America | Brazil | |
| Argentina | ||
| Rest of South America | ||
| Middle-East and Africa | Saudi Arabia | |
| South Africa | ||
| Rest of Middle-East and Africa | ||


Market Definition
- End-user Industry - Building & Construction, Packaging, Automotive, Aerospace, Woodworking & Joinery, Footwear & Leather, Healthcare, and Others are the end-user industries considered under the polyurethane adhesives market.
- Product - All polyurethane adhesive products are considered in the market studied
- Resin - Under the scope of the study, thermoset and thermoplastic based polyurethanes are considered
- Technology - For the purpose of this study, Water-borne, Solvent-borne, Reactive, Hot Melt, and UV Cured adhesive technologies are taken into consideration.
| Keyword | Definition |
|---|---|
| Hot-melt Adhesive | Hot melt adhesives are generally 100% solid formulations, based on thermoplastic polymers. They are solid at room temperature and are activated upon heating above their softening point, at which stage they are liquid, and hence, can be processed. |
| Reactive Adhesive | A reactive adhesive is made up of monomers that react in the adhesive curing process and do not evaporate from the film during use. Instead, these volatile components become chemically incorporated into the adhesive. |
| Solvent-borne Adhesive | Solvent-borne adhesives are mixtures of solvents and thermoplastic, or slightly cross-linked polymers, such as polychloroprene, polyurethane, acrylic, silicone, and natural and synthetic rubbers (elastomers). |
| Water-borne Adhesive | Water-borne adhesives use water as a carrier or diluting medium to disperse a resin. They are set by allowing the water to evaporate or be absorbed by the substrate. These adhesives are compounded with water as a diluent, rather than a volatile organic solvent. |
| UV Cured Adhesive | UV curing adhesives induce curing and create a permanent bond without heating by using ultraviolet (UV) light or other radiation sources. An aggregation of monomers and oligomers is cured or polymerized by ultraviolet (UV) or visible light in a UV adhesive. Because UV is a radiating energy source, UV adhesives are often referred to as radiation curing or rad-cure adhesives. |
| Heat-resistant Adhesive | Heat-resistant Adhesives refer to those that do not break down under high temperatures. One aspect of a complicated system of circumstances is the adhesive's capacity to withstand disintegration brought on by high temperatures. As the temperature rises, adhesives may liquefy. They can withstand stresses resulting from differing coefficients of expansion and contraction, which might be an additional advantage. |
| Reshoring | Reshoring is the practice of moving commodity production and manufacturing back to the nation where the business was founded. Onshoring, inshoring, and back shoring are further terms used. Offshoring, the practice of producing items abroad to lower labor and manufacturing costs, is the opposite of this. |
| Oleochemicals | Oleochemicals are compounds produced from biological oils or fats. They resemble petrochemicals, which are substances made from petroleum. The oleochemical business is built on the hydrolysis of oils or fats. |
| Nonporous Materials | Nonporous materials are substances that do not permit the passage of liquid or air. Nonporous materials are those that are not porous, such as glass, plastic, metal, and varnished wood. Since no air can get through, less airflow is required to raise these materials, negating the requirement for high airflow. |
| EU-Vietnam Free Trade Agreement | A trade agreement and an investment protection agreement were concluded between the European Union and Vietnam on June 30, 2019. |
| VOC content | Compounds with limited solubility in water and high vapor pressure are known as Volatile Organic Compounds (VOCs). Many VOCs are human-made chemicals that are used and produced in the manufacture of paints, pharmaceuticals, and refrigerants. |
| Emulsion Polymerization | Emulsion polymerization is a method of producing polymers or connected groups of smaller chemical chains known as monomers, in a water solution. The method is often used to make water-based paints, adhesives, and varnishes, in which the water stays with the polymer and is marketed as a liquid product. |
| 2025 National Packaging Targets | In 2018, the Australian Environment Ministry set the following 2025 National Packaging Targets: 100% of the packaging must be reusable, recyclable, or compostable by 2025, 70% of plastic packaging must be recycled or composted by 2025, 50% of average recycled content must be included in packaging by 2025, and problematic and unnecessary single-use plastic packaging must be phased out by 2025. |
| Russian Government’s Import Substitution Policy | The Western sanctions suspended the distribution of several high-tech items to Russia, including those required by the raw material export sectors and the military-industrial complex. In response, the government launched an "import substitution" scheme, appointing a special commission to oversee its implementation in early 2015. |
| Paper Substrate | Paper substrates are paper sheets, reels, or boards with a base weight of up to 400 g/m2 that has not been converted, printed or otherwise altered. |
| Insulation Material | A material that inhibits or blocks heat, sound, or electrical transmission is known as Insulation Material. The variety of insulation materials includes thick fibers like fiberglass, rock and slag wool, cellulose, and natural fibers as well as stiff foam boards and sleek foils. |
| Thermal Shock | A temperature change known as thermal shock generates stress in a material. It commonly results in material breakdown and is especially prevalent in brittle materials like ceramics. When there is a quick temperature change, either from hot to cold or vice versa, this process occurs abruptly. It occurs more frequently in materials with poor heat conductivity and insufficient structural integrity. |


Research Methodology
Mordor Intelligence follows a four-step methodology in all our reports.
- Step-1: Identify Key Variables: The quantifiable key variables (industry and extraneous) pertaining to the specific product segment and country are selected from a group of relevant variables & factors based on desk research & literature review; along with primary expert inputs. These variables are further confirmed through regression modeling (wherever required).
- Step-2: Build a Market Model: In order to build a robust forecasting methodology, the variables and factors identified in Step-1 are tested against available historical market numbers. Through an iterative process, the variables required for market forecast are set and the model is built on the basis of these variables.
- Step-3: Validate and Finalize: In this important step, all market numbers, variables and analyst calls are validated through an extensive network of primary research experts from the market studied. The respondents are selected across levels and functions to generate a holistic picture of the market studied.
- Step-4: Research Outputs: Syndicated Reports, Custom Consulting Assignments, Databases & Subscription Platforms


