Airless Tires Market Size and Share
Market Overview
| Study Period | 2020 - 2031 |
|---|---|
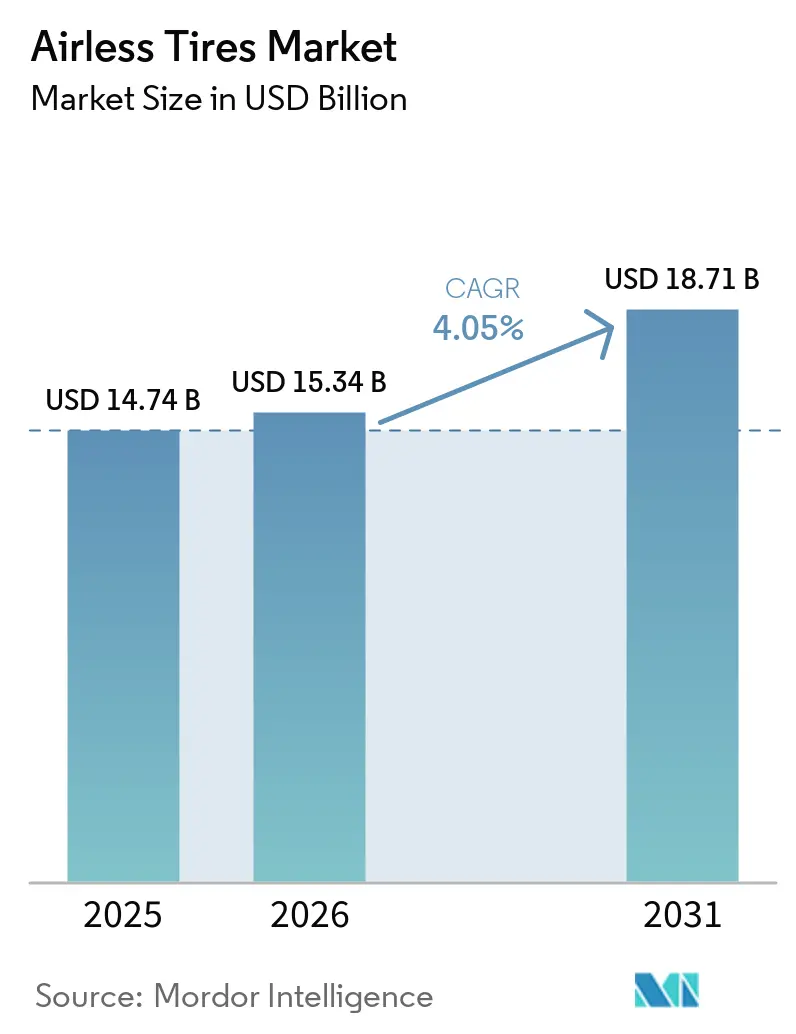
| Market Size (2026) | USD 15.34 Billion |
| Market Size (2031) | USD 18.71 Billion |
| Growth Rate (2026 - 2031) | 4.05% CAGR |
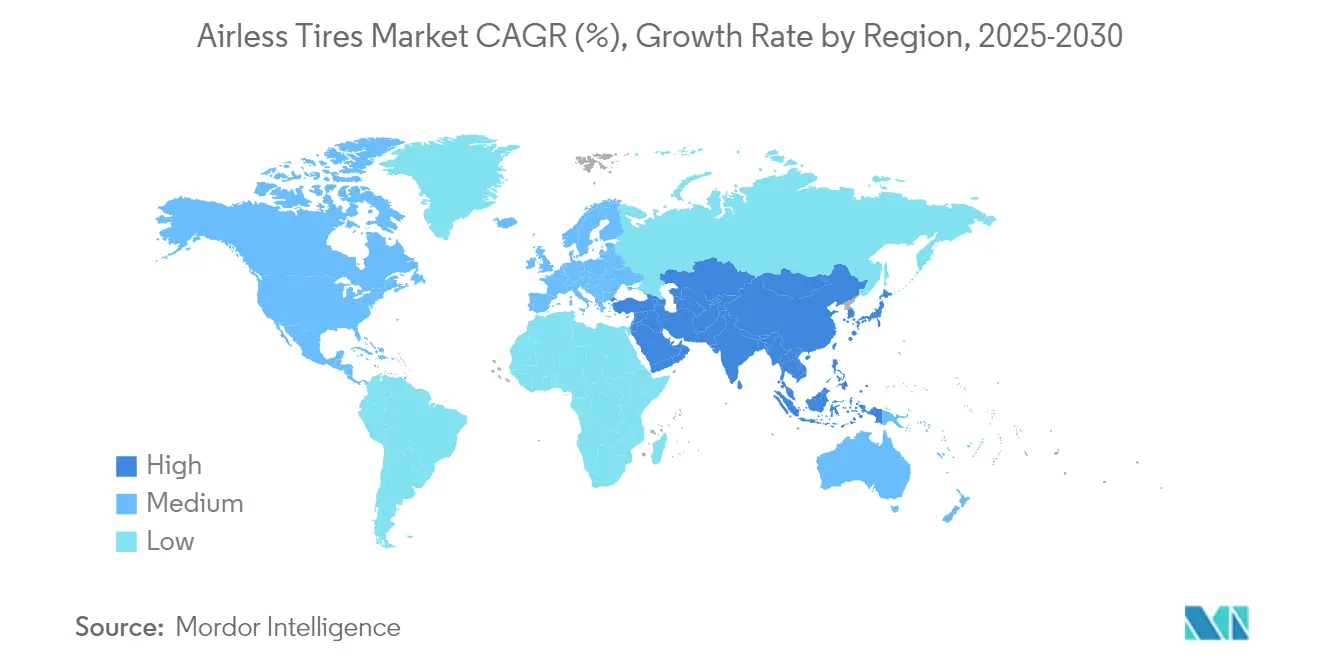
| Fastest Growing Market | Asia Pacific |
| Largest Market | Asia Pacific |
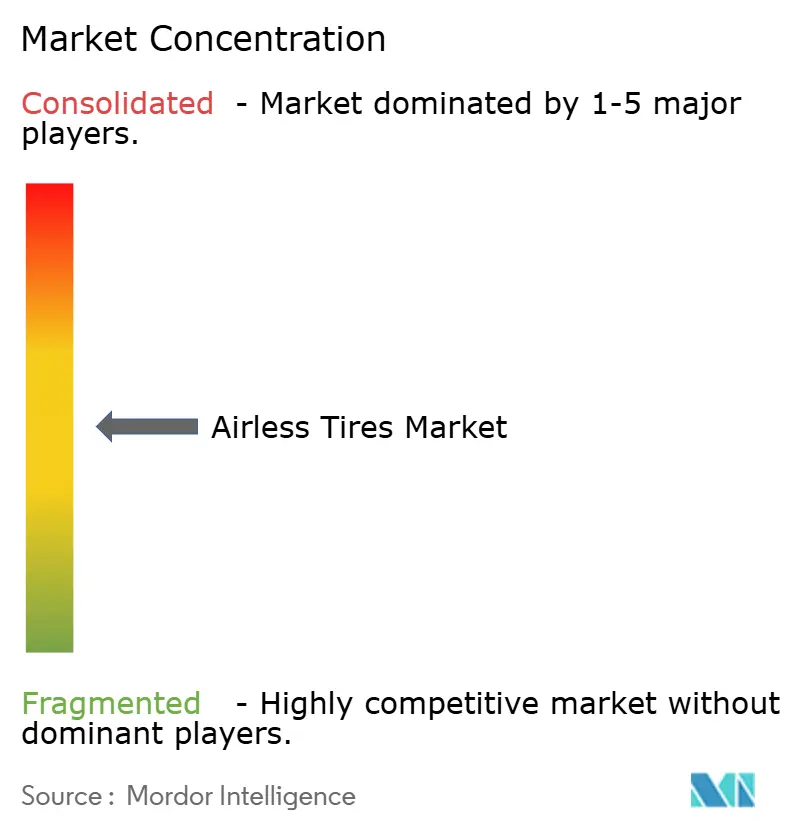
| Market Concentration | Medium |
Major Players *Disclaimer: Major Players sorted in no particular order Image © Mordor Intelligence. Reuse requires attribution under CC BY 4.0. | |
Airless Tires Market Analysis by Mordor Intelligence
The airless tires market size was valued at USD 14.74 billion in 2025 and estimated to grow from USD 15.34 billion in 2026 to reach USD 18.71 billion by 2031, at a CAGR of 4.05% during the forecast period (2026-2031). The transition from prototypes to commercial lines is progressing as electric-vehicle (EV) makers seek puncture-proof solutions, defense agencies specify run-flat mobility platforms, and sustainability regulations tighten disposal rules. Partnerships such as Tesla’s ongoing testing discussions with Michelin’s Uptis line illustrate how original equipment manufacturer (OEM) engagement accelerates mainstream acceptance. Rising demand from mining fleets, expanding micro-mobility services, and rapid iteration enabled by 3-D printed lattice structures further reinforce the airless tires market growth path. Incumbent tire firms deploy deep materials-science portfolios, yet higher unit costs and certification limits above 130 km/h continue to moderate the near-term adoption curve.
Key Report Takeaways
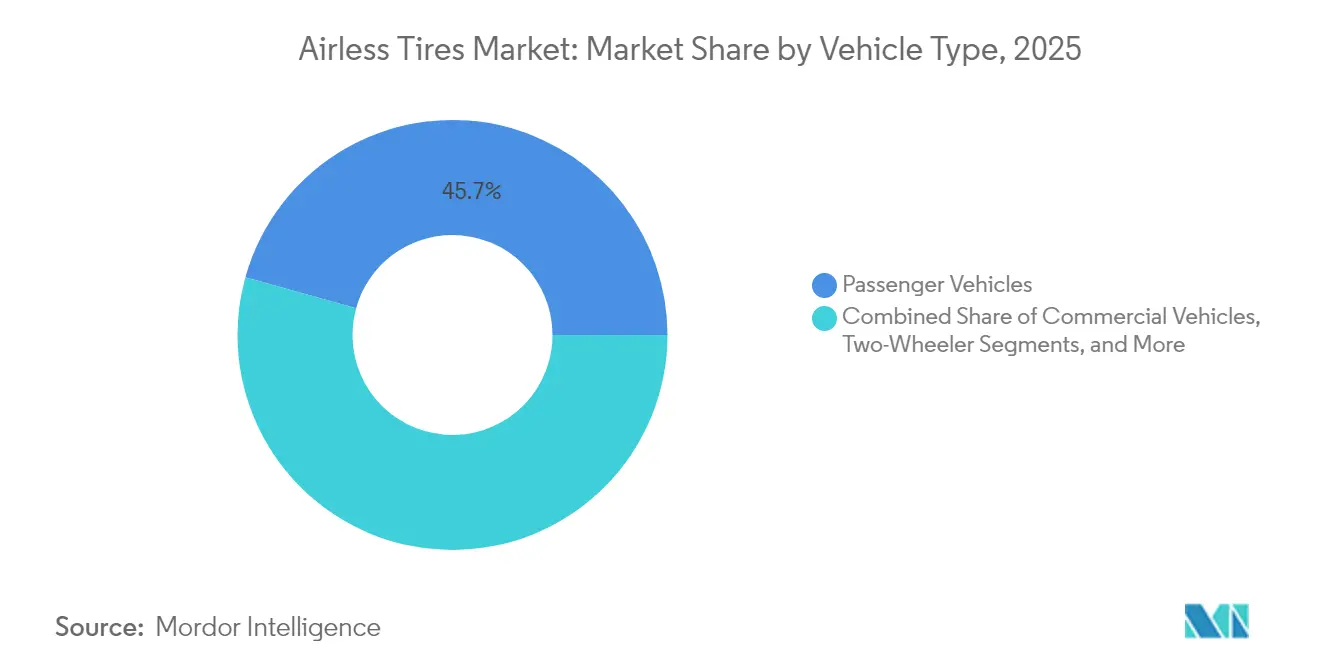
- By vehicle type, passenger vehicles led with 45.68% of the airless tires market share in 2025, whereas off-road vehicles are projected to grow at 7.12% CAGR through 2031.
- By material, rubber dominated 64.74% of the airless tires market share in 2025; composite elastomers are projected to expand at a 5.89% CAGR between 2026-2031.
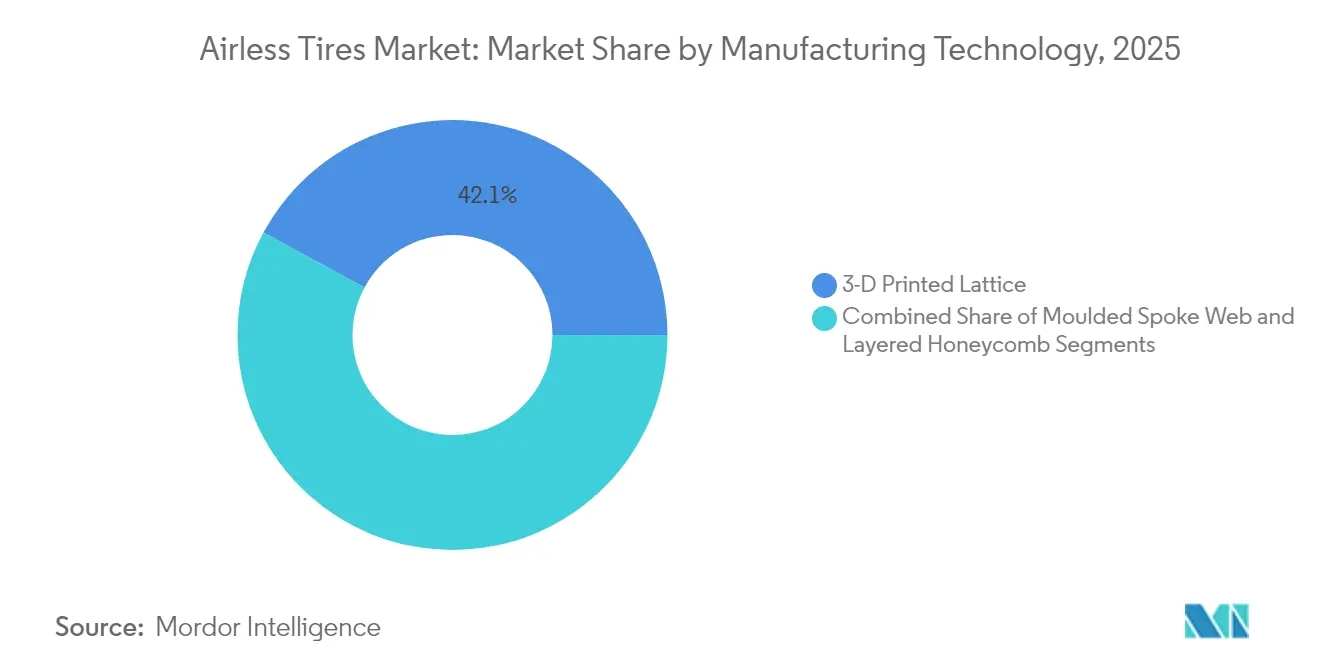
- By manufacturing technology, 3-D printed lattice designs commanded 42.10% share of the airless tires market size in 2025, while layered honeycomb structures will record the highest projected CAGR at 5.52% through 2031.
- By sales channel, the OEM channel held 59.05% share of the airless tires market in 2025, while the aftermarket is forecast to grow at 6.42% CAGR through 2031.
- By geography, Asia-Pacific accounted for 38.20% of the revenue share of the airless tires market in 2025, and it is advancing at an 7.88% CAGR to 2031.
Note: Market size and forecast figures in this report are generated using Mordor Intelligence’s proprietary estimation framework, updated with the latest available data and insights as of 2026.
Global Airless Tires Market Trends and Insights
Drivers Impact Analysis*
| Driver | (~) % Impact on CAGR Forecast | Geographic Relevance | Impact Timeline |
|---|---|---|---|
| Rapid Puncture-proof Solutions Demanded by EV OEMs | +0.8% | North America, China | Medium term (2-4 years) |
| Mining Sector Push to Cut Tyre Downtime | +0.7% | Asia Pacific core, MEA, South America | Medium term (2-4 years) |
| Rising Military Spending on Run-flat Mobility Platforms | +0.6% | North America, Europe, Asia Pacific | Long term (≥ 4 years) |
| Stricter EU Landfill Rules favoring Recyclable Non-pneumatics | +0.5% | Europe, spill-over to North America | Medium term (2-4 years) |
| 3-D Printed Lattice Wheels slashing Prototyping Cycles | +0.4% | Global advanced manufacturing hubs | Short term (≤ 2 years) |
| Growing Micro-mobility Fleets for Last-mile Logistics | +0.3% | Urban centers worldwide | Short term (≤ 2 years) |
| Source: Mordor Intelligence | |||
Rapid Puncture-Proof Solutions Demanded by EV OEMs
EV makers eliminate spare-tire space to extend cabin volume and curb weight; doing so elevates the cost of roadside failures. Uptis trials with Tesla illustrate how a single OEM decision can pull the wider airless tires market toward volume adoption. Fleet operators report up to 80% fewer breakdowns after switching to non-pneumatic tires, cutting unplanned downtime costs. Higher load tolerance for battery mass and torque aligns with airless construction advantages, while Michelin projects 200 million tire scrappage avoidance annually once deployment scales. These factors position EV platforms as the medium-term catalyst for the airless tires market momentum.
Mining Sector Push to Cut Tire Downtime
Haul-truck immobilization can exceed USD 100,000 in lost ore output. Bridgestone’s Smart On-Site bundle couples airless tires with AI diagnostics, delivering predictive scheduling for pit fleets. Michelin’s tire recycling plant in Chile processes 30,000 tons of earthmover tires annually, linking durability with circular value capture. The proven ROI persuades mine operators to accept premium pricing, sustaining Asia-Pacific-led expansion of the airless tires market.
Rising Military Spending on Run-Flat Mobility Platforms
Defense buyers value mission continuity; American Engineering Group’s Pressure Zero tire enables 50 mph travel for 60 miles post-puncture.[1]U.S. Small Business Innovation Research Program, “Topic A18-101 Non-Pneumatic Tires,” sbir.gov The U.S. Army SBIR topic A18-101 formally requested non-pneumatic concepts, signaling sustained procurement support. Michelin’s X Tweel has passed ballistic testing, validating survivability beyond road debris threats. Once vetted under combat conditions, designs often migrate to commercial fleets, extending the airless tires market reach.
Stricter EU Landfill Rules Favoring Recyclable Non-Pneumatics
Euro 7 sets tyre abrasion thresholds while wider EU waste directives tighten producer responsibility, creating incentives for recyclable architectures.[2]International Council on Clean Transportation, “Euro 7 Proposal: New Light-Duty Vehicle Pollutant Limits,” theicct.org Continental and Michelin now incorporate recovered carbon black and bio-sourced feedstocks, aligning product portfolios with circular-economy legislation. Compliance deadlines between 2028 and 2032 lock in multi-year demand visibility, reinforcing airless tires market investment cases.
Restraints Impact Analysis*
| Restraint | (~) % Impact on CAGR Forecast | Geographic Relevance | Impact Timeline |
|---|---|---|---|
| Higher Unit Cost versus Radial Tires | -0.9% | Global price-sensitive markets | Medium term (2-4 years) |
| Limited High-speed Load Certifications | -0.6% | North America, Europe | Long term (≥ 4 years) |
| OEM Hesitation due to NVH Concerns | 0.5% | Premium vehicle segments worldwide | Medium term (2-4 years) |
| Regulatory Uncertainty on New Road-worthiness Standards | -0.4% | Global, varying timelines | Long term (≥ 4 years) |
| Source: Mordor Intelligence | |||
Higher Unit Cost Versus Radial Tires
Current non-pneumatic units cost 40-60% above comparable radials owing to specialized polyurethane and composite inputs. Global output of 2.4 billion pneumatic units dwarfs current airless capacity, limiting economies of scale. Fleets in mining or parcel logistics are still buying due to downtime savings, yet mainstream passenger sales remain price sensitive, tempering the airless tires market trajectory during the medium term.
Limited High-Speed Load Certifications
Federal Motor Vehicle Safety Standard 129 and upcoming FMVSS 139 revisions require endurance at speeds of 160 km/h.[3]National Highway Traffic Safety Administration, “Federal Motor Vehicle Safety Standards; New Tires for Motor Vehicles,” federalregister.gov Airless configurations dissipate heat less effectively than air-cooled radials, challenging EV range efficiency at motorway speeds. Design optimization studies show the path forward, but certification adds cost and time, moderating long-term airless tires market penetration.
*Our forecasts treat driver/restraint impacts as directional, not additive. The impact forecasts reflect baseline growth, mix effects, and variable interactions.
Segment Analysis
By Vehicle Type: Off-Road Applications Drive Growth
Off-road vehicles posted the highest 7.12% CAGR outlook, even though passenger models retained the largest 45.68% share in 2025. The airless tires market size for off-road machinery reached a significant value as mine operators prioritized uptime. Recreational ATVs and UTVs use spoked designs offering higher radial stiffness for rough terrain, thereby widening consumer segments.
The commercial-truck niche shows steady conversion because total-cost-of-ownership models reward puncture avoidance. In Power-sports market, the makers differentiate models through maintenance-free features attractive to remote trail riders. Two-wheeler use is a niche yet growing in urban settings where e-bike fleets value reliability. Overall, diverse vehicle classes collectively expand the airless tires market beyond its initial industrial anchor points.


By Material: Composite Elastomers Emerge as Growth Leader
Rubber held a 64.74% share in 2025, reflecting legacy supply chains and cost advantages, whereas composite elastomers are projected to register the fastest 5.89% CAGR. Incorporation of bio-sourced feedstocks advances circularity pledges; Michelin targets 40% renewable and recyclable content by 2030. Polyurethane-based elastomers offer superior crack resistance for spoke assemblies, enhancing durability across the airless tires market.
Rubber remains cost-effective for high-volume runs, yet environmental levies favor composites. Plastic formulations serve specialist chemical-resistant niches such as airport GSE. The materials evolution underscores how sustainability mandates are reshaping supplier strategies and reinforce premium positioning within the airless tires market.
By Manufacturing Technology: Layered Honeycomb Gains Momentum
3-D printed lattice designs led with a 42.10% share in 2025, but layered honeycomb structures are forecast to expand at a 5.52% CAGR through 2031. Finite-element studies confirm that honeycomb cells mirror pneumatic ride characteristics more closely, aiding wider acceptance. Parametric tuning lets engineers optimize weight and stress without complex tooling, aligning with mass-production economics important for the airless tires market size ambitions.
Lattice printing continues to dominate prototyping thanks to rapid iteration and design freedom, bolstered by Michelin’s patent-guarded Vision concept. Molded spoke webs leverage existing production assets, supporting volume scale-up in cost-sensitive segments. Collectively, evolving process choices diversify supply options and strengthen resilience across the airless tires market.
By Sales Channel: Aftermarket Momentum Builds
OEM fitments held a 59.05% share in 2025 as automakers pursued integrated engineering packages. The aftermarket now climbs 6.42% CAGR on rising consumer awareness and fleet retrofits. Goodyear’s subscription model bundles maintenance and telematics, illustrating new paths to monetize the airless tires market adoption.OEM endorsements remain vital brand validators; Tesla’s trials attract spotlight and channel confidence. As mileage accrual proves durability, replacement cycles will intensify aftermarket pull, further broadening the airless tires market across geographies and vehicle categories.
Geography Analysis
Asia-Pacific combined the largest 38.20% slice with the fastest 7.88% CAGR. Government EV incentives, a dense OEM base, and domestic innovators such as Hankook’s iFlex program power regional momentum. China’s 34 of the top 75 global tire companies deliver scale and cost advantages, propelling the airless tires market in local and export channels.
North America benefits from defense contracts and advanced R&D ecosystems. American Engineering Group’s zero-pressure work and Tesla–Michelin pilots demonstrate cross-sector validation. Producer-responsibility regulations in several states support recyclable designs, underpinning long-term growth of the airless tires market despite higher upfront costs.
Europe orchestrates stringent emission and landfill rules. Euro 7 tyre abrasion caps and extended-producer-responsibility frameworks align with airless recyclability attributes. Michelin leverages continental policy trends through Vision-aligned production, helping the regional airless tires market meet climate commitments while safeguarding performance.

Competitive Landscape
The airless tires market exhibits moderate concentration with established tire manufacturers leveraging decades of materials-science expertise and manufacturing capacity to overcome the technical challenges inherent in non-pneumatic designs. Market leaders, including Michelin, Bridgestone, Goodyear, and Continental, pursue differentiated strategies: Michelin focuses on sustainable materials integration through its Vision concept protected by 19 patents, while Bridgestone emphasizes mining applications via its USD 25 billion Kitakyushu Plant investment targeting off-the-road tire capabilities.
Collaborative development dominates strategy. Tesla’s discussions with Michelin for Uptis testing exemplify OEM-supplier partnerships that validate technology and shorten commercialization timelines. Similar alliances, such as DHL–Michelin pilots and Bridgestone’s Smart On-Site mining bundles, demonstrate how shared risk and combined expertise accelerate uptake across various end-use sectors.
Specialist entrants, including Tannus and SMART Tire Company, occupy niche segments, infusing competitive pressure through innovative designs for cycling, aerospace, and small-vehicle markets. Yet incumbents retain advantages in global distribution, regulatory engagement and capital expenditure, enabling them to scale production and defend share as the airless tires industry matures.
Airless Tires Industry Leaders
Continental AG
Bridgestone Corporation
Michelin Group
Goodyear Tire & Rubber Co.
Hankook Tire & Technology Group
- *Disclaimer: Major Players sorted in no particular order

Recent Industry Developments
- January 2025: Supreme Dutch released a next-generation airless bicycle tire aimed at bike-sharing and cargo-bike fleets.
- November 2024: Galileo Wheel launched the flexible SkidCup airless model for skid-steer loaders.
- June 2024: Tesla opened talks with Michelin to pilot Uptis on production vehicles.
- March 2024: Bridgestone confirmed commercial development of its AirFree tire within the 2024-2026 Mid-Term Business Plan.


Research Methodology Framework and Report Scope
Market Definitions and Key Coverage
Our study defines the airless tire market as all newly manufactured solid or lattice-structured tires, sometimes called non-pneumatic tires, that carry vehicle load without internal air pressure and are supplied to passenger cars, commercial trucks, off-road equipment, and defense vehicles worldwide.
Scope Exclusion: Retreaded, foam-filled, or clamp-on aftermarket inserts that merely reinforce conventional pneumatic casings are not counted.
Segmentation Overview
- By Vehicle Type
- Passenger Vehicles
- Commercial Vehicles
- Off-Road Vehicles
- Two-Wheeler
- Power Sports (ATV/UTV, Snowmobile)
- By Material
- Rubber
- Plastic
- Composite Elastomers
- By Manufacturing Technology
- 3-D Printed Lattice
- Molded Spoke Web
- Layered Honeycomb
- By Sales Channel
- OEM
- Aftermarket
- By Geography
- North America
- United States
- Canada
- Rest of North America
- South America
- Brazil
- Argentina
- Rest of South America
- Europe
- Germany
- United Kingdom
- France
- Spain
- Italy
- Russia
- Rest of Europe
- Asia-Pacific
- China
- Japan
- India
- South Korea
- Australia
- New Zealand
- Rest of Asia-Pacific
- Middle East and Africa
- Saudi Arabia
- United Arab Emirates
- Egypt
- Turkey
- South Africa
- Rest of Middle East and Africa
- North America
Detailed Research Methodology and Data Validation
Primary Research
Mordor analysts interviewed tire engineers, fleet maintenance heads, mining contractors, and regional distributors across North America, Europe, Asia Pacific, and the Middle East. These conversations tested adoption rates, average selling prices, and service-life assumptions, which were then reconciled with secondary findings.
Desk Research
We start by gathering supply, trade, and usage clues from public sources such as the International Rubber Study Group, the United States Bureau of Transportation Statistics, Eurostat Comext customs data, and vehicle parc records from the Japan Automobile Manufacturers Association. Company 10-Ks, patent filings harvested through Questel, and global news retrieved via Dow Jones Factiva help our analysts map technology pipelines and upcoming capacity changes.
Industry white papers from groups like SAE International, safety recall databases at NHTSA, and procurement notices from ministries of defense add context on performance standards and niche military demand. This list is illustrative; many additional sources were checked to validate and clarify figures.
Market-Sizing & Forecasting
A top-down and bottom-up blend is applied. We first rebuild the global demand pool from production and trade data for solid and lattice assemblies, adjust for OEM fitment rates by vehicle class, and translate volumes into value using weighted ASPs gathered during interviews. Supplier roll-ups and sampled channel checks serve as bottom-up sense tests. Key variables in the model include off-road equipment population, passenger EV production, military vehicle procurement budgets, average duty-cycle mileage, raw rubber price trends, and certified load-speed ratings. Scenario-based multivariate regression projects these drivers to 2030 and flags inflection points such as EV penetration or regulatory shifts. Where supplier counts are sparse, confidence intervals widen and are later tightened through fresh calls.
Data Validation & Update Cycle
Outputs move through variance checks against historical recall data, import tallies, and publicly disclosed pilot programs. Senior reviewers challenge anomalies before sign-off. Reports refresh once each year, with interim revisions triggered by material events, ensuring clients always receive an up-to-date baseline.
Why Mordor's Airless Tires Baseline Stands Firm
Published numbers often diverge because firms vary scope, conversion factors, and refresh cadence. Our disciplined definitions and yearly updates reduce those gaps.
Key gap drivers include some publishers bundling pneumatic run-flat kits with airless units, others converting regional sales to dollars using static exchange rates, and still others extrapolating prototype announcements into immediate volume without OEM confirmation.
Benchmark comparison
| Market Size | Anonymized source | Primary gap driver |
|---|---|---|
| USD 14.74 B (2025) | Mordor Intelligence | - |
| USD 63.16 B (2025) | Global Consultancy A | Includes conventional run-flat and foam-filled products, applies constant 5% EV surcharge to ASPs |
| USD 68.19 M (2024) | Regional Consultancy B | Counts only aftermarket low-speed utility vehicles, omits OEM fitments |
| USD 1.21 B (2024) | Trade Journal C | Uses shipment announcements rather than delivered units, single-year currency conversion |
These comparisons show that Mordor's carefully bounded scope, multi-source triangulation, and annual refresh deliver a balanced, transparent baseline that decision-makers can rely on.


Key Questions Answered in the Report
What is the current value of the airless tires market?
The airless tires market stands at USD 15.34 billion in 2026 and is projected to reach USD 18.71 billion by 2031.
Which region leads the airless tires market growth?
Asia Pacific holds the largest 38.20% share and is expanding at the fastest 7.88% CAGR, supported by strong EV policies and manufacturing scale.
Why are airless tires attractive for electric vehicles?
They remove puncture risk, handle higher battery loads, and align with sustainability goals, factors now being validated through Tesla–Michelin Uptis pilots.
Which manufacturing technology shows the fastest growth?
Layered honeycomb structures are forecast to grow 5.52% annually as they deliver pneumatic-like ride comfort with scalable production economics.
Page last updated on:


