Market Overview
| Study Period | 2020 - 2031 |
|---|---|
| Forecast Data Period | 2026 - 2031 |
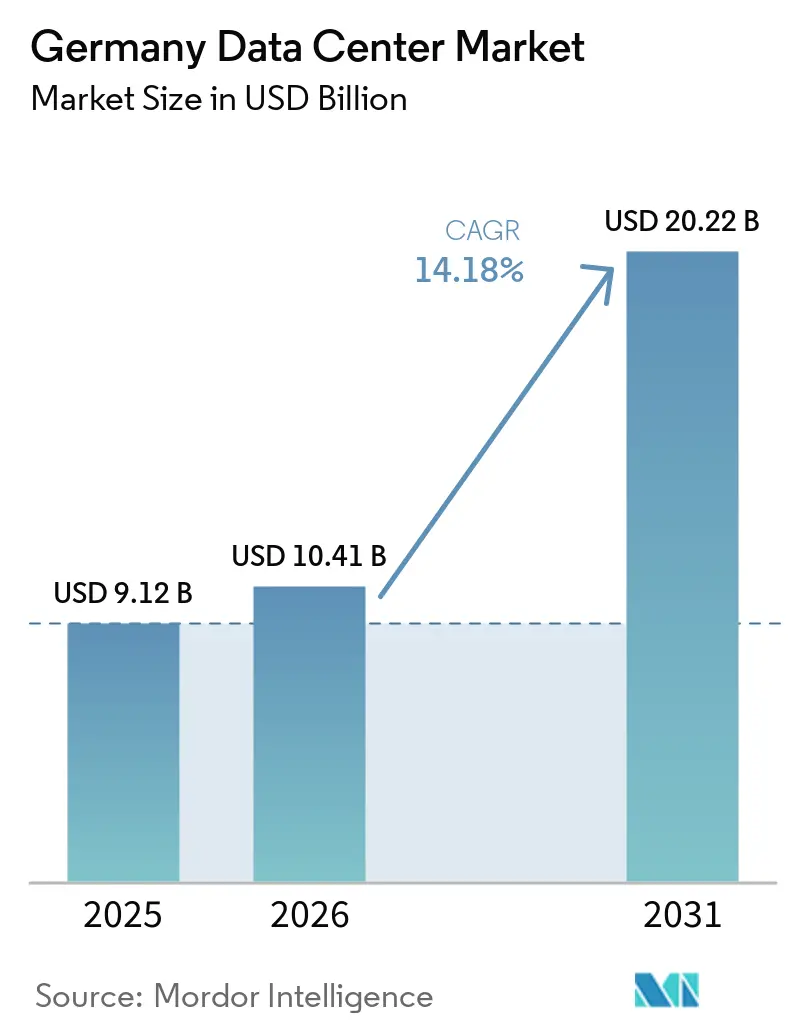
| Base Year Market Size (2025) | USD 9.12 Billion |
| Market Size (2026) | USD 10.41 Billion |
| Market Size (2031) | USD 20.22 Billion |
| Growth Rate (2026 - 2031) | 14.18% CAGR |
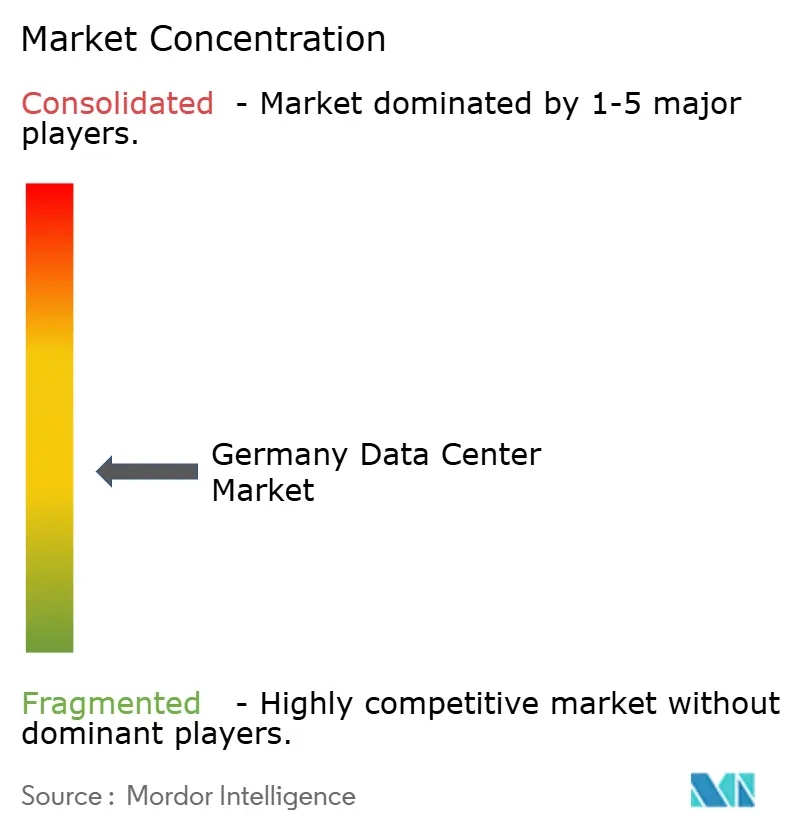
| Market Concentration | Medium |
Major Players *Disclaimer: Major Players sorted in no particular order Image © Mordor Intelligence. Reuse requires attribution under CC BY 4.0. | |
Germany Data Center Market Analysis by Mordor Intelligence
Germany Data Center market size in 2026 is estimated at USD 10.41 billion, growing from 2025 value of USD 9.12 billion with 2031 projections showing USD 20.22 billion, growing at 14.18% CAGR over 2026-2031. In terms of IT load capacity, the market is expected to grow from 3.44 thousand megawatts in 2025 to 6.23 thousand megawatts by 2030, at a CAGR of 12.60% during the forecast period (2025-2030). The market segment shares and estimates are calculated and reported in terms of MW. Growth is driven by the surge in artificial intelligence (AI) workloads, sustained hyperscaler capital expenditures, and regulatory requirements that favor modern, high-density facilities. The market already ranks as Europe’s second-largest hub; hyperscaler pre-leasing in Frankfurt is absorbing new capacity faster than it can be delivered, while 5G-enabled edge deployments diversify demand beyond the main metro. Rising rack densities and the adoption of liquid cooling are narrowing the performance gap between cloud and on-premise environments, encouraging enterprises to abandon legacy server rooms. Finally, government incentives for sovereign AI infrastructure and waste-heat reuse create incremental revenue streams that strengthen the investment case for new projects.
Key Report Takeaways
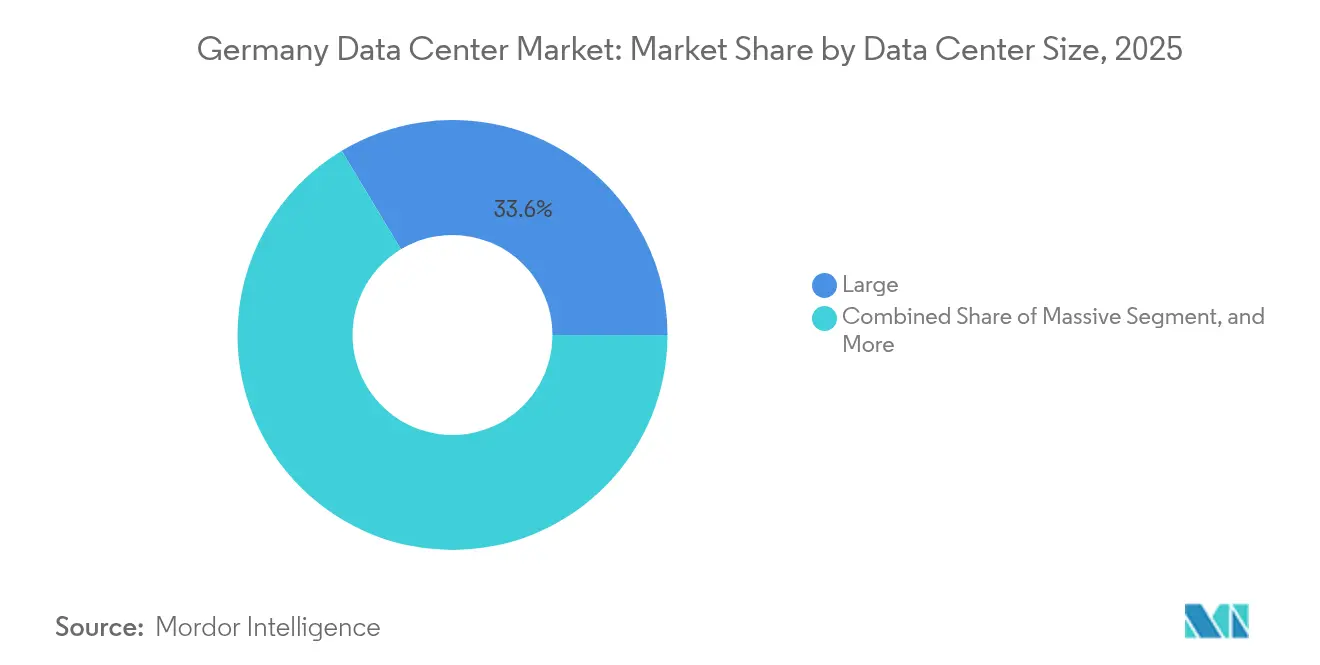
- By data-center size, large facilities held 33.62% of the Germany data center market share in 2025; edge sites are forecast to expand at a 12.97% CAGR through 2031.
- By tier type, Tier 3 dominated with a 59.25% revenue share in 2025, while Tier 4 is projected to show the highest CAGR of 13.62% from 2025 to 2031.
- By data-center type, colocation providers commanded 81.12% of the Germany data center market size in 2025; enterprise and edge deployments are advancing at 12.95% CAGR.
- By end user, IT and telecom captured 55.21% share of the Germany data center market size in 2025, whereas BFSI workloads are accelerating at 12.76% CAGR through 2031.
- By hotspot, Frankfurt accounted for 59.10% of the Germany data center market share in 2025; the Rest of Germany region is expanding at a 13.71% CAGR to 2031.
Note: Market size and forecast figures in this report are generated using Mordor Intelligence’s proprietary estimation framework, updated with the latest available data and insights as of 2026.
Germany Data Center Market Trends and Insights
Drivers Impact Analysis*
| Driver | (~) % Impact on CAGR Forecast | Geographic Relevance | Impact Timeline |
|---|---|---|---|
| AI, Cloud and 5G-Driven Workload Surge | +3.2% | National, led by Frankfurt and Berlin | Short term (≤ 2 years) |
| Hyperscaler Expansion Commitments to Frankfurt | +2.8% | Frankfurt Metro, spillover to Rhineland | Medium term (2-4 years) |
| Strong Fiber and Submarine Connectivity via DE-CIX | +1.9% | Frankfurt core, Hamburg secondary | Long term (≥ 4 years) |
| Corporate Digital Transformation and GDPR-Driven Colocation Demand | +2.1% | Major metros nationwide | Medium term (2-4 years) |
| Government-Backed AI Gigafactory Initiatives | +1.7% | Nationwide secondary markets | Long term (≥ 4 years) |
| Waste-Heat Utilization Mandates | +0.9% | Urban centers with district-heat grids | Long term (≥ 4 years) |
| Source: Mordor Intelligence | |||
AI, Cloud and 5G-Driven Workload Surge
Ramp-up of GPU-powered inference and training is pushing rack densities to 30-100 kW, a five-fold leap from traditional enterprise footprints. Microsoft’s EUR 3.2 billion program to double national AI capacity by 2026 highlights the scale shift, while Deutsche Telekom targets 10,000 edge nodes by 2030 to support 5G low-latency use cases. Average hyperscale utilization in Frankfurt now exceeds 85%, tightening available supply and pushing new entrants toward secondary sites. Liquid-cooling adoption is gaining momentum as air systems can no longer evacuate the thermal load of dense GPU clusters. These technical realities collectively amplify power and floor-space demand, directly lifting revenue opportunities for operators adhering to the Germany data center market’s stringent efficiency codes.
Hyperscaler Expansion Commitments to Frankfurt
Amazon Web Services’ USD 9.44 billion pledge through 2040 represents the largest single private-sector infrastructure investment in Germany to date, cementing Frankfurt as the country’s AI nucleus. Such scale attracts enterprise tenants who value latency adjacency to cloud on-ramps, but the same clustering inflates land prices and exacerbates grid bottlenecks. Operators now model multi-phase builds with interim diesel-generator bridging while waiting for final high-voltage feeds. Although risk is concentrated, near-term revenue visibility improves because anchor tenants typically lock in 10- to 15-year power contracts.
Strong Fiber and Submarine Connectivity via DE-CIX
DE-CIX Frankfurt processes more than 17 Tbps of peak traffic, giving colocated data centers privileged access to over 1,000 carrier networks. The IOEMA subsea cable landing at Wilhelmshaven in 2027 will add 1.3 Pbps capacity and diversify inbound routes for northern Germany, potentially diluting Frankfurt’s monopoly over time. [1]Network Development Plan, “Electricity Scenario Framework 2037-2045,” netzentwicklungsplan.de Multiple redundant backbones lower latency for algorithmic trading and cloud replication, reinforcing the Germany data center market’s appeal to performance-sensitive verticals.
Corporate Digital Transformation and GDPR-Driven Colocation Demand
Section 393 of the Social Code, effective since July 2024, obliges healthcare data to reside within the European Economic Area. Enterprises already juggling GDPR compliance now face even stricter residency mandates, prompting accelerated migration to professionally audited colocation halls that maintain German soil processing. Certifications such as BSI C5 become differentiators, enabling providers to charge premium rates while simultaneously improving national cyber-resilience.[2]BMWK, “Ein Stromnetz für die Energiewende,” bmwk.de
Restraints Impact Analysis*
| Restraint | (~) % Impact on CAGR Forecast | Geographic Relevance | Impact Timeline |
|---|---|---|---|
| Grid Connection Constraints in Frankfurt | -2.1% | Frankfurt Metro, Rhine-Main | Short term (≤ 2 years) |
| High Electricity Costs vs. EU Peers | -1.8% | National, heavier in industrial southwest | Medium term (2-4 years) |
| EnEfG Compliance Costs | -1.3% | Nationwide, facilities >300 kW | Long term (≥ 4 years) |
| Skilled Labor Shortage for Liquid-Cooling | -0.9% | National AI-focused builds | Medium term (2-4 years) |
| Source: Mordor Intelligence | |||
Grid Connection Constraints in Frankfurt Metro
Bundesnetzagentur now allocates new high-capacity feeds via a queueing mechanism as local substations approach saturation. Developers report 18-24-month delays for ≥50 MW connections, forcing staged commissioning or relocation to nearby Rhineland plots. A EUR 750 million reinforcement program will ease pressure, but full impact is unlikely before 2033. [3]Bundesnetzagentur, “Environmental Report on Grid Expansion,” bundesnetzagentur.de Consequently, some projects pre-purchase battery storage to self-sustain critical loads during ramp-up, inflating capital budgets and complicating financing.
High Electricity Costs Relative to EU Peers
Industrial tariffs average EUR 0.15-0.20 per kWh, compared with EUR 0.10-0.12 in France. The national CO₂ levy rose to EUR 55 per allowance in 2025 and will move to an auction band in 2026, reinforcing the cost gap. Operators counter rising bills by signing long-term renewable PPAs or investing in on-site solar and heat-pump recovery. Yet margin erosion persists, especially for GPU-dense halls whose power draw is steadily climbing. Price-sensitive workloads may drift to Nordic markets, tempering upside for the Germany data center industry.
*Our forecasts treat driver/restraint impacts as directional, not additive. The impact forecasts reflect baseline growth, mix effects, and variable interactions.
Segment Analysis
By Data Center Size: Edge Computing Drives Diversification
Large halls retained 33.62% of the Germany data center market share in 2025 thanks to hyperscaler economies of scale. Yet edge sites, while smaller, are on track for 12.97% CAGR as 5G adoption accelerates localized processing. The Germany data center market size allocated to edge remains modest today, but operators such as Deutsche Telekom plan 10,000 nodes by 2030, a roadmap that will multiply regional PoP counts. Edge units frequently occupy refurbished telecom exchanges, lowering land costs and shortening permitting cycles. Liquid-cooling retrofits are becoming standard even at micro sites because AI inferences require high-density racks similar to core campuses.
Medium facilities often 5-25 MW provide a bridging option for enterprises that outgrow on-premise rooms but are not yet ready for hyperscale footprints. In Frankfurt, mega campuses exceeding 100 MW continue to break ground, though grid scarcity forces phased energization. The Germany data center market thus combines massive centralized developments with a proliferating edge rim, bringing compute closer to users without sacrificing cloud interconnectivity.


By Tier Type: Mission-Critical Drives Premium Demand
Tier 3 halls comprised 59.25% of installed power in 2025, reflecting enterprises’ preference for concurrent maintainability at a manageable price point. The Germany data center market size allocated to Tier 4 grows the fastest, 13.62% CAGR, because BFSI and AI training cannot tolerate downtime during long model-run cycles. Financial firms in Frankfurt routinely specify fault-tolerant designs delivering ≥99.995% availability. Edge locations tend toward Tier 2 equivalents but increasingly add N+1 liquid-cooling loops, effectively moving up the resilience ladder.
Hyperscalers finance Tier 4 builds where workloads justify premium uptime, while auto-scaling consumer cloud instances remain content with Tier 3. Certification to the EN 50600-3 standard is now a baseline across all new German builds. Over time, hybrid architectures will mesh Tier 4 cores with resilient edge outposts, giving the Germany data center market a multi-tier topology aligned to workload criticality.
By Data Center Type: Colocation Dominance Faces Edge Disruption
Colocation operators managed 81.12% of deployed megawatts in 2025, proof of persistent outsourcing demand. Retail colocation racks serve SMEs needing incremental expansion, while wholesale suites host cloud nodes and digital-native platforms. The Germany data center market continues liberalizing as new greenfield campuses blend colocation and build-to-suit shells.
Enterprise and edge self-builds, though still niche, are scaling at 12.95% CAGR. BFSI firms pursuing data sovereignty or ultra-low latency often commission private suites inside multitenant shells to balance control with connectivity. Meanwhile, specialized GPU hosting providers carve out a premium sub-segment, bundling infrastructure with managed AI services. Overhang capacity, mainly in secondary cities where speculative builds outpaced demand, is slowly contracting as operators convert unused halls into modular edge arrays.

By End User: BFSI Leads Digital Transformation
IT and telecom remained the anchor, representing 55.21% of the Germany data center market size in 2025. Growth has moderated as cloud foundations are already in place, but network-function virtualization and 5G slicing still generate incremental load. Banking, financial services and insurance workloads will expand fastest at 12.76% CAGR as algorithmic trading and real-time risk analytics require GPU acceleration.
Public administration digitization, championed by the 2025 Digital Ministry, pushes sensitive workloads to on-shore clouds. Manufacturing adopters leverage industrial IoT analytics that need both factory-edge nodes and central AI training clusters. Media and entertainment firms consume burst GPU capacity for rendering, while autonomous-vehicle developers ingest petabyte-scale telemetry. Together, these verticals ensure diversified demand, cushioning the Germany data center industry against single-sector downturns.
Geography Analysis
Frankfurt data centers represented 59.10% of Germany’s deployed power capacity in 2025, underscoring the city’s continued dominance within the Germany data center market. The city cluster hosts 745 MW live IT load, with 542 MW under construction and a further 383 MW in planning. Land prices surpass EUR 4,500 per m² and grid queues now exceed two years. Despite constraints, hyperscalers sign pre-leases because DE-CIX offers unmatched carrier density and sub-millisecond reach to European finance hubs. High-frequency trading desks value microsecond latency, enabling operators to charge premium cross-connect fees that offset elevated real-estate costs.
Hamburg is evolving into the secondary nexus. Current capacity of 92 MW, plus 76 MW under build and 219 MW in planning, positions the port city for triple-digit growth. Ready access to offshore wind and the forthcoming Wilhelmshaven IOEMA landing improve green-power sourcing and international reach, respectively. Local authorities promote heat-recovery schemes that feed district networks, aligning with EnEfG mandates and lowering effective PUE.
The Rest of Germany bucket, covering Rhineland, Berlin, Munich and emerging Bavarian clusters, records the fastest expansion at 13.71% CAGR. Rhineland benefits from Microsoft’s Bergheim-Bedburg campus, leveraging surplus lignite-grid capacity being repurposed for digital loads. Berlin’s trajectory suffered a setback when Google shelved a planned build in 2025, yet public-sector cloud adoption and a vibrant startup scene still underpin long-term requirements. Munich attracts Apple and OpenAI R&D teams, but limited metro fiber and strict zoning slow new builds. Overall, geographic dispersion is rising as operators seek cheaper land, renewable energy proximity and shorter permitting cycles, broadening the footprint of the Germany data center market.
Competitive Landscape
Frankfurt commanded 59.92% of deployed megawatts in 2024 and remains the gravitational center of the Germany data center market. The city cluster hosts 745 MW live IT load, with 542 MW under construction and a further 383 MW in planning. Land prices surpass EUR 4,500 per m² and grid queues now exceed two years. Despite constraints, hyperscalers sign pre-leases because DE-CIX offers unmatched carrier density and sub-millisecond reach to European finance hubs. High-frequency trading desks value microsecond latency, enabling operators to charge premium cross-connect fees that offset elevated real-estate costs.
Hamburg is evolving into the secondary nexus. Current capacity of 92 MW, plus 76 MW under build and 219 MW in planning, positions the port city for triple-digit growth. Ready access to offshore wind and the forthcoming Wilhelmshaven IOEMA landing improve green-power sourcing and international reach, respectively. Local authorities promote heat-recovery schemes that feed district networks, aligning with EnEfG mandates and lowering effective PUE.
The Rest of Germany bucket, covering Rhineland, Berlin, Munich, and emerging Bavarian clusters, records the fastest expansion at 14.1% CAGR. Rhineland benefits from Microsoft’s Bergheim-Bedburg campus, leveraging surplus lignite-grid capacity being repurposed for digital loads. Berlin’s trajectory suffered a setback when Google shelved a planned build in 2025, yet public-sector cloud adoption and a vibrant startup scene still underpin long-term requirements. Munich attracts Apple and OpenAI R&D teams, but limited metro fiber and strict zoning slow new builds. Overall, geographic dispersion is rising as operators seek cheaper land, renewable energy proximity and shorter permitting cycles, broadening the footprint of the Germany data center market.
Germany Data Center Industry Leaders
CyrusOne Inc.
Digital Realty Trust Inc.
Equinix Inc.
NTT Corporation
Iron Mountain Inc.
- *Disclaimer: Major Players sorted in no particular order

Recent Industry Developments
- July 2025: Google canceled its planned Berlin facility, underscoring secondary-market challenges.
- June 2025: Northern Data Group reported H1 revenue of EUR 94.3 million, up 72% year-on-year.
- May 2025: Equinix opened Frankfurt 10 at full pre-lease and green-lit further expansion.
- February 2025: Green Mountain and KMW topped out their sustainable hall near Frankfurt.


Germany Data Center Market Report Scope
Frankfurt are covered as segments by Hotspot. Large, Massive, Medium, Mega, Small are covered as segments by Data Center Size. Tier 1 and 2, Tier 3, Tier 4 are covered as segments by Tier Type. Non-Utilized, Utilized are covered as segments by Absorption.By Data Center Size
| Large |
| Massive |
| Medium |
| Mega |
| Small |
By Tier Type
| Tier 1 and 2 |
| Tier 3 |
| Tier 4 |
By Data Center Type
| Hyperscale / Self-built | ||
| Enterprise / Edge | ||
| Colocation | Non-Utilized | |
| Utilized | Retail Colocation | |
| Wholesale Colocation | ||
By End User
| BFSI |
| IT and ITES |
| E-Commerce |
| Government |
| Manufacturing |
| Media and Entertainment |
| Telecom |
| Other End Users |
By Hotspot
| Frankfurt |
| Hamburg |
| Rest of Germany |
| By Data Center Size | Large | ||
| Massive | |||
| Medium | |||
| Mega | |||
| Small | |||
| By Tier Type | Tier 1 and 2 | ||
| Tier 3 | |||
| Tier 4 | |||
| By Data Center Type | Hyperscale / Self-built | ||
| Enterprise / Edge | |||
| Colocation | Non-Utilized | ||
| Utilized | Retail Colocation | ||
| Wholesale Colocation | |||
| By End User | BFSI | ||
| IT and ITES | |||
| E-Commerce | |||
| Government | |||
| Manufacturing | |||
| Media and Entertainment | |||
| Telecom | |||
| Other End Users | |||
| By Hotspot | Frankfurt | ||
| Hamburg | |||
| Rest of Germany | |||


Market Definition
- IT LOAD CAPACITY - The IT load capacity or installed capacity, refers to the amount of energy consumed by servers and network equipments placed in a rack installed. It is measured in megawatt (MW).
- ABSORPTION RATE - It denotes the extend to which the data center capacity has been leased out. For instance, a 100 MW DC has leased out 75 MW, then absorption rate would be 75%. It is also referred as utilization rate and leased-out capacity.
- RAISED FLOOR SPACE - It is an elevated space build over the floor. This gap between the original floor and the elevated floor is used to accommodate wiring, cooling, and other data center equipment. This arrangement assist in having proper wiring and cooling infrastructure. It is measured in square feet (ft^2).
- DATA CENTER SIZE - Data Center Size is segmented based on the raised floor space allocated to the data center facilities. Mega DC - # of Racks must be more than 9000 or RFS (raised floor space) must be more than 225001 Sq. ft; Massive DC - # of Racks must be in between 9000 and 3001 or RFS must be in between 225000 Sq. ft and 75001 Sq. ft; Large DC - # of Racks must be in between 3000 and 801 or RFS must be in between 75000 Sq. ft and 20001 Sq. ft; Medium DC # of Racks must be in between 800 and 201 or RFS must be in between 20000 Sq. ft and 5001 Sq. ft; Small DC - # of Racks must be less than 200 or RFS must be less than 5000 Sq. ft.
- TIER TYPE - According to Uptime Institute the data centers are classified into four tiers based on the proficiencies of redundant equipment of the data center infrastructure. In this segment the data center are segmented as Tier 1,Tier 2, Tier 3 and Tier 4.
- COLOCATION TYPE - The segment is segregated into 3 categories namely Retail, Wholesale and Hyperscale Colocation service. The categorization is done based on the amount of IT load leased out to potential customers. Retail colocation service has leased capacity less than 250 kW; Wholesale colocation services has leased capacity between 251 kW and 4 MW and Hyperscale colocation services has leased capacity more than 4 MW.
- END CONSUMERS - The Data Center Market operates on a B2B basis. BFSI, Government, Cloud Operators, Media and Entertainment, E-Commerce, Telecom and Manufacturing are the major end-consumers in the market studied. The scope only includes colocation service operators catering to the increasing digitalization of the end-user industries.
| Keyword | Definition |
|---|---|
| Rack Unit | Generally referred as U or RU, it is the unit of measurement for the server unit housed in the racks in the data center. 1U is equal to 1.75 inches. |
| Rack Density | It defines the amount of power consumed by the equipment and server housed in a rack. It is measured in kilowatt (kW). This factor plays a critical role in data center design and, cooling and power planning. |
| IT Load Capacity | The IT load capacity or installed capacity, refers to the amount of energy consumed by servers and network equipment placed in a rack installed. It is measured in megawatt (MW). |
| Absorption Rate | It denotes how much of the data center capacity has been leased out. For instance, if a 100 MW DC has leased out 75 MW, then the absorption rate would be 75%. It is also referred to as utilization rate and leased-out capacity. |
| Raised Floor Space | It is an elevated space built over the floor. This gap between the original floor and the elevated floor is used to accommodate wiring, cooling, and other data center equipment. This arrangement assists in having proper wiring and cooling infrastructure. It is measured in square feet/meter. |
| Computer Room Air Conditioner (CRAC) | It is a device used to monitor and maintain the temperature, air circulation, and humidity inside the server room in the data center. |
| Aisle | It is the open space between the rows of racks. This open space is critical for maintaining the optimal temperature (20-25 °C) in the server room. There are primarily two aisles inside the server room, a hot aisle and a cold aisle. |
| Cold Aisle | It is the aisle wherein the front of the rack faces the aisle. Here, chilled air is directed into the aisle so that it can enter the front of the racks and maintain the temperature. |
| Hot Aisle | It is the aisle where the back of the racks faces the aisle. Here, the heat dissipated from the equipment’s in the rack is directed to the outlet vent of the CRAC. |
| Critical Load | It includes the servers and other computer equipment whose uptime is critical for data center operation. |
| Power Usage Effectiveness (PUE) | It is a metric which defines the efficiency of a data center. It is calculated by: (𝑇𝑜𝑡𝑎𝑙 𝐷𝑎𝑡𝑎 𝐶𝑒𝑛𝑡𝑒𝑟 𝐸𝑛𝑒𝑟𝑔𝑦 𝐶𝑜𝑛𝑠𝑢𝑚𝑝𝑡𝑖𝑜𝑛)/(𝑇𝑜𝑡𝑎𝑙 𝐼𝑇 𝐸𝑞𝑢𝑖𝑝𝑚𝑒𝑛𝑡 𝐸𝑛𝑒𝑟𝑔𝑦 𝐶𝑜𝑛𝑠𝑢𝑚𝑝𝑡𝑖𝑜𝑛). Further, a data center with a PUE of 1.2-1.5 is considered highly efficient, whereas, a data center with a PUE >2 is considered highly inefficient. |
| Redundancy | It is defined as a system design wherein additional component (UPS, generators, CRAC) is added so that in case of power outage, equipment failure, the IT equipment should not be affected. |
| Uninterruptible Power Supply (UPS) | It is a device that is connected in series with the utility power supply, storing energy in batteries such that the supply from UPS is continuous to IT equipment even during utility power is snapped. The UPS primarily supports the IT equipment only. |
| Generators | Just like UPS, generators are placed in the data center to ensure an uninterrupted power supply, avoiding downtime. Data center facilities have diesel generators and commonly, 48-hour diesel is stored in the facility to prevent disruption. |
| N | It denotes the tools and equipment required for a data center to function at full load. Only "N" indicates that there is no backup to the equipment in the event of any failure. |
| N+1 | Referred to as 'Need plus one', it denotes the additional equipment setup available to avoid downtime in case of failure. A data center is considered N+1 when there is one additional unit for every 4 components. For instance, if a data center has 4 UPS systems, then for to achieve N+1, an additional UPS system would be required. |
| 2N | It refers to fully redundant design wherein two independent power distribution system is deployed. Therefore, in the event of a complete failure of one distribution system, the other system will still supply power to the data center. |
| In-Row Cooling | It is the cooling design system installed between racks in a row where it draws warm air from the hot aisle and supplies cool air to the cold aisle, thereby maintaining the temperature. |
| Tier 1 | Tier classification determines the preparedness of a data center facility to sustain data center operation. A data center is classified as Tier 1 data center when it has a non-redundant (N) power component (UPS, generators), cooling components, and power distribution system (from utility power grids). The Tier 1 data center has an uptime of 99.67% and an annual downtime of <28.8 hours. |
| Tier 2 | A data center is classified as Tier 2 data center when it has a redundant power and cooling components (N+1) and a single non-redundant distribution system. Redundant components include extra generators, UPS, chillers, heat rejection equipment, and fuel tanks. The Tier 2 data center has an uptime of 99.74% and an annual downtime of <22 hours. |
| Tier 3 | A data center having redundant power and cooling components and multiple power distribution systems is referred to as a Tier 3 data center. The facility is resistant to planned (facility maintenance) and unplanned (power outage, cooling failure) disruption. The Tier 3 data center has an uptime of 99.98% and an annual downtime of <1.6 hours. |
| Tier 4 | It is the most tolerant type of data center. A Tier 4 data center has multiple, independent redundant power and cooling components and multiple power distribution paths. All IT equipment are dual powered, making them fault tolerant in case of any disruption, thereby ensuring interrupted operation. The Tier 4 data center has an uptime of 99.74% and an annual downtime of <26.3 minutes. |
| Small Data Center | Data center that has floor space area of ≤ 5,000 Sq. ft or the number of racks that can be installed is ≤ 200 is classified as a small data center. |
| Medium Data Center | Data center which has floor space area between 5,001-20,000 Sq. ft, or the number of racks that can be installed is between 201-800, is classified as a medium data center. |
| Large Data Center | Data center which has floor space area between 20,001-75,000 Sq. ft, or the number of racks that can be installed is between 801-3,000, is classified as a large data center. |
| Massive Data Center | Data center which has floor space area between 75,001-225,000 Sq. ft, or the number of racks that can be installed is between 3001-9,000, is classified as a massive data center. |
| Mega Data Center | Data center that has a floor space area of ≥ 225,001 Sq. ft or the number of racks that can be installed is ≥ 9001 is classified as a mega data center. |
| Retail Colocation | It refers to those customers who have a capacity requirement of 250 kW or less. These services are majorly opted by small and medium enterprises (SMEs). |
| Wholesale Colocation | It refers to those customers who have a capacity requirement between 250 kW to 4 MW. These services are majorly opted by medium to large enterprises. |
| Hyperscale Colocation | It refers to those customers who have a capacity requirement greater than 4 MW. The hyperscale demand primarily originates from large-scale cloud players, IT companies, BFSI, and OTT players (like Netflix, Hulu, and HBO+). |
| Mobile Data Speed | It is the mobile internet speed a user experiences via their smartphones. This speed is primarily dependent on the carrier technology being used in the smartphone. The carrier technologies available in the market are 2G, 3G, 4G, and 5G, where 2G provides the slowest speed while 5G is the fastest. |
| Fiber Connectivity Network | It is a network of optical fiber cables deployed across the country, connecting rural and urban regions with high-speed internet connection. It is measured in kilometer (km). |
| Data Traffic per Smartphone | It is a measure of average data consumption by a smartphone user in a month. It is measured in gigabyte (GB). |
| Broadband Data Speed | It is the internet speed that is supplied over the fixed cable connection. Commonly, copper cable and optic fiber cable are used in both residential and commercial use. Here, optic cable fiber provides faster internet speed than copper cable. |
| Submarine Cable | A submarine cable is a fiber optic cable laid down at two or more landing points. Through this cable, communication and internet connectivity between countries across the globe is established. These cables can transmit 100-200 terabits per second (Tbps) from one point to another. |
| Carbon Footprint | It is the measure of carbon dioxide generated during the regular operation of a data center. Since, coal, and oil & gas are the primary source of power generation, consumption of this power contributes to carbon emissions. Data center operators are incorporating renewable energy sources to curb the carbon footprint emerging in their facilities. |


Research Methodology
Mordor Intelligence follows a four-step methodology in all our reports.
- Step-1: Identify Key Variables: In order to build a robust forecasting methodology, the variables and factors identified in Step-1 are tested against available historical market numbers. Through an iterative process, the variables required for market forecast are set and the model is built on the basis of these variables.
- Step-2: Build a Market Model: Market-size estimations for the forecast years are in nominal terms. Inflation is not a part of the pricing, and the average selling price (ASP) is kept constant throughout the forecast period for each country.
- Step-3: Validate and Finalize: In this important step, all market numbers, variables and analyst calls are validated through an extensive network of primary research experts from the market studied. The respondents are selected across levels and functions to generate a holistic picture of the market studied.
- Step-4: Research Outputs: Syndicated Reports, Custom Consulting Assignments, Databases & Subscription Platforms


