
Financial Guarantee Market Size and Share
Market Overview
| Study Period | 2021 - 2032 |
|---|---|
| Market Size (2027) | USD 43.10 Billion |
| Market Size (2031) | USD 61.80 Billion |
| Growth Rate (2027 - 2032) | 7.50 % |
| Fastest Growing Market | Asia-Pacific |
| Largest Market | North America |
| Market Concentration | Low |
Major Players *Disclaimer: Major Players sorted in no particular order Image © Mordor Intelligence. Reuse requires attribution under CC BY 4.0. | |
Financial Guarantee Market Analysis by Mordor Intelligence
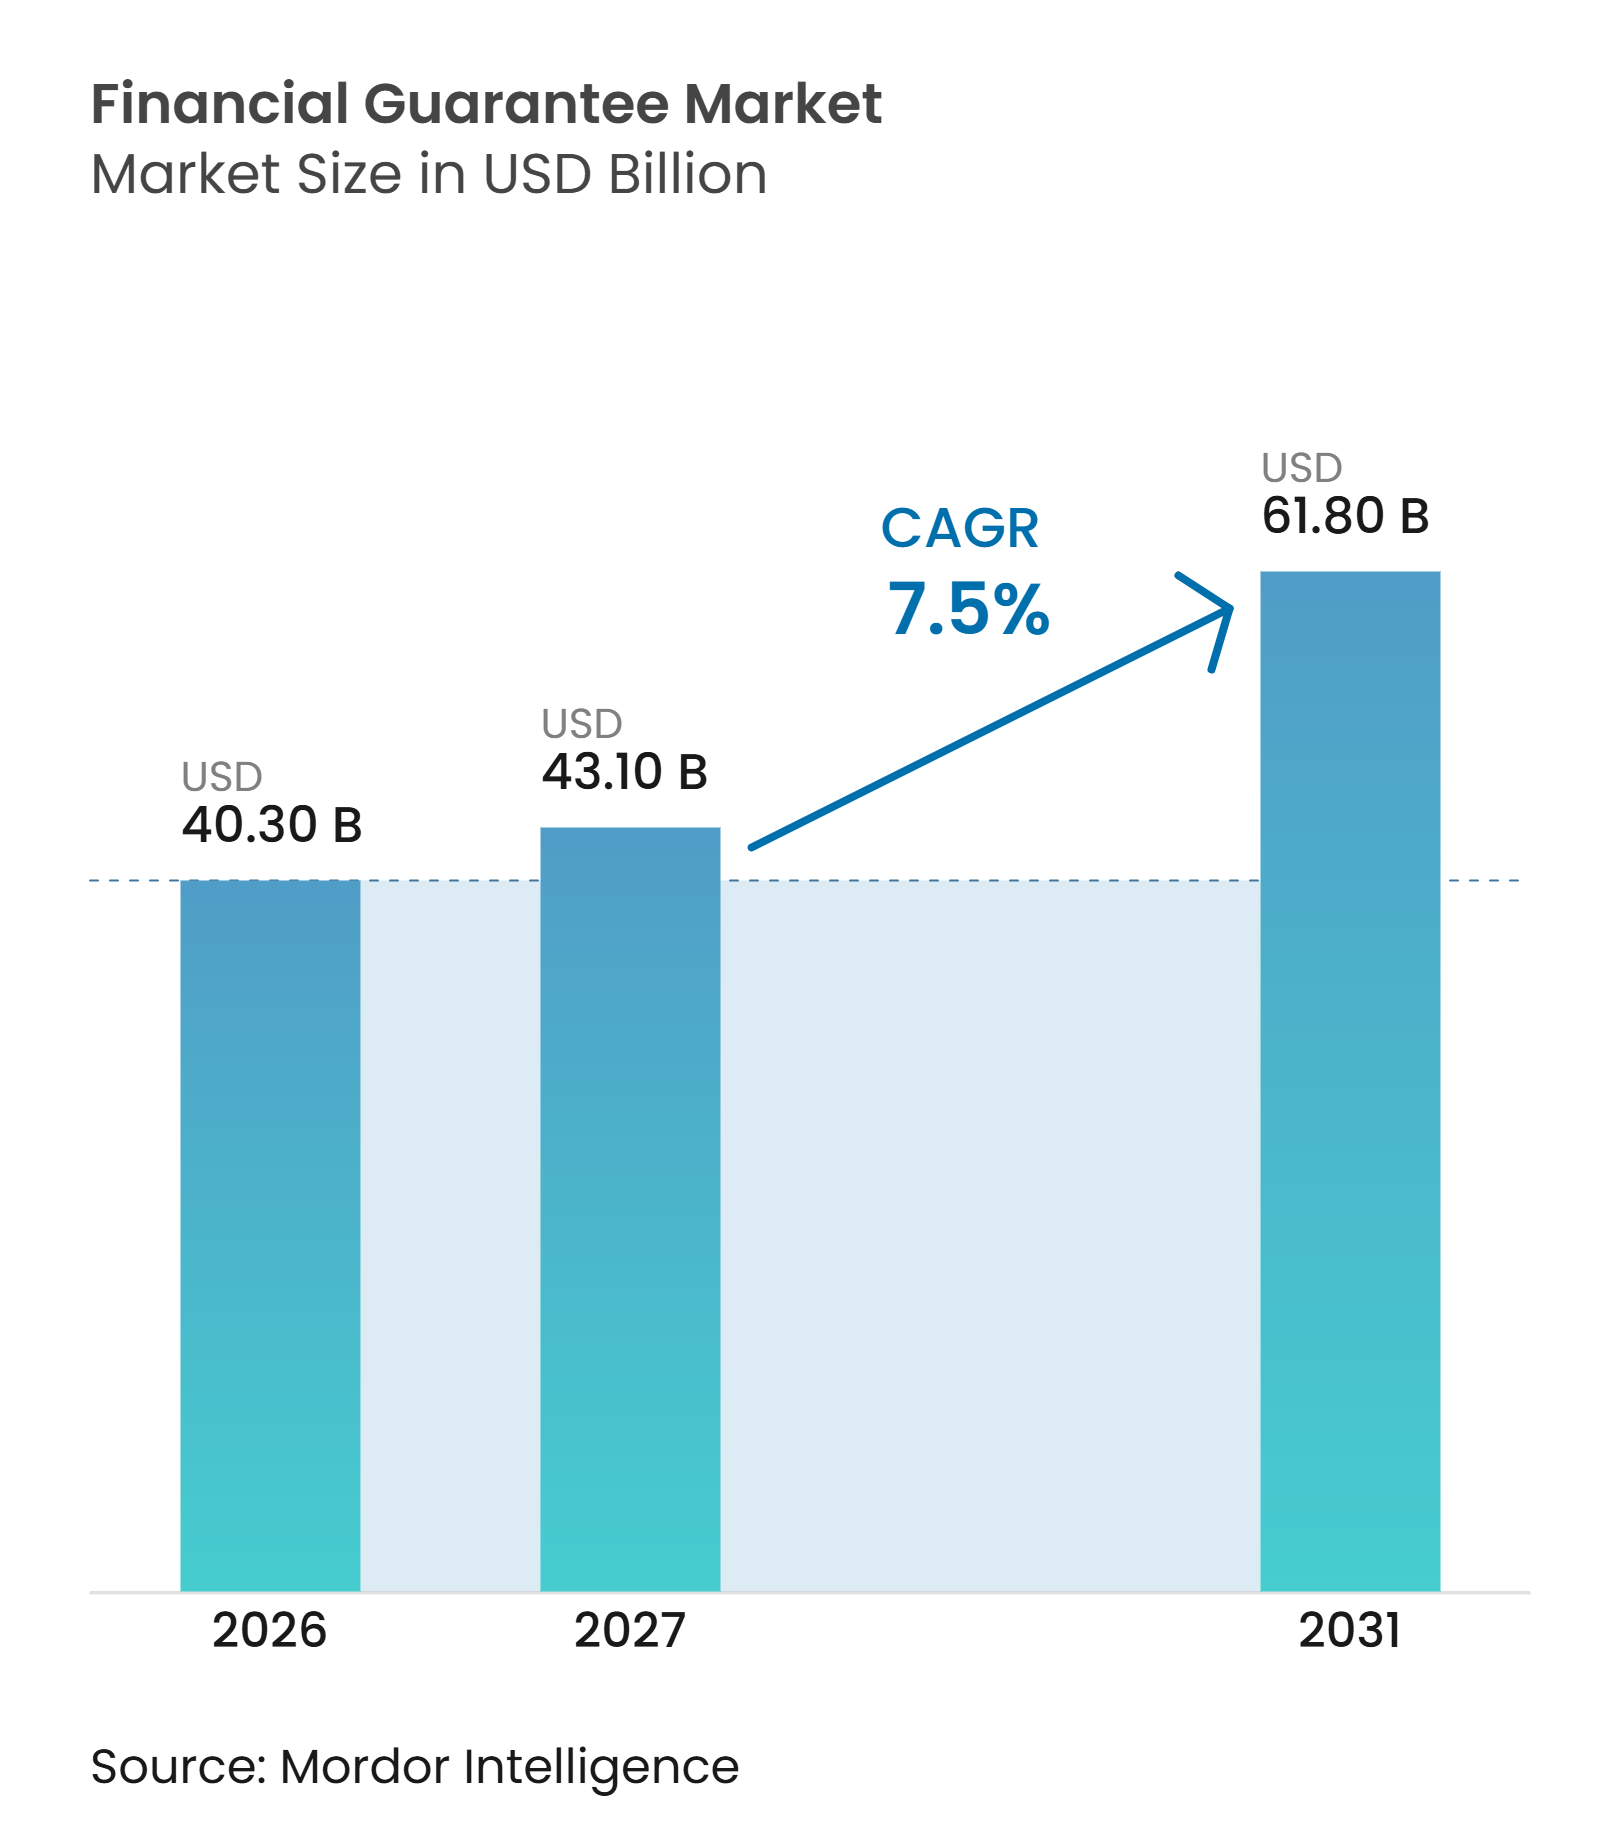
The Financial Guarantee Market size was valued at USD 40.30 billion in 2026 and is estimated to grow from USD 43.10 billion in 2027 to reach USD 61.80 billion by 2031, at a CAGR of 7.5% during the forecast period (2027-2031).
Growth reflects greater use of credit protection in trade finance, infrastructure finance, and structured credit as counterparties manage default and non-delivery exposure. World goods and services trade reached USD 34.65 trillion in 2025, up 7% from the prior year, which supports demand for reliable guarantee instruments in cross-border transactions. The USD 2.5 trillion global trade finance gap in 2025 leaves substantial financing needs outside conventional bank lending and supports a continuing role for guarantee providers. The financial guarantee market is also becoming more accessible through digital workflows, although collateral demands and uneven legal recognition remain material barriers for smaller obligors. Competition therefore centers on underwriting capacity, cross-border networks, portfolio-based structures, and technology that reduces processing time.
Key Report Takeaways
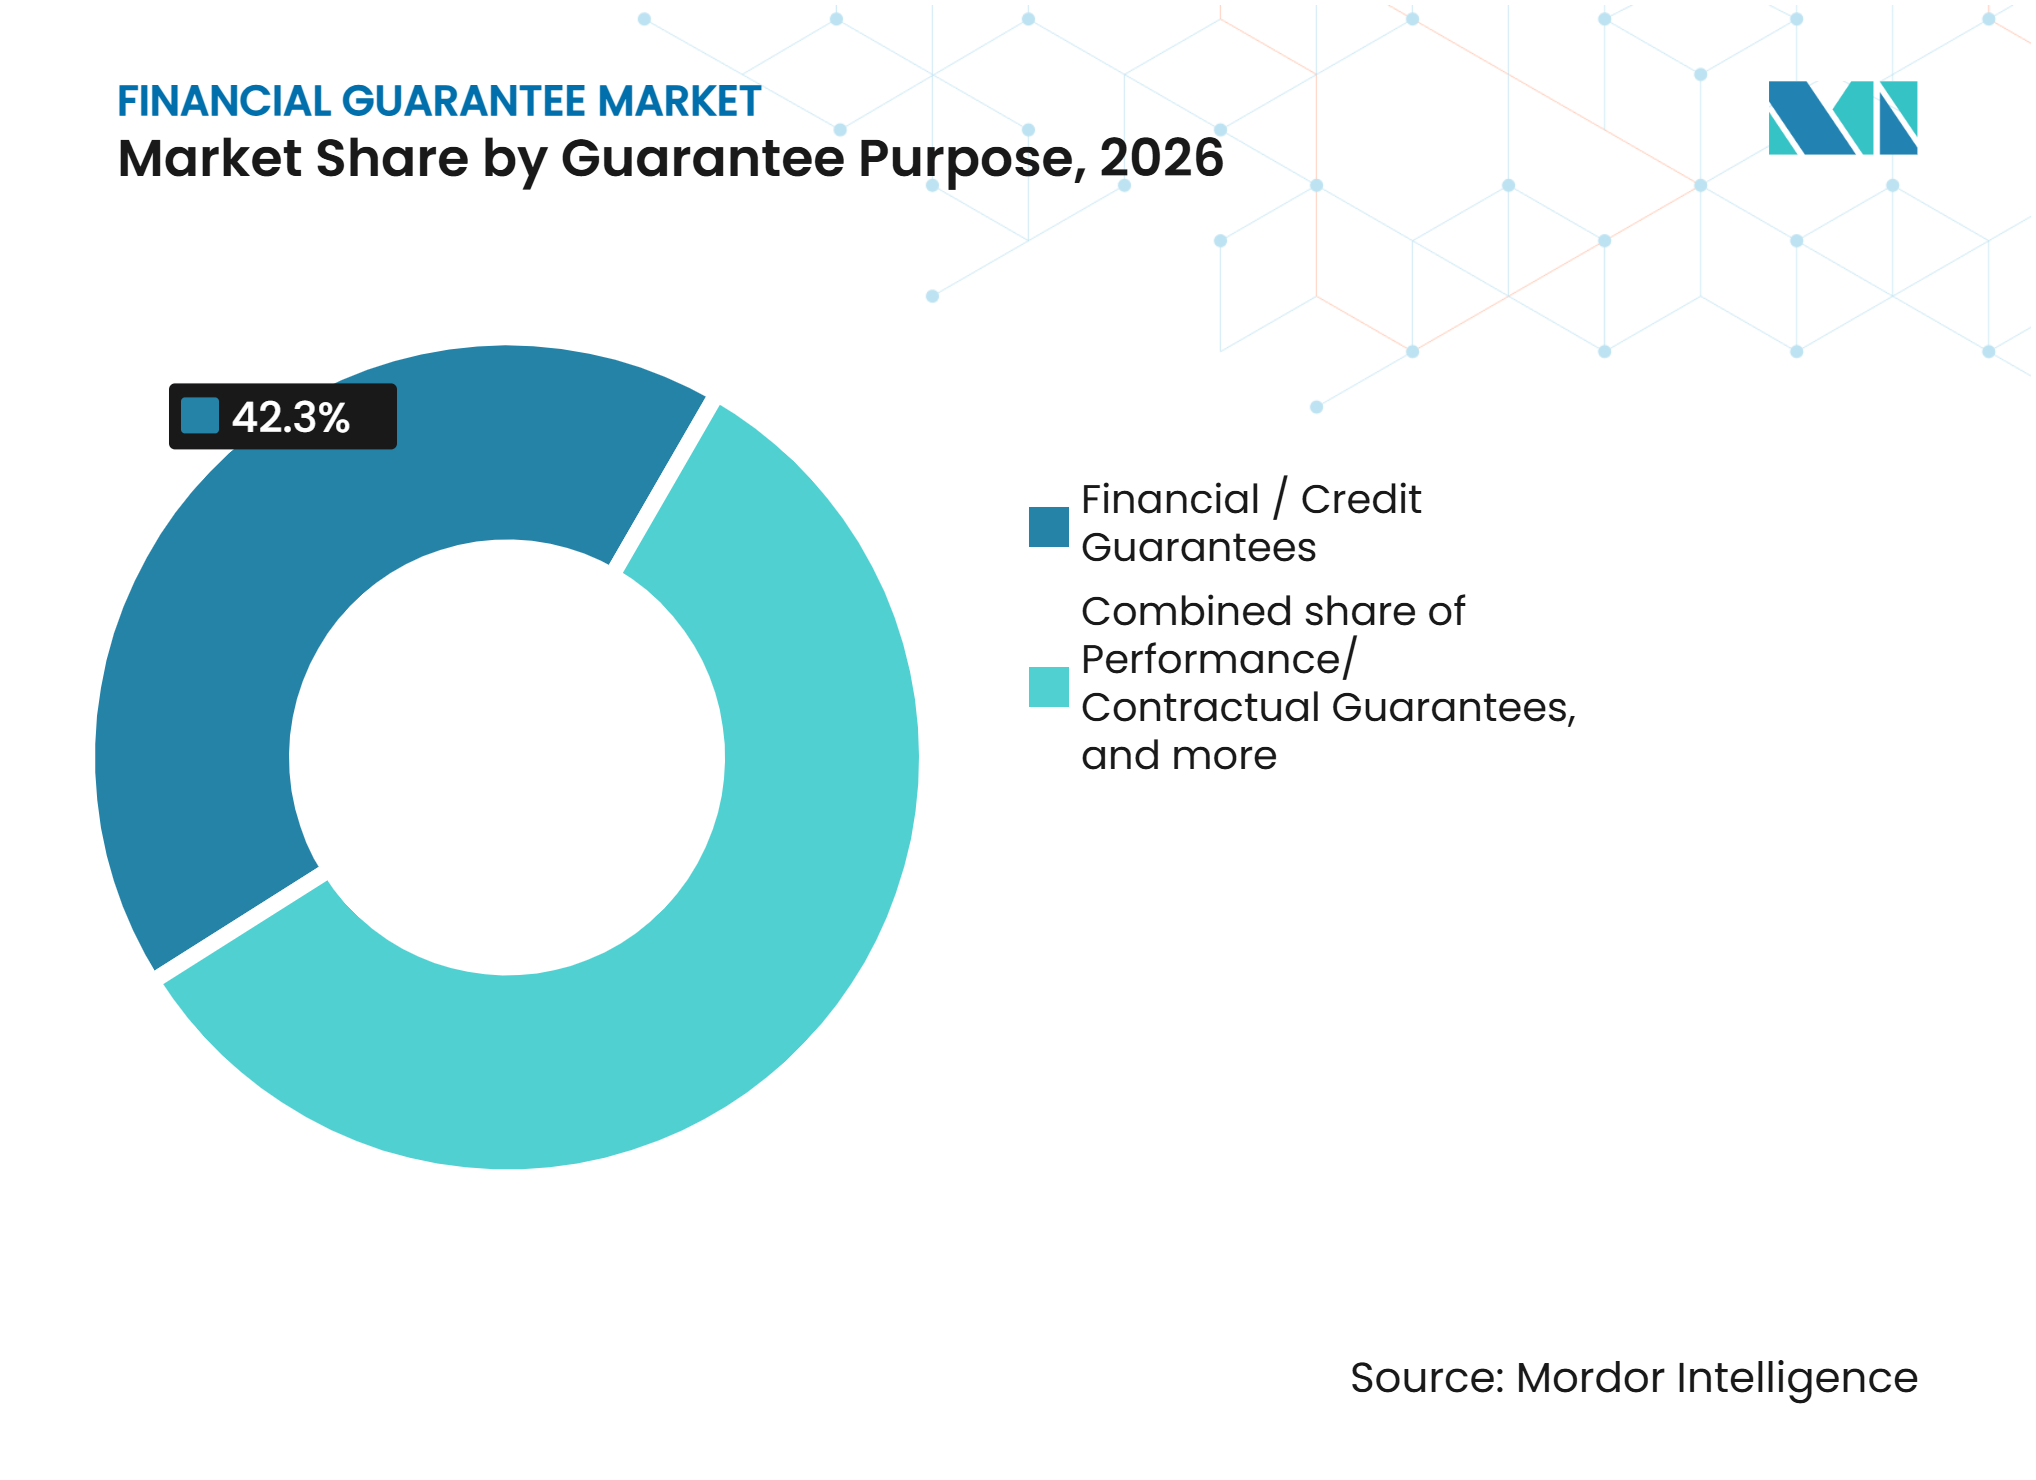
- By guarantee purpose, financial/credit guarantees captured 42.3% of the financial guarantee market share in 2026, while trade credit and short-term export guarantees are projected to grow at an 8.9% CAGR through 2032.
- By issuer type, commercial and universal banks captured 57.8% of the financial guarantee market share in 2026, while export credit agencies and government-backed guarantee institutions are projected to grow at a 9.2% CAGR through 2032.
- By enterprise size, large enterprises held 54.2% of the financial guarantee market share in 2026, while micro and small enterprises are projected to grow at a 9.4% CAGR through 2032.
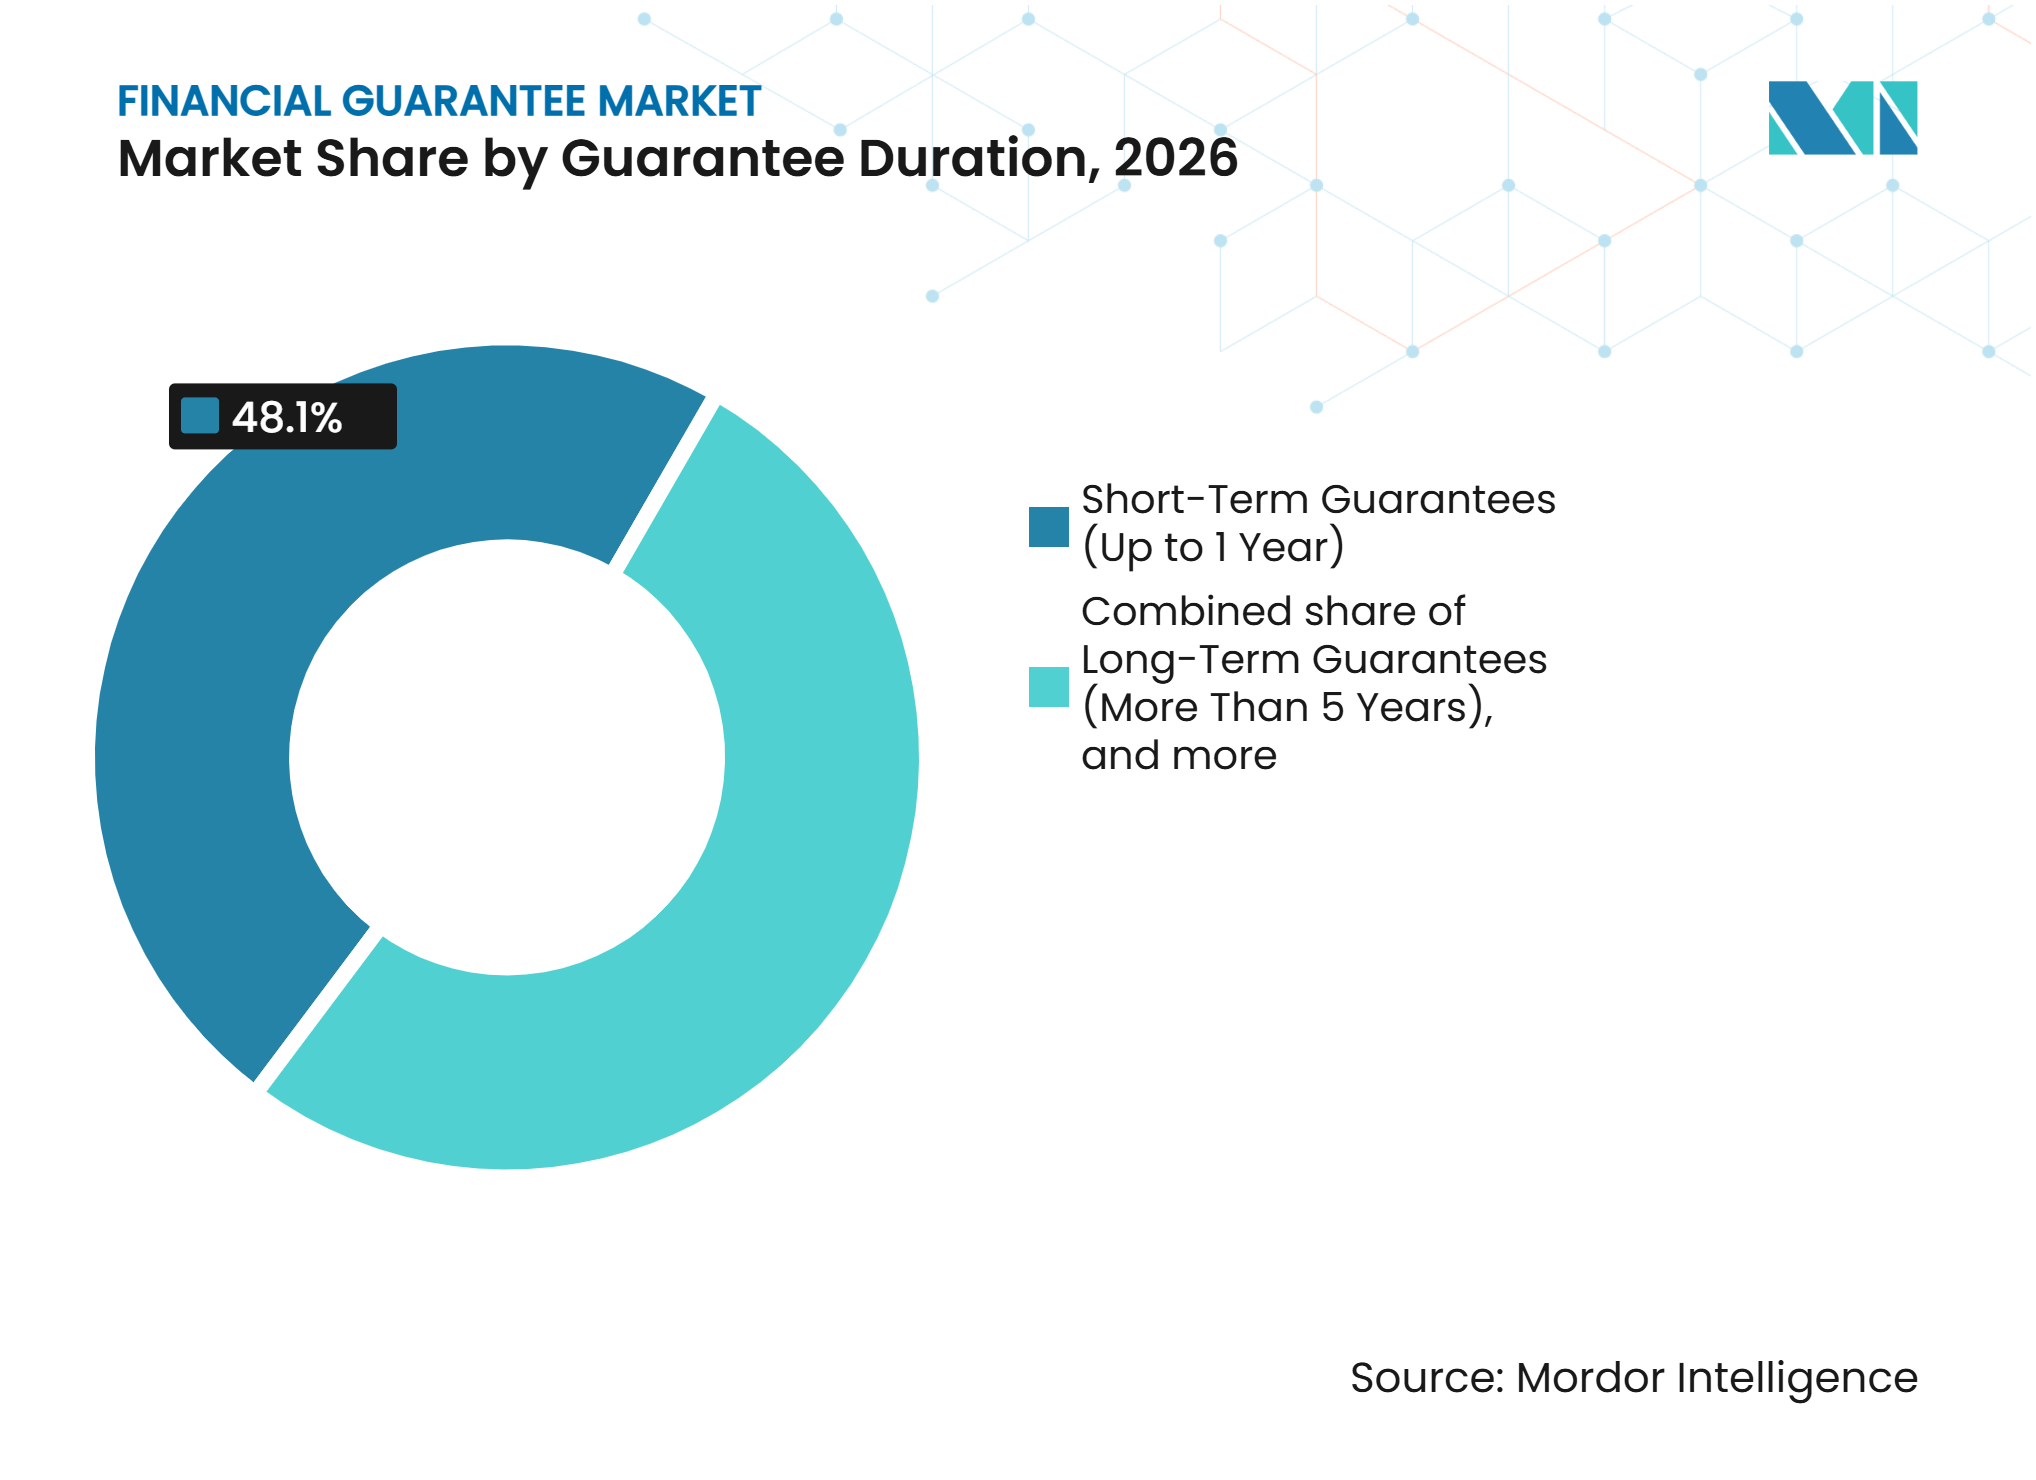
- By guarantee duration, short-term guarantees held 48.1% of the financial guarantee market share in 2026, while long-term guarantees are projected to grow at an 8.5% CAGR through 2032.
- By underlying obligors and project industry, construction and infrastructure held a 23.9% share of the financial guarantee market in 2026, while energy and utilities are projected to grow at a 9.2% CAGR through 2032.
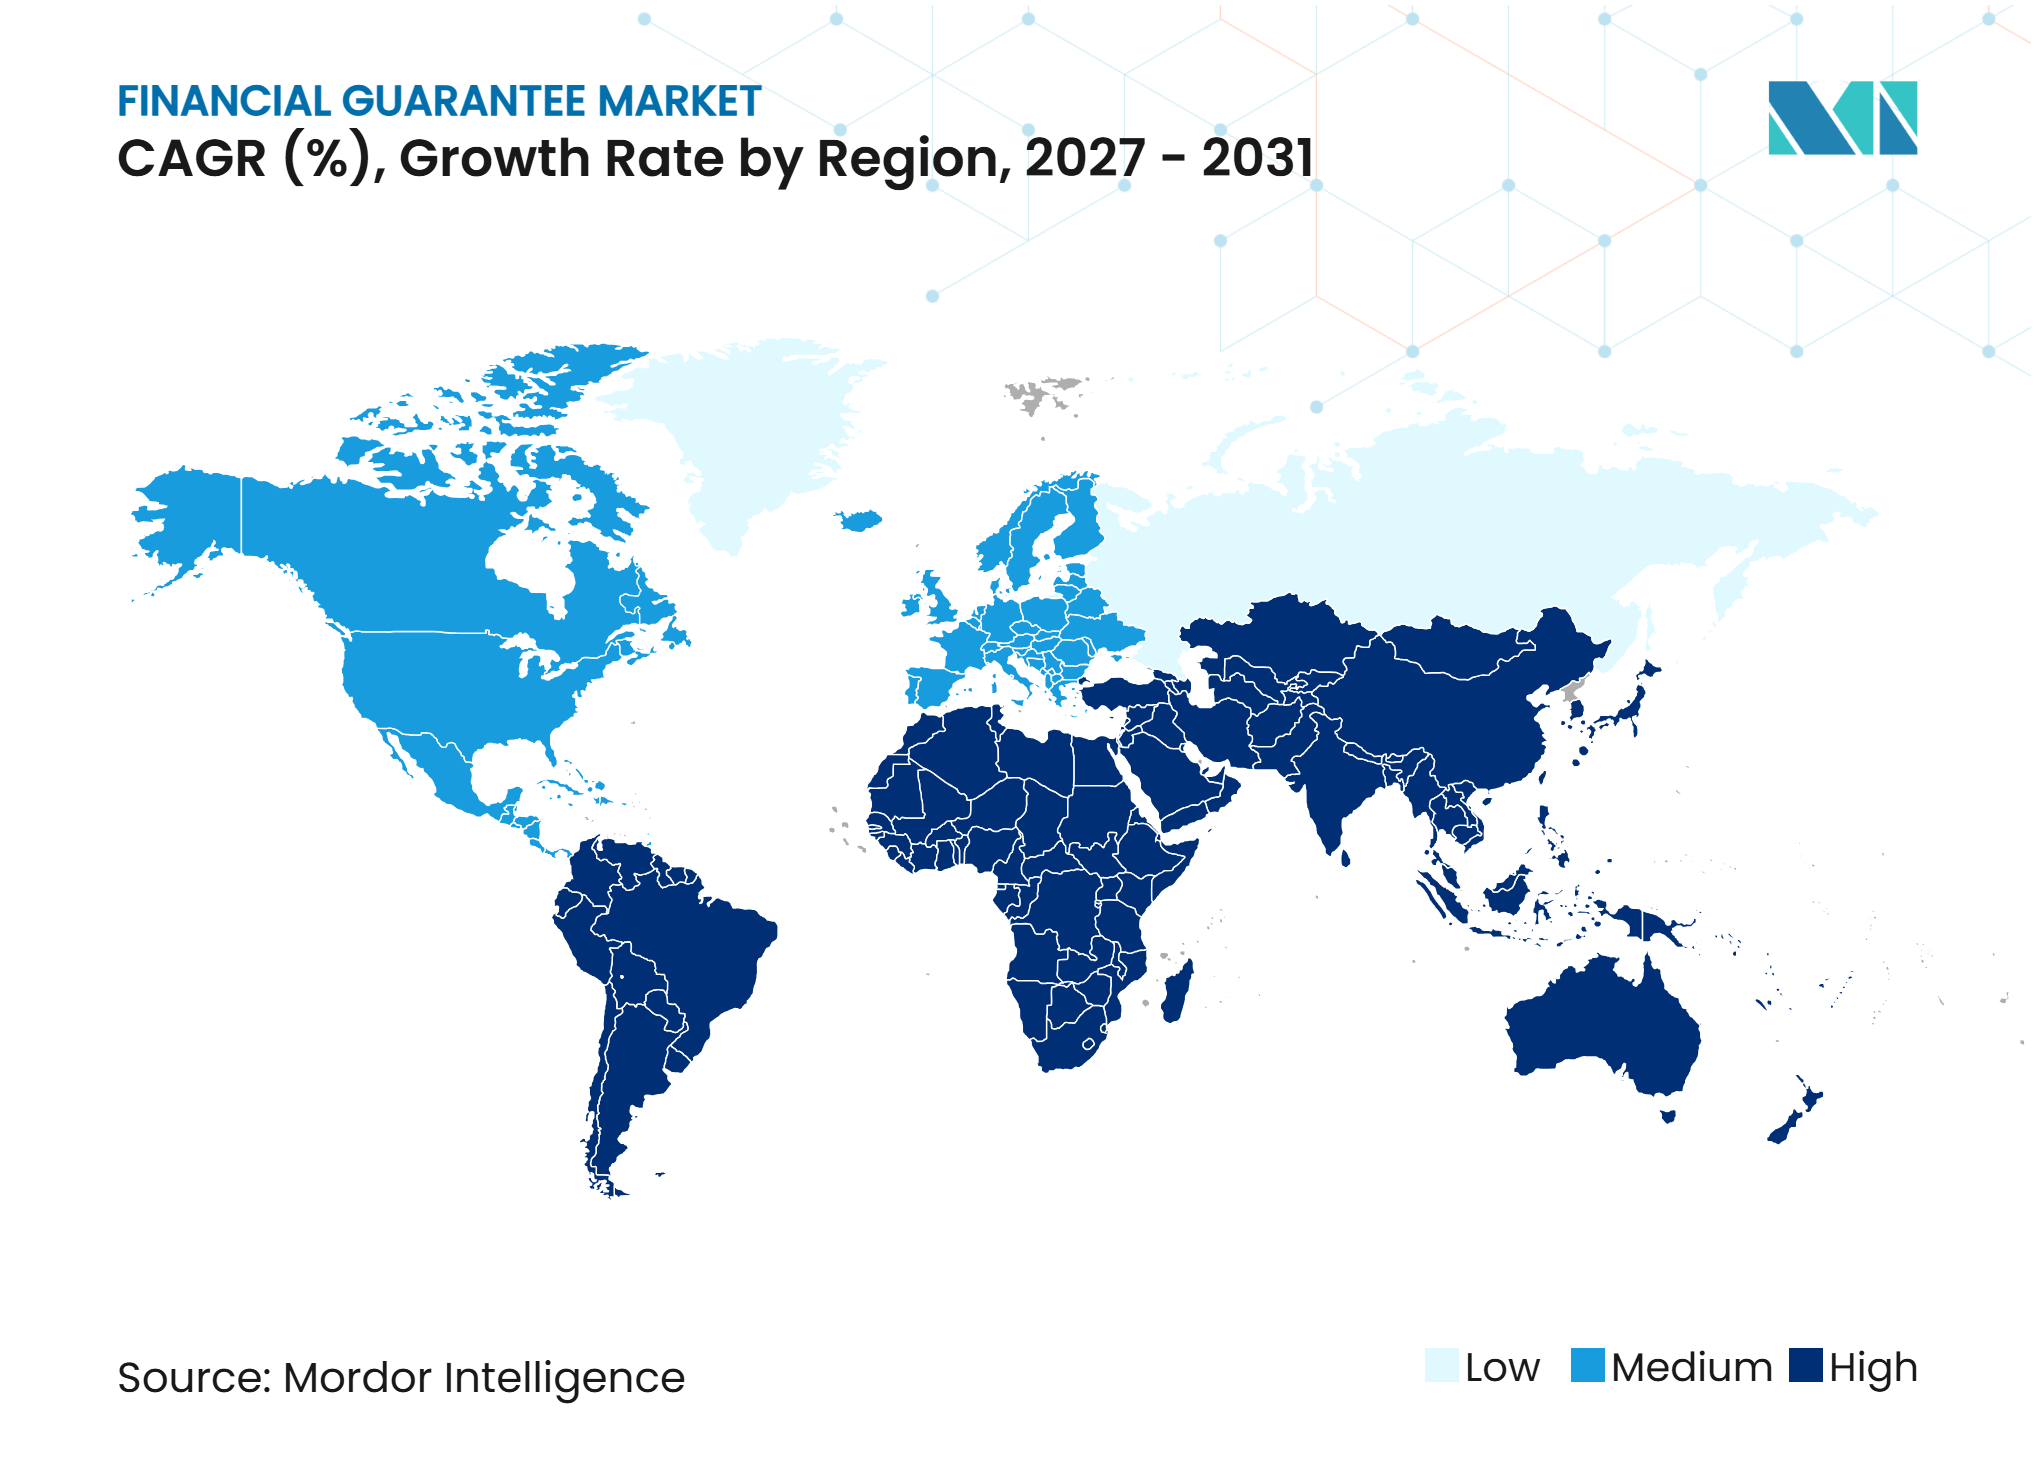
- By geography, North America held 29.2% of the financial guarantee market share in 2026, while Asia-Pacific is projected to grow at an 8.9% CAGR through 2032.
Note: Market numbers in this report are based on Mordor Intelligence's proprietary estimation framework, which combines nine months of actuals with Q4 projections for base year 2026.
Market Trends and Insights
Drivers Impact Analysis of Financial Guarantee Market*
| Driver | (~) % Impact on CAGR Forecast | Geographic Relevance | Impact Timeline |
|---|---|---|---|
| Growth in Cross-Border Trade and Commercial Transactions | +2.0% | Global, concentrated in Asia-Pacific and North America | Medium term (2-4 years) |
| Expansion of Infrastructure and Capital-Intensive Projects | +2.1% | Global, with early gains in Europe, Asia-Pacific, and Middle East and Africa | Long term (≥ 4 years) |
| Rising Demand for Credit Guarantees and Loan Security | +1.8% | Global | Short term (≤ 2 years) |
| SME Financing Needs and Limited Access to Traditional Collateral | +1.5% | Asia-Pacific core, Latin America, and Middle East and Africa | Medium term (2-4 years) |
| Digitalization of Guarantee Issuance and Administration | +1.3% | Europe, North America, and Asia-Pacific | Short term (≤ 2 years) |
| Regulatory Recognition of Eligible Guarantees as Credit Risk Mitigants | +1.1% | Global, with early gains in the European Union and United Kingdom | Long term (≥ 4 years) |
| Source: Mordor Intelligence | |||
Growth in Cross-Border Trade and Commercial Transactions
World merchandise trade volume grew 4.6% in 2025, exceeding earlier forecasts, and Asian economies generated 71% of total volume growth[1]. This expansion increases the need for protection when exporters and buyers begin new counterparty relationships. The Financial guarantee market benefits when firms seek coverage against non-payment and non-delivery across unfamiliar trade corridors. Trade in artificial intelligence-related goods rose 21.9% to USD 4.18 trillion in 2025, creating demand for short-tenor protection across technology supply chains. The Asian Development Bank reported that 80% of surveyed banks expect demand for trade finance, including guarantees, to rise as supply chains are reconfigured and intra-regional trade expands. This outlook favors issuers that can combine cross-border reach with efficient risk assessment.
Expansion of Infrastructure and Capital-Intensive Projects
Infrastructure project finance is increasing demand for long-tenor performance and financial guarantees. Berne Union members recorded USD 231 billion in medium- and long-term new export credit business during 2025, supported by major infrastructure and energy projects[2]. The European Investment Bank and Commerzbank introduced a cooperation supported by a EUR 250 million (USD 270 million) portfolio guarantee for grid equipment manufacturers that need performance and advance-payment guarantees. The European Investment Bank committed EUR 11 billion (USD 11.9 billion) to energy grid financing in 2025 and added a EUR 1.5 billion ( USD 1.6 billion) bank guarantee package for European grid component manufacturers. MIGA signed a USD 1.48 billion agreement with AMEA Power for 23 renewable energy projects in April 2026, showing how public and private providers are serving the same energy investment cycle. The financial guarantee market gains depth when specialist issuers address capacity shortages in large project guarantees.
Rising Demand for Credit Guarantees and Loan Security
Demand for credit guarantees is increasing as lenders seek to preserve capital while extending financing. Financial guaranty structures support lending against municipal bonds, corporate obligations, trade receivables, and project exposures. Assured Guaranty wrote USD 32.9 billion of gross par during 2025 across public finance, infrastructure, and protection on an Australian bank lending portfolio[3]. This activity shows that the financial guarantee market serves both established public debt programs and cross-border bank portfolios. Guarantee providers can help lenders alter exposure profiles without changing the underlying financing need. The result is continuing demand for instruments that offer credible credit enhancement and clear payment terms.
SME Financing Needs and Limited Access to Traditional Collateral
Small and medium-sized enterprises remain an underpenetrated part of the financial guarantee market. The Asian Development Bank found a 41% trade finance rejection rate among small and medium-sized enterprises in its 2026 survey, showing the continuing effect of collateral and documentation barriers. In January 2026, IDB Invest approved a partial guarantee covering up to 90% of payment-default risk for a USD 50 million invoice-discounting facility supporting Banco Santander Argentina supplier clients[4]. The European Union and KfW also announced a EUR 135 million (USD 145.8 million) agreement for alternative financing channels in the Western Balkans, Eastern Neighbourhood, North Africa, and Turkey. These programs help providers extend capacity without requiring conventional property or cash collateral. They also create a clearer route for issuers that can underwrite smaller transactions efficiently.
Restraints Impact Analysis of Financial Guarantee Market*
| Restraint | (~) % Impact on CAGR Forecast | Geographic Relevance | Impact Timeline |
|---|---|---|---|
| High Collateral Requirements and Guarantee-Issuance Costs | -0.9% | Global, especially Asia-Pacific, Latin America, and Middle East and Africa | Short term (≤ 2 years) |
| Cross-Border Legal and Enforceability Risks | -0.7% | Global, particularly emerging markets | Medium term (2-4 years) |
| Counterparty Default Risk and Tighter Underwriting Standards | -0.5% | Global | Short term (≤ 2 years) |
| Inconsistent Guarantee Terms and Documentation Complexity | -0.3% | Cross-border transactions globally | Medium term (2-4 years) |
| Source: Mordor Intelligence | |||
High Collateral Requirements and Guarantee-Issuance Costs
Collateral remains a structural constraint for mid-sized and smaller applicants. Banks often require cash margins, fixed deposits, or immovable property as counter-indemnity, which limits working capital available for operations. Basel credit risk mitigation rules can increase the focus on the quality of counter-indemnity because banks must protect their own capital position. Guarantee issuance costs for infrastructure and construction projects can reach 2-3% of contract value each year. This is most restrictive in early-stage project markets across the Middle East, Africa, South Asia, and Southeast Asia. The financial guarantee market must develop collateral-light structures if it is to serve a broader group of viable smaller obligors.
Cross-Border Legal and Enforceability Risks
Legal enforceability varies widely across jurisdictions and can limit cross-border guarantee demand. The Uniform Rules for Demand Guarantees, URDG 758, provide internationally recognized rules, but their use and judicial interpretation remain uneven. Courts in some emerging markets may impose conditions on demand calls that weaken the unconditional character of a guarantee. Digital instruments add a related issue because legal recognition of electronic signatures and electronic originals differs by jurisdiction. Anti-money-laundering and beneficial-ownership screening further extend approval times for cross-border structures. These issues raise operating costs in the Financial guarantee market and have a greater effect on smaller beneficiaries with limited documentation resources.
*Our forecasts treat driver/restraint impacts as directional, not additive. The impact forecasts reflect baseline growth, mix effects, and variable interactions.
Financial Guarantee Market Segment Analysis
By Guarantee Purpose:
Trade Credit Instruments Redefine Growth at the Short EndFinancial/credit guarantees accounted for 42.3% of the financial guarantee market size in 2026. The segment is supported by secured lending, municipal bond insurance, and structured credit protection. Assured Guaranty reported USD 32.9 billion in gross par written during 2025 across United States public finance, infrastructure transactions, and an Australian bank lending portfolio. Performance and contractual guarantees form the next major category because public procurement frequently requires bid and performance security. These instruments support project owners who need clear recourse if contractual obligations are not met.
Trade credit and short-term export guarantees are forecast to grow at an 8.9% CAGR through 2032. Their growth aligns with supply chain realignment and demand for short-dated protection in emerging trade corridors. MIGA established a USD 700 million trade finance guarantee program with Banco do Brasil in June 2025 to support MSME exporters and sustainable projects. Other licensed instruments, including standby letters of credit used as financial guarantees, retain smaller roles in corporate treasury and real estate finance. The financial guarantee industry continues to use both standardized and specialized products to meet different transaction risks.


By Issuer Type:
Export Credit Agencies Accelerate While Banks Defend Scale AdvantagesCommercial and universal banks held 57.8% of the financial guarantee market size in 2026. Their position reflects established corporate relationships, trade finance networks, and balance sheet capacity. Private insurance and surety companies operate differently because they focus on risk selection and underwriting across bonds and contractual obligations. Their role is particularly relevant in construction and procurement transactions that require bid, performance, or advance-payment protection. Bank and insurance capacity remains important where transactions require substantial limits or reliable local issuance.
Export credit agencies and government-backed guarantee institutions are projected to grow at a 9.2% CAGR through 2032. Berne Union members committed USD 165.9 billion to new export credit schemes in 2025, and their medium- and long-term business reached USD 231 billion. MIGA also arranged a USD 1.48 billion portfolio guarantee for AMEA Power across 23 projects in April 2026. Multilateral institutions can scale delivery through portfolio structures rather than individual project approvals. Other licensed providers, including specialist platforms, remain smaller but gain relevance where guarantee registries and rules are clearly established.
By Enterprise Size:
SME Programs Accelerate, Large Corporates Retain Structural ScaleLarge enterprises held 54.2% of the guarantee market in 2026. These borrowers can support multi-counterparty structures and meet collateral and documentation requirements more readily than smaller firms. Large corporate facilities also benefit from dedicated treasury teams and established bank relationships. IDB Invest and MIGA signed a USD 500 million trade finance guarantee framework for Latin America and the Caribbean in May 2025. The framework reflects continued demand for structured trade support across commercial relationships.
Micro and small enterprises are forecast to grow at 9.4% CAGR through 2032. More than 80% of banks globally have dedicated SME trade finance strategies, yet the 41% rejection rate indicates that delivery gaps remain. Medium-sized enterprises often sit between microfinance-linked programs and complex large corporate facilities. The European Union and EBRD announced a EUR 76.75 million (USD 82.9 million) guarantee in January 2026 for supply chain financing in the Western Balkans and Eastern Neighbourhood. The financial guarantee market can expand further when program design reduces the gap between available facilities and smaller firms' financing needs.
By Guarantee Duration:
Long-Tenor Instruments Follow the Energy Transition Capital Spending CycleShort-term guarantees held 48.1% of the financial guarantee market size in 2026. This share reflects the prevalence of instruments that reset by contract cycle or annually. Import and export guarantees, tender guarantees, and procurement performance bonds all support short-term activity. Their use is linked closely to regular trade flows and routine public contracting. Short duration also permits issuers to reassess risk frequently as country, buyer, or supplier conditions change.
Long-term guarantees are forecast to grow at 8.5% CAGR through 2032. Energy transition investments need guarantee tenors that are closer to the operating life of the assets they support. EIFO provided a GBP 500 million (USD 640 million) guarantee for ScottishPower Renewables' GBP 4.5 billion (USD 5.76 billion) East Anglia Three offshore wind farm. Medium-term guarantees support capital equipment finance, working capital, and corporate credit lines. IFC provided a USD 95 million financial guarantee covering a USD 2 billion Crédit Agricole CIB trade finance portfolio, showing how medium-term structures can release capital for emerging-market lending.

By Underlying Obligors / Project Industry:
Energy Overtakes as the Highest-Growth VerticalConstruction and infrastructure held 23.9% of the guarantee market in 2026. The segment is supported by surety bond requirements in public procurement frameworks. India’s National Highways Authority of India recorded insurance surety bond issuance above USD 1.2 billion by July 2025. The growth of formal surety instruments gives contractors an alternative to conventional bank guarantees. Manufacturing, international trade, wholesale, logistics, and public-sector entities also provide recurring demand for bid bonds, advance-payment guarantees, and retention instruments.
Energy and utilities are forecast to grow at 9.2% CAGR through 2032. Global energy investment reached USD 3.3 trillion in 2025, with renewable generation and grid infrastructure requiring increasing levels of political risk, performance, and financial guarantee support. The OECD reported that blended finance guarantees can mobilize private funding for clean energy in emerging markets. Public providers increasingly act as early risk takers in projects that private issuers may approach carefully. This broadens the financial guarantee market across renewable energy, grid upgrades, and associated equipment supply chains.
Geography Analysis
North America accounted for a 29.2% regional share in 2026. The United States market is supported by municipal bond insurance, corporate surety, and public infrastructure finance. Assured Guaranty wrapped USD 27 billion of insured par in the United States during 2025, which was its highest level in 15 years. Corporate surety activity is linked to infrastructure procurement and high-technology manufacturing projects. Canada and Mexico add trade credit and performance guarantee demand through integrated North American supply chains and cross-border energy finance.
Europe has demand related to energy infrastructure, export credit, and equipment supply chains. The European Investment Bank and Commerzbank cooperation uses a EUR 250 million (USD 270 million) guarantee to support performance and advance-payment guarantees for electricity grid equipment manufacturers. Bpifrance Assurance Export provided a GBP 5 billion (USD 6.4 billion) loan guarantee for EDF Group commercial contracts in the Sizewell C project in January 2026. Middle East, Africa, and Central Asia are receiving greater portfolio-based capacity for renewable energy projects. MIGA’s USD 1.48 billion AMEA Power agreement covered 23 projects and included grid-scale battery storage across these regions. These arrangements can reduce the administrative burden of issuing support one project at a time.
Asia-Pacific is projected to grow at an 8.9% CAGR through 2032, the fastest regional rate in the Financial guarantee market. Supply chain realignment, artificial intelligence infrastructure, and renewable energy projects are supporting demand across the region. DBS Bank generated SGD 630 million (USD 488 million) in trade finance income in 2025, while UOB trade loans rose 26% on stronger intra-Asian trade and East Asia-to-Gulf flows. India recorded more than USD 1.2 billion in insurance surety bonds for National Highways Authority of India contracts by July 2025. South America also shows increasing activity, as Brazil’s surety bond premiums reached BRL 6.3 billion (USD 1.26 billion) in 2025, and 2026 infrastructure auctions cover BRL 240 billion (USD 48 billion) of investment. IDB Invest and MIGA are supporting the region through a USD 500 million framework directed at its USD 350 billion trade finance gap.
Competitive Landscape
Market Concentration
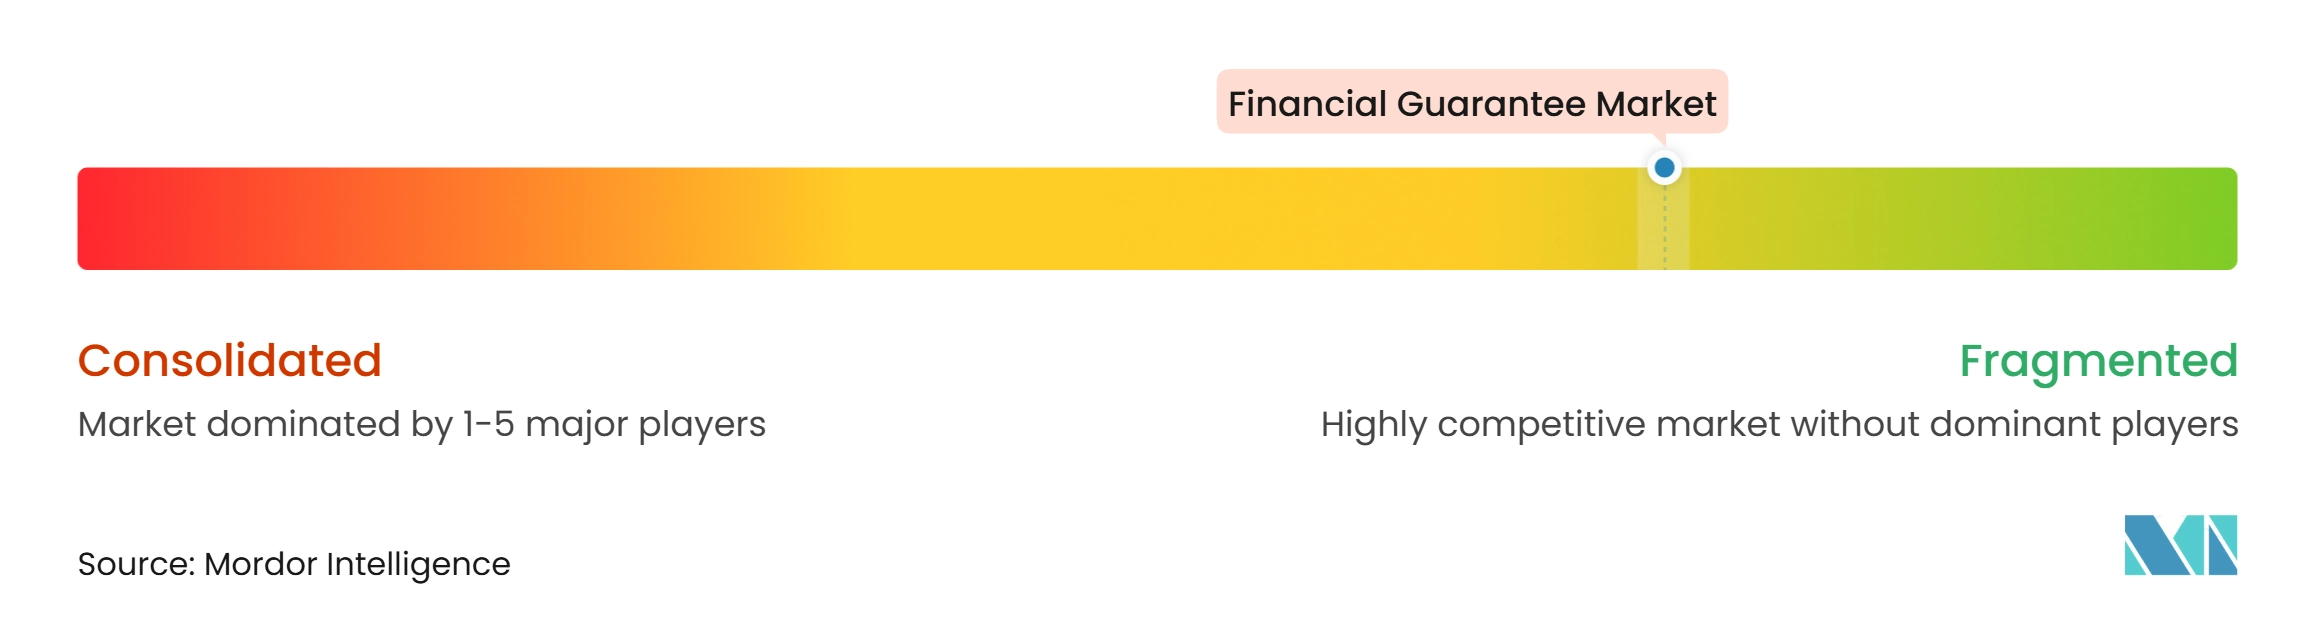
The financial guarantee market is fragmented globally, although product sub-markets can be concentrated. Commercial banks such as HSBC Holdings, BNP Paribas, JPMorgan Chase, Citigroup, Deutsche Bank, and Banco Santander compete through geographic networks, balance sheet strength, and trade finance capabilities. In July 2026, MIGA and Deutsche Bank launched a EUR 1 billion (USD 1.08 billion) platform for trade finance guarantees covering non-payment risk at eligible state-owned banks in emerging and frontier markets. The platform gives Deutsche Bank a repeatable mechanism for extending capacity while managing risk. Banks with established local relationships are well placed to issue or confirm guarantees across multiple jurisdictions.
The specialist financial guaranty segment has a more concentrated structure. Assured Guaranty held a 58.5% share of United States new-issue municipal bond insurance in 2025 and wrote USD 32.9 billion of gross par. Chubb, Zurich Insurance Group, Arch Capital Group, Tokio Marine Holdings, Liberty Mutual, The Travelers Companies, The Hartford Financial Services Group, CNA Financial Corporation, and AIG compete in performance, bid, and advance-payment bonds. Their competitive position depends on underwriting discipline, risk diversification, distribution relationships, and claims management. The financial guarantee market also benefits from providers that can supply capacity where bank balance sheets or country risk limits are restrictive.
Strategic competition increasingly reflects digital guarantee infrastructure, portfolio issuance structures, and programs tailored for SMEs. In June 2026, the World Bank Group added USD 500 million in MIGA guarantees to the IFC Global Trade Liquidity Program for eligible state-owned bank non-payment risk. HSBC was the first lender approved under the new framework, which is directed toward SME credit access in low- and middle-income countries. The World Bank Group Guarantee Platform targets USD 20 billion in annual issuance by 2030, increasing competitive pressure in underserved markets. European banking supervisors have reported increasing use of artificial intelligence for credit scoring and fraud detection, while global guidance on responsible use is creating additional compliance needs. Larger providers may be better able to absorb these technology and compliance requirements.
Financial Guarantee Industry Leaders
-
HSBC Holdings plc
-
BNP Paribas SA
-
JPMorgan Chase and Co.
-
Citigroup Inc.
-
The Industrial and Commercial Bank of China Limited
- *Disclaimer: Major Players sorted in no particular order
Financial Guarantee Market Companies Covered in this Report
- HSBC Holdings plc
- BNP Paribas SA
- JPMorgan Chase & Co.
- Citigroup Inc.
- Industrial and Commercial Bank of China Limited (ICBC)
- Standard Chartered plc
- Deutsche Bank AG
- Bank of America Corporation
- Barclays plc
- Banco Santander, S.A.
- Assured Guaranty Ltd.
- Chubb Limited
- Zurich Insurance Group AG
- Liberty Mutual Insurance Group
- Arch Capital Group Ltd.
- The Travelers Companies, Inc.
- The Hartford Financial Services Group, Inc.
- CNA Financial Corporation
- Tokio Marine Holdings, Inc.
- American International Group, Inc. (AIG)
Recent Industry Developments in Financial Guarantee Market
- July 2026: MIGA and Deutsche Bank launched a EUR 1 billion trade finance guarantee platform, valued at USD 1.08 billion, covering Deutsche Bank's non-payment risk on transactions with eligible state-owned banks in emerging and frontier markets over an initial 3-year term with an optional 3-year extension.
- June 2026: The World Bank Group added USD 500 million in MIGA guarantees to the IFC’s Global Trade Liquidity Program (GTLP) to cover non-payment risk by eligible state-owned banks. HSBC was the first lender approved under the framework targeting SME credit access in low- and middle-income countries.
- April 2026: MIGA signed a portfolio guarantee agreement of up to USD 1.48 billion with AMEA Power for 23 renewable energy and battery-storage projects across Africa, the Middle East, and Central Asia. The agreement pushed MIGA's cumulative guarantee issuance past USD 100 billion and expanded portfolio-based delivery.
- April 2026: The European Investment Bank and Commerzbank launched cooperation supported by a EUR 250 million (USD 270 million) portfolio guarantee for performance and advance-payment guarantees issued to European electricity grid equipment manufacturers.
Global Financial Guarantee Market Report Scope
Segmentation Overview
| Financial / Credit Guarantees |
| Performance / Contractual Guarantees |
| Trade Credit and Short-Term Export Guarantees |
| Residual / Other Licensed Guarantee Instruments |
| Commercial and Universal Banks |
| Private Insurance and Surety Companies |
| Export Credit Agencies and Government-Backed Guarantee Institutions |
| Multilateral and Development Finance Institutions |
| Other Licensed Financial Guarantee Providers |
| Micro and Small Enterprises |
| Medium-Sized Enterprises |
| Large Enterprises |
| Short-Term Guarantees (Up to 1 Year) |
| Medium-Term Guarantees (More Than 1 Year to 5 Years) |
| Long-Term Guarantees (More Than 5 Years) |
| Construction and Infrastructure |
| Energy and Utilities |
| Manufacturing and Industrial |
| International Trade, Wholesale and Logistics |
| Government and Public-Sector Entities |
| Other Industries |
| North America | United States |
| Canada | |
| Mexico | |
| South America | Brazil |
| Argentina | |
| Rest of South America | |
| Europe | United Kingdom |
| Germany | |
| France | |
| Italy | |
| Spain | |
| Rest of Europe | |
| Asia-Pacific | China |
| Japan | |
| India | |
| South Korea | |
| Australia | |
| Indonesia | |
| Thailand | |
| Malaysia | |
| Singapore | |
| Vietnam | |
| Rest of Asia-Pacific | |
| Middle East and Africa | Saudi Arabia |
| United Arab Emirates | |
| Turkey | |
| South Africa | |
| Egypt | |
| Rest of Middle East and Africa |
| By Guarantee Purpose | Financial / Credit Guarantees | |
| Performance / Contractual Guarantees | ||
| Trade Credit and Short-Term Export Guarantees | ||
| Residual / Other Licensed Guarantee Instruments | ||
| By Issuer Type | Commercial and Universal Banks | |
| Private Insurance and Surety Companies | ||
| Export Credit Agencies and Government-Backed Guarantee Institutions | ||
| Multilateral and Development Finance Institutions | ||
| Other Licensed Financial Guarantee Providers | ||
| By Enterprise Size | Micro and Small Enterprises | |
| Medium-Sized Enterprises | ||
| Large Enterprises | ||
| By Guarantee Duration | Short-Term Guarantees (Up to 1 Year) | |
| Medium-Term Guarantees (More Than 1 Year to 5 Years) | ||
| Long-Term Guarantees (More Than 5 Years) | ||
| By Underlying Obligors / Project Industry | Construction and Infrastructure | |
| Energy and Utilities | ||
| Manufacturing and Industrial | ||
| International Trade, Wholesale and Logistics | ||
| Government and Public-Sector Entities | ||
| Other Industries | ||
| By Geography | North America | United States |
| Canada | ||
| Mexico | ||
| South America | Brazil | |
| Argentina | ||
| Rest of South America | ||
| Europe | United Kingdom | |
| Germany | ||
| France | ||
| Italy | ||
| Spain | ||
| Rest of Europe | ||
| Asia-Pacific | China | |
| Japan | ||
| India | ||
| South Korea | ||
| Australia | ||
| Indonesia | ||
| Thailand | ||
| Malaysia | ||
| Singapore | ||
| Vietnam | ||
| Rest of Asia-Pacific | ||
| Middle East and Africa | Saudi Arabia | |
| United Arab Emirates | ||
| Turkey | ||
| South Africa | ||
| Egypt | ||
| Rest of Middle East and Africa | ||
Key Questions Answered in the Report
What is the projected size of the financial guarantee sector by 2032?
The sector is forecast to reach USD 61.8 billion by 2032, growing from USD 43.1 billion in 2027 at a 7.5% CAGR.
Which guarantee purpose holds the largest share?
Financial/Credit Guarantees hold the largest share at 42.3% in 2026.
Which issuer category is growing the fastest?
Export Credit Agencies and Government-Backed Guarantee Institutions are forecast to grow at 9.2% CAGR through 2032.
Why are guarantees important for small and medium-sized enterprises?
They can reduce lender exposure where small and medium-sized enterprises lack conventional collateral, although 41% still face trade finance rejection.
Which region is expected to grow the fastest?
Asia-Pacific is forecast to grow at 8.9% CAGR through 2032, supported by trade, infrastructure, and energy investment.
What limits wider guarantee adoption?
Collateral requirements, issuance costs, legal uncertainty, and inconsistent documentation can delay or prevent access.