Field Force Automation Market Size and Share
Market Overview
| Study Period | 2021 - 2031 |
|---|---|
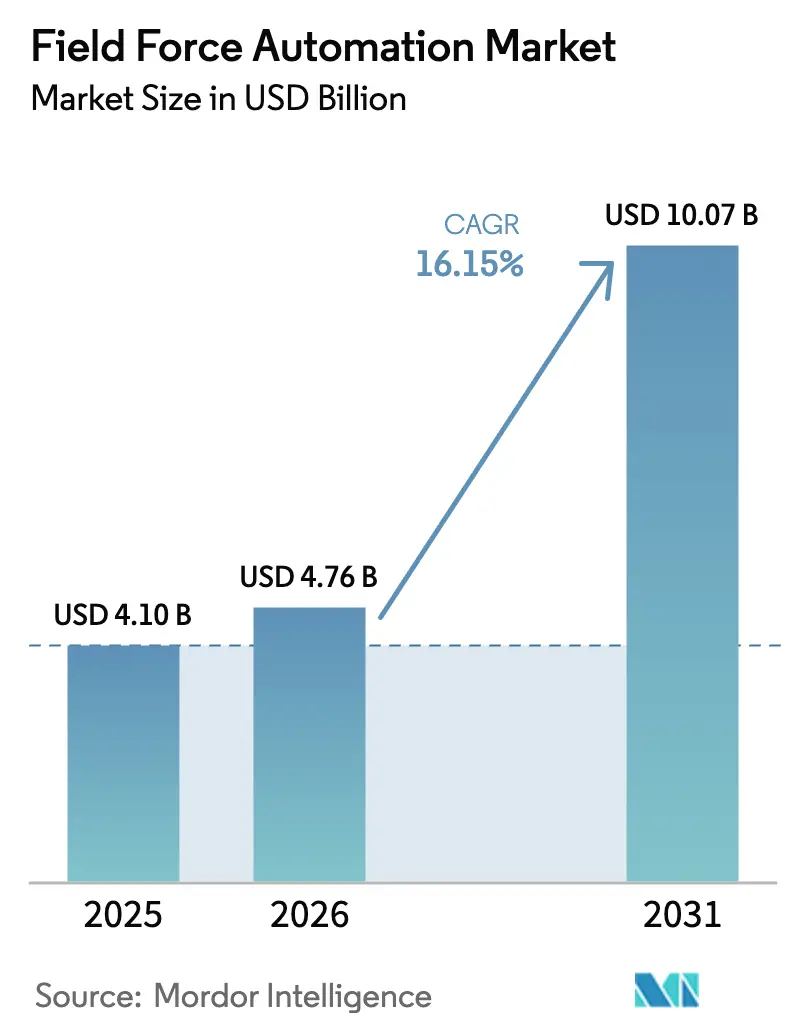
| Market Size (2026) | USD 4.76 Billion |
| Market Size (2031) | USD 10.07 Billion |
| Growth Rate (2026 - 2031) | 16.15% CAGR |
| Fastest Growing Market | Asia Pacific |
| Largest Market | North America |
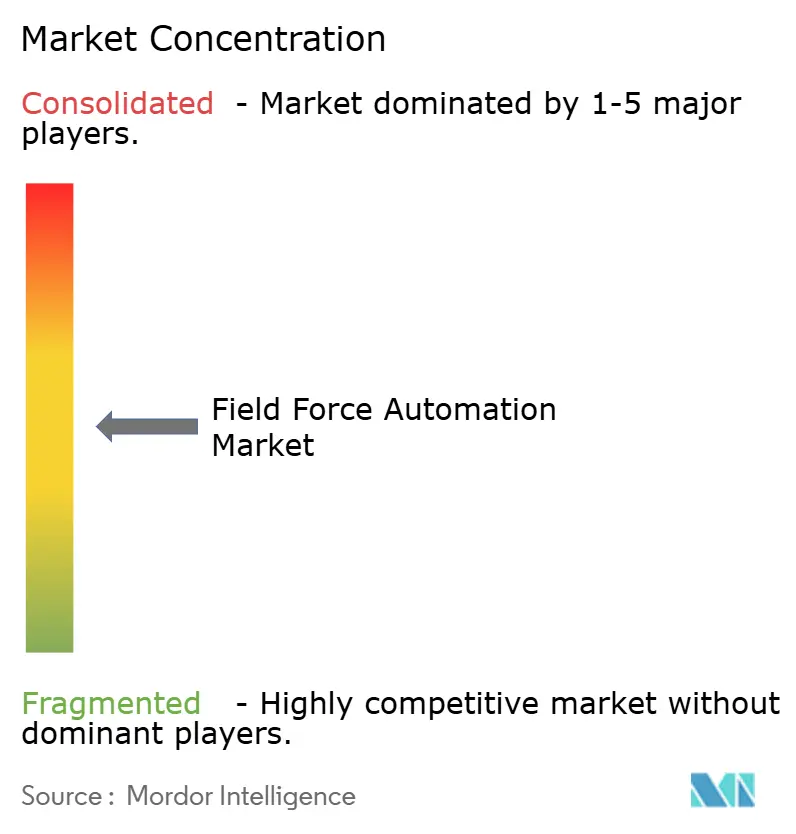
| Market Concentration | Medium |
Major Players *Disclaimer: Major Players sorted in no particular order Image © Mordor Intelligence. Reuse requires attribution under CC BY 4.0. | |
Field Force Automation Market Analysis by Mordor Intelligence
The Field Force Automation market size was valued at USD 4.1 billion in 2025 and estimated to grow from USD 4.76 billion in 2026 to reach USD 10.07 billion by 2031, at a CAGR of 16.15% during the forecast period (2026-2031). Everywhere, organizations are shifting from basic mobile workforce applications toward AI-driven, cloud-first platforms that orchestrate scheduling, inventory, and customer interactions in real time. Rising 5G coverage, falling device costs, and stricter service-level promises are intensifying adoption, while embedded analytics are turning field data into measurable efficiencies. In North America, same-day delivery pressures and Electronic Visit Verification (EVV) mandates are accelerating deployments, whereas in Asia, smart-manufacturing programs and rapid mobile-broadband growth are pushing uptake faster than in any other region. Vendors are responding with verticalized solutions, carbon-tracking modules, and outcome-based pricing to secure long-term contracts and expand wallet share. Investment patterns reveal that 92% of large enterprises intend to lift AI spending on field operations between 2025 and 2028, underscoring a strong runway for platform extensions and managed services.
Key Report Takeaways
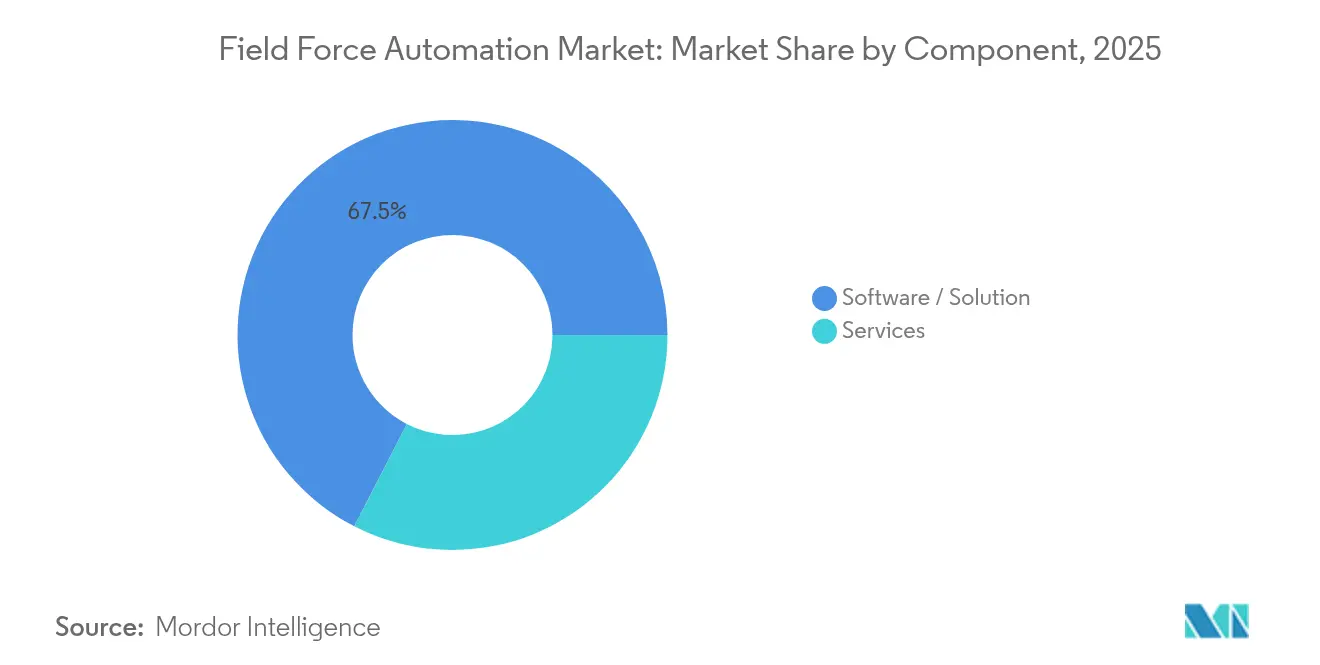
- By component, Software/Solution commanded 67.45% of Field Force Automation market share in 2025, while Services is advancing at a 16.8% CAGR through 2031.
- By deployment, Cloud solutions captured 71.05% of the Field Force Automation market in 2025; the model is scaling at a 15.6% CAGR to 2031.
- By enterprise size, Large Enterprises held 59.05% share of the Field Force Automation market in 2025, whereas SMEs are set to grow at 17.9% CAGR.
- By platform, Android led with 56.70% share in 2025; iOS shows the highest growth at 16.6% CAGR.
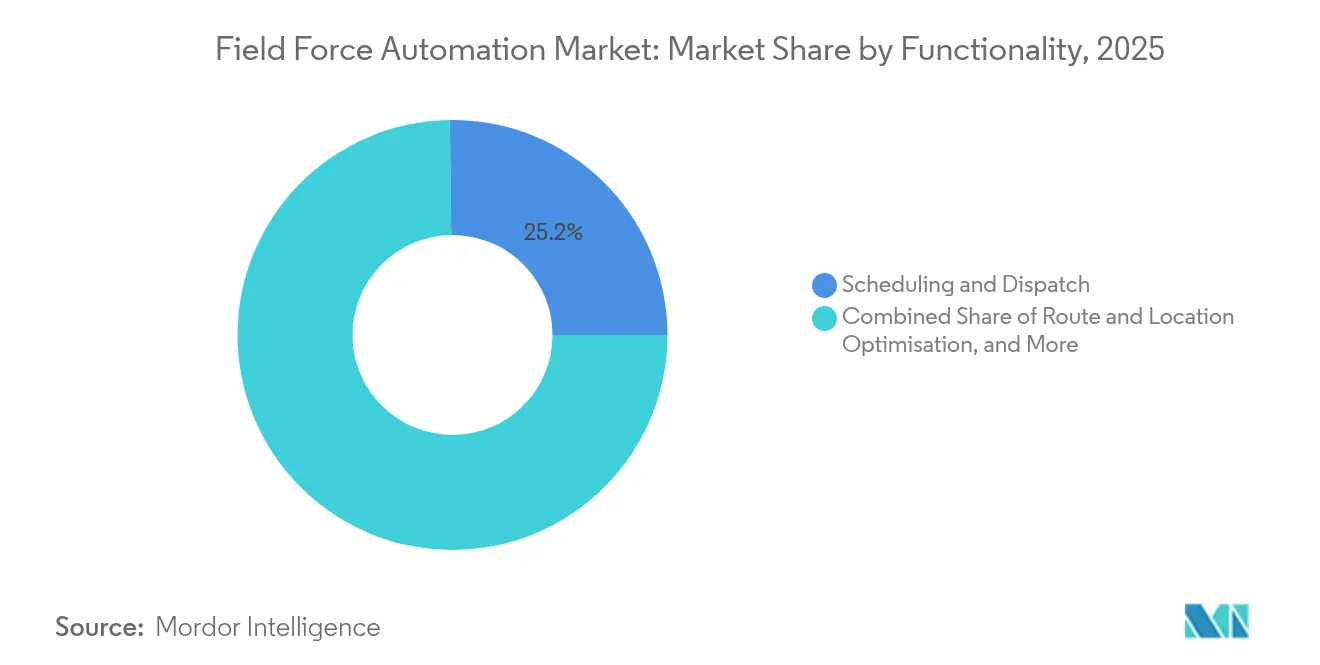
- By functionality, Scheduling and Dispatch accounted for 25.20% of the Field Force Automation market size in 2025; Inventory and Parts Management is the fastest-growing area at 16.9% CAGR.
- By end-user industry, Transportation and Logistics held 22.10% Field Force Automation market share in 2025, while Healthcare and Life Sciences is projected to expand at 18.9% CAGR.
- By geography, North America led with 37.45% share in 2025; Asia Pacific is the fastest-growing region at 17.2% CAGR to 2031.
Note: Market size and forecast figures in this report are generated using Mordor Intelligence’s proprietary estimation framework, updated with the latest available data and insights as of 2026.
Global Field Force Automation Market Trends and Insights
Drivers Impact Analysis*
| Driver | (~)% Impact on CAGR Forecast | Geographic Relevance | Impact Timeline |
|---|---|---|---|
| Surge in same-day-delivery commitments driving real-time route optimization in N. America retail logistics | +3.8% | North America, with spillover to Europe and developed APAC markets | Medium term (2-4 years) |
| US Electronic Visit Verification (EVV) mandates boosting mobile home-health apps | +2.8% | United States, with adoption spreading to Canada and EU markets | Short term (≤ 2 years) |
| 5G rollout in APAC enabling video-assisted remote maintenance for industrial OEMs | +3.3% | APAC core (China, Japan, South Korea, Taiwan), with gradual expansion to India and Southeast Asia | Medium term (2-4 years) |
| Tele-health expansion raising nurse-scheduling complexity in Europe | +2.3% | Europe, North America, and developed APAC markets | Medium term (2-4 years) |
| Grid-electrification projects in Middle East need mobile outage-management tools | +1.8% | Middle East, Africa, and developing APAC regions | Long term (≥ 4 years) |
| Carbon-tracking disclosure rules prompting digital trip-footprint logging | +1.5% | Global, with early adoption in Europe and North America | Long term (≥ 4 years) |
| Source: Mordor Intelligence | |||
Surge in same-day-delivery commitments driving route optimization
E-commerce giants have made next-day shipping the norm and same-day fulfillment the new differentiator. Sixty percent of North American retailers now offer same-day delivery, compelling logistics teams to deploy AI-enabled route-optimization engines that cut delivery time by 30% and raise drops per driver by 25%. Competitive intensity keeps capital flowing into real-time navigation, traffic prediction, and mobile proof-of-delivery tools that turn last-mile execution into a profit lever rather than a cost center. Regional carriers increasingly select SaaS platforms that can scale rapidly during peak seasons without new infrastructure spend. As 5G and edge processing mature, dynamic rerouting will further squeeze idle time and boost asset utilization.
US Electronic Visit Verification mandates boosting home-health mobile apps
The 21st Century Cures Act enforces EVV for Medicaid-funded home visits, creating mandatory digital check-ins across all US states by 2025. Michigan’s USD 11.3 million EVV contract illustrates state-level investment and speeds mobile-app rollout among care agencies [1]Michigan Department of Health & Human Services, “Electronic Visit Verification Contract,” michigan.gov. Compliance deadlines are prompting providers to integrate GPS stamps, biometric confirmation, and automated timesheets, yielding richer data for caregiver dispatch and patient-outcome analytics. Platform vendors are layering AI models that predict visit duration and recommend optimal travel paths, lifting workforce productivity and lowering fraud risk.
5G rollout enabling video-assisted remote maintenance
Asia’s 5G footprint now covers more than 1.5 billion subscribers, enabling high-definition video calls between field technicians and remote experts. The APEC “5G Smart Manufacturing” program targets 15-20% supply-chain efficiency gains by embedding real-time diagnostics and AR guidance into industrial repair workflows. OEMs report 40% reductions in mean-time-to-repair and 30% rises in first-time-fix rates, curbing downtime penalties and travel emissions. Cloud-based knowledge libraries and edge-rendered 3D schematics are becoming standard modules within Field Force Automation market leaders’ portfolios.
Tele-health expansion raising nurse-scheduling complexity
Virtual consultations surged 38% in 2024 and now complement in-person visits, forcing providers to synchronize clinician availability across two delivery modes. By 2030, adults 65+ will make up 21% of the US population, intensifying demand for home care. AI-driven scheduling aligns preferences, credentials, and travel windows, trimming overtime and lifting resource utilization by up to 15%. Integration with EHRs and reimbursement systems is turning field data into a closed-loop care model that balances quality and cost.
Restraints Impact Analysis*
| Restraint | (~) % Impact on CAGR Forecast | Geographic Relevance | Impact Timeline |
|---|---|---|---|
| Unionised labour privacy caps on live tracking in W. Europe | -1.2% | Western Europe, with potential spread to North America | Medium term (2-4 years) |
| Legacy ERP integration gaps in mid-size LatAm manufacturers | -1.8% | Latin America, parts of Southern Europe, and developing APAC | Short term (≤ 2 years) |
| Volatile satellite-data costs for remote African mining sites | -0.8% | Africa, remote regions in APAC and Latin America | Long term (≥ 4 years) |
| Rising cyber-insurance premiums for healthcare workforce apps | -1.5% | Global, with highest impact in North America and Europe | Medium term (2-4 years) |
| Source: Mordor Intelligence | |||
Unionised labour privacy caps limiting tracking capabilities
Europe’s strong unions and GDPR framework constrain continuous GPS monitoring, obliging employers to justify data collection and offer “right-to-disconnect” windows [2]European Commission, “General Data Protection Regulation,” europa.eu. Vendors now embed consent dashboards, anonymized heatmaps, and shift-based tracking toggles to preserve analytics without persistent surveillance. These design choices may form new global privacy benchmarks, but they can dilute optimization granularity and slow ROI calculations in highly unionized sectors.
Legacy ERP integration challenges hampering adoption
Mid-sized Latin American manufacturers still run heavily customized on-premise ERPs that lack modern APIs, elevating the cost and risk of real-time data interchange. Specialized middleware firms report 30% annual revenue growth from pre-built connectors that bridge heritage systems and cloud field-service modules. Yet tight IT budgets and scarce integration talent continue to delay deployments, restraining regional momentum until low-code and template-based connectors proliferate.
*Our forecasts treat driver/restraint impacts as directional, not additive. The impact forecasts reflect baseline growth, mix effects, and variable interactions.
Segment Analysis
By Component: Services closing the value gap
Software/Solution generated 67.45% Field Force Automation market share in 2025, while the Services segment is growing at a 16.8% CAGR as enterprises seek expertise to orchestrate change programs and domain-specific compliance. Platform vendors are embedding AI, IoT connectors, and low-code workflow builders, but implementation still demands process redesign, data migration, and user-adoption coaching. In healthcare, services teams navigate HIPAA audits, whereas utilities focus on outage-management playbooks. Over the forecast horizon, bundled managed-service contracts will dominate mid-market deals, locking in multi-year revenue streams. The trend underlines that software differentiation alone is insufficient; operational assurance and ongoing optimization now dictate renewal cycles.
Services engagements increasingly include predictive-maintenance setup, mobile UX tailoring, and cross-platform security hardening. Vendors augment core deployments with value-added analytics sprints that translate field telemetry into board-level KPIs. As a result, the Field Force Automation market size for professional services is expected to exceed USD 2.75 billion by 2031, reflecting a compound shift from license sales toward lifetime outcome partnerships. Talent scarcity in AI model-ops and cybersecurity further elevates services margins, creating a dual-flywheel where successful implementations trigger expansion modules and adjacent consulting work.


By Deployment: Cloud reshaping operating models
Cloud-hosted offerings captured 71.05% Field Force Automation market share in 2025 and continue to outpace on-premise at a 15.6% CAGR. Always-on connectivity, elastic scaling, and evergreen updates make SaaS platforms a default choice for geographically dispersed teams. Field supervisors gain real-time dashboards, while IT avoids asset refresh cycles. However, sovereign-cloud mandates in China and Russia force vendors to offer region-specific hosting or hybrid architectures.
On-premise remains entrenched in defense and financial-services accounts that require air-gapped environments. Hybrid models are rising as CIOs segment sensitive datasets behind the firewall while pushing scheduling and route optimization to the cloud. Across regions, migration roadmaps emphasize phased module adoption to mitigate change fatigue. Consequently, the Field Force Automation market size for hybrid-cloud deployments is projected to grow 13.6% annually, supported by containerized micro-services that ease workload portability.
By Enterprise Size: SMEs accelerate digital catch-up
Large Enterprises owned 59.05% of the Field Force Automation market in 2025, leveraging scale economies and multi-region fleets. Yet SMEs are expanding at an 17.9% CAGR, propelled by subscription pricing, app-store distribution, and industry-specific templates that slash configuration time. Vendors bundle CRM lite, invoicing, and GPS tracking into starter tiers that deliver tangible savings within one quarter. Over the forecast period, the cumulative Field Force Automation market size for SMEs is forecast to almost triple, narrowing capability gaps with incumbents and raising competitive parity.
SMEs prize rapid cash-flow benefits—fuel savings, faster invoicing, and fewer revisits—over advanced AI. Yet as familiarity grows, many graduate to predictive-maintenance add-ons and BI dashboards. This evolutionary path creates a pipeline of upsell opportunities for vendors that nurture customer-success programs. Meanwhile, large enterprises are standardizing global operating models, integrating field data with ERP, HR, and customer-experience stacks to unlock holistic efficiency gains.
By Platform: iOS builds enterprise momentum
Android delivered 56.70% share of the Field Force Automation market in 2025, driven by broad handset choice and competitive pricing. The platform’s openness appeals to system integrators seeking customized peripheral support—barcode scanners, thermal printers, rugged casings. However, iOS usage is climbing at 16.6% CAGR as sectors with high security and device-lifecycle demands gravitate to Apple’s controlled ecosystem. Healthcare organizations cite native endpoint encryption and reliable OS support windows as decisive factors.
Cross-platform web apps and progressive web applications are cushioning lock-in risks, permitting mixed-fleet deployments and easing BYOD policies. The Field Force Automation market size for iOS devices is projected to double by 2030, narrowing the gap with Android but unlikely to overturn leadership in price-sensitive industries. Windows tablets remain a niche for legacy SCADA and industrial protocols, but containerized runtimes are progressively decoupling application logic from hardware dependencies.
By Functionality: Inventory intelligence gains priority
Scheduling and Dispatch accounted for 25.20% of Field Force Automation market size in 2025 and continues to underpin ROI narratives. Generative-AI copilots suggest technician assignments, auto-fill job summaries, and recommend next-best actions, shortening planning cycles by up to 60%. Yet Inventory and Parts Management is advancing at 16.9% CAGR as supply-chain volatility exposes the cost of stock-outs and over-provisioning. Predictive algorithms flag parts demand based on IoT sensor alerts, while real-time transit visibility aligns reverse logistics with sustainability targets.
Route and Location Optimization now layers weather, customer availability, and carbon-emission scores into trip planning, supporting ESG disclosures. Work-Order Management integrates chatbots and self-service appointment portals, lifting customer NPS scores. Billing and Invoicing modules with mobile payment capture accelerate DSO metrics for cash-constrained SMEs. Collectively, these add-ons ensure that the Field Force Automation market remains a focal point for digital-operations investment.
By End-User Industry: Healthcare reshapes adoption curve
Transportation and Logistics retained 22.10% Field Force Automation market share in 2025 as parcel volumes and on-demand delivery models multiply scheduling complexity. DHL’s AI-based route optimization lifted stops per hour and trimmed fuel burn, illustrating tangible gains. Healthcare and Life Sciences, however, is expanding at 18.9% CAGR amid tele-health scaling, strict compliance, and aging-population-driven home-care demand. Salesforce’s Agentforce for Health encapsulates this vertical push, fusing CRM, scheduling, and remote-monitoring in a HIPAA-aligned package.
Manufacturing leverages 5G to enable augmented-reality troubleshooting, while IT and Telecom firms automate fiber rollouts and tower maintenance. Energy and Utilities embed outage-management and safety protocols, especially in grid-modernization programs. The oil-and-gas sector applies ruggedized tablets for compliance inspections in hazardous zones. Finally, construction and public-sector agencies treat mobile work-order apps as a backbone for real-time project oversight and emergency response.
Geography Analysis
North America contributed 37.45% of revenue in 2025, underpinned by high labor costs that sharpen automation economics and by regulatory deadlines like EVV that compel digital proof of service. Minnesota’s phased EVV rollout underscores how mandates create immediate modernization budgets . Manufacturing near-shoring is adding distributed plants that depend on seamless field-service coordination; more than 300,000 reshored jobs in 2022 enlarged the addressable fleet of technicians.
Asia Pacific is the fastest-growing region, forecast at 17.2% CAGR through 2031, buoyed by 5G saturation, government smart-factory incentives, and a swelling base of connected machinery. Somboon Advance Technology recorded a 60% earnings jump and 30% cost cut after adopting 5G-enabled field solutions in Thailand, exemplifying ROI potential. Yet regional diversity demands localization; India’s patchy connectivity spurs offline-first workflows, whereas Japan emphasizes stringent quality-control logs.
Europe balances steady Western adoption with a nascent Eastern pipeline. GDPR steers product roadmaps toward data-minimization and fine-grained consent. The Middle East and Africa region focuses on outage-management for grid-electrification and remote asset inspections in mining. South America gains momentum in Brazil and Argentina but wrestles with currency swings and ERP fragmentation that lengthen payback periods. Vendors increasingly structure risk-sharing contracts to unlock projects in economically volatile markets.


Competitive Landscape
The Field Force Automation market presents moderate fragmentation: global ERP suites (Salesforce, Oracle, SAP) vie with pure-play field-service firms (ServiceMax, ServicePower) and AI-centric start-ups. IFS’s 16 acquisitions—five directly in field-service software and averaging USD 368 million—signal consolidation designed to deepen vertical specialization and cross-sell advanced scheduling engines. Platform positioning now hinges on embedded AI that lifts first-time-fix rates and technician utilization, turning features into outcome-based value propositions.
White-space opportunities surround sustainability reporting, carbon-route scoring, and industry-specific compliance (e.g., aviation maintenance, medical-device servicing). SugarCRM’s 2025 leadership placement by Nucleus Research validates how continuous AI infusion sustains competitive momentum. Ecosystem integration strategies—open APIs, marketplace extensions, and low-code app builders—shape RFP scores as buyers seek to future-proof investments.
The battlefield is shifting from license growth to net-revenue-retention: vendors bundle prescriptive analytics, dedicated CS teams, and revenue-share models tied to productivity gains. As cyber-risk escalates, partnerships with managed-security providers become table stakes. Overall, the top five vendors control an estimated 45% of global spend, indicating moderate concentration that leaves ample room for niche innovators and regional champions.
Field Force Automation Industry Leaders
Oracle Corporation
Salesforce.com Inc.
SAP SE
IFS AB
ServiceMax, Inc. (PTC)
- *Disclaimer: Major Players sorted in no particular order

Recent Industry Developments
- May 2025: IgniteTech launched StreetSmart AI, combining job-assignment optimization, AR work instructions, and real-time analytics to trim administrative overhead and raise resource utilization.
- March 2025: SugarCRM was named a leader in the Nucleus Research Sales Force Automation Technology Value Matrix 2025, underscoring its AI-driven productivity enhancements.
- February 2025: Salesforce introduced Agentforce for Health, integrating advanced AI to elevate efficiency and care coordination in healthcare field operations.
- January 2025: APEC kicked off the USD 122,000 “5G Smart Manufacturing” project to bolster supply-chain resilience with 15–20% efficiency gains.


Global Field Force Automation Market Report Scope
Field Force Automation is the bi-directional flow of information between the head office and field via mobile technology – mobile devices, wearables, IoT sensors etc. The data is instantly recorded in the back-end, eliminating the time spent on manual data entry and the risk of errors associated with it.
The field force automation market is segmented by type (solution, services), by deployment (cloud, on-premises), by enterprise size (SMEs, large enterprises), by end-user (healthcare, IT and telecom, manufacturing, retail, transportation and logistics, energy and utilities, other end-users), by geography (North America, Europe, Asia-Pacific, Latin America, Middle East and Africa). the market sizes and forecasts are provided in terms of value (USD) for all the above segments.
| Software / Solution |
| Services |
| Cloud |
| On-Premise |
| Hybrid |
| Small and Medium-sized Enterprises (SMEs) |
| Large Enterprises |
| Android |
| iOS |
| Windows |
| Scheduling and Dispatch |
| Route and Location Optimisation |
| Work-Order Management |
| Inventory and Parts Management |
| Billing and Invoicing |
| Others |
| Healthcare and Life Sciences |
| IT and Telecom |
| Manufacturing |
| Retail and E-commerce |
| Transportation and Logistics |
| Energy and Utilities |
| Oil and Gas |
| Construction |
| Public Sector |
| Others |
| North America | United States |
| Canada | |
| Mexico | |
| South America | Brazil |
| Argentina | |
| Rest of South America | |
| Asia-Pacific | China |
| Japan | |
| India | |
| South Korea | |
| Southeast Asia | |
| Australia | |
| New Zealand | |
| Rest of Asia-Pacific | |
| Europe | United Kingdom |
| Germany | |
| France | |
| Italy | |
| Spain | |
| Nordics | |
| Rest of Europe | |
| Middle East and Africa | Middle East |
| Africa |
| By Component | Software / Solution | |
| Services | ||
| By Deployment | Cloud | |
| On-Premise | ||
| Hybrid | ||
| By Enterprise Size | Small and Medium-sized Enterprises (SMEs) | |
| Large Enterprises | ||
| By Platform | Android | |
| iOS | ||
| Windows | ||
| By Functionality | Scheduling and Dispatch | |
| Route and Location Optimisation | ||
| Work-Order Management | ||
| Inventory and Parts Management | ||
| Billing and Invoicing | ||
| Others | ||
| By End-User Industry | Healthcare and Life Sciences | |
| IT and Telecom | ||
| Manufacturing | ||
| Retail and E-commerce | ||
| Transportation and Logistics | ||
| Energy and Utilities | ||
| Oil and Gas | ||
| Construction | ||
| Public Sector | ||
| Others | ||
| By Geography | North America | United States |
| Canada | ||
| Mexico | ||
| South America | Brazil | |
| Argentina | ||
| Rest of South America | ||
| Asia-Pacific | China | |
| Japan | ||
| India | ||
| South Korea | ||
| Southeast Asia | ||
| Australia | ||
| New Zealand | ||
| Rest of Asia-Pacific | ||
| Europe | United Kingdom | |
| Germany | ||
| France | ||
| Italy | ||
| Spain | ||
| Nordics | ||
| Rest of Europe | ||
| Middle East and Africa | Middle East | |
| Africa | ||


Key Questions Answered in the Report
What is the current value of the Field Force Automation market?
The market was valued at USD 4.76 billion in 2026 and is projected to hit USD 10.07 billion by 2031, expanding at a 16.15% CAGR.
Which region grows fastest in Field Force Automation adoption?
Asia Pacific leads growth with a forecast 17.2% CAGR, driven by 5G infrastructure and smart-manufacturing initiatives.
Why are services outpacing software in growth?
Organizations need specialized integration, change management, and regulatory expertise, pushing services to a 16.8% CAGR versus core software.
How do EVV mandates influence market demand?
US EVV regulations require digital proof of home-care visits, accelerating mobile-app deployment and fostering broader field-service transformations.
Page last updated on:


