Europe NMC Battery Pack Market Size and Share
Market Overview
| Study Period | 2020 - 2031 |
|---|---|
| Forecast Data Period | 2026 - 2031 |
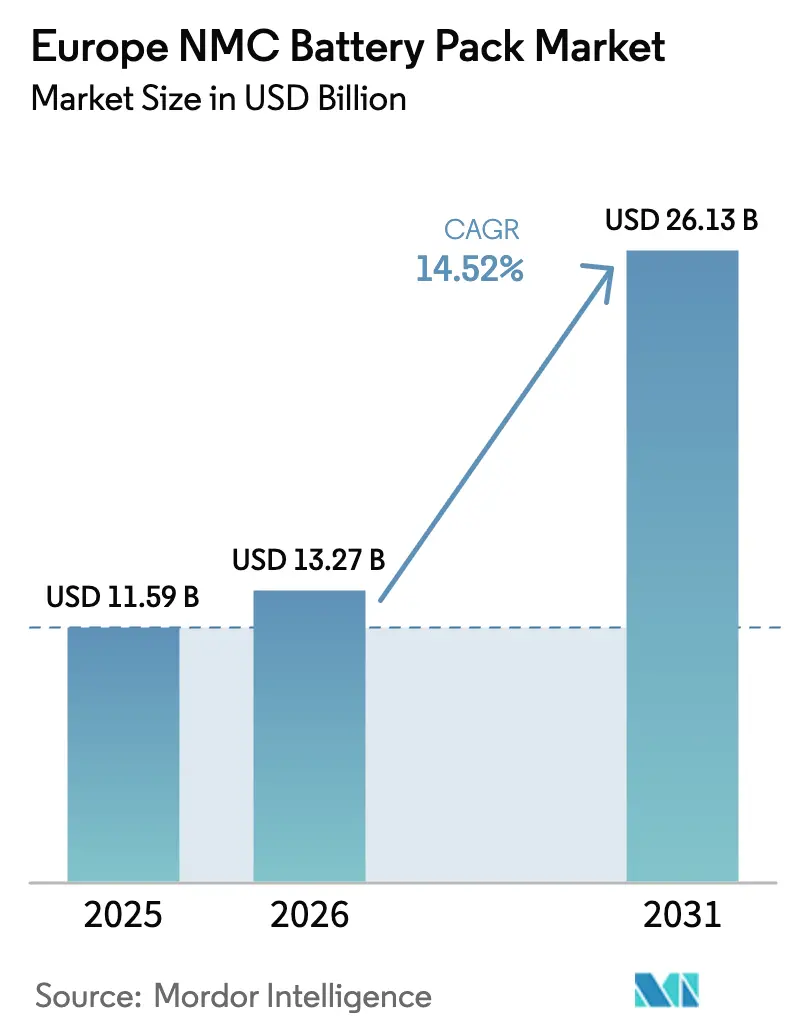
| Base Year Market Size (2025) | USD 11.59 Billion |
| Market Size (2026) | USD 13.27 Billion |
| Market Size (2031) | USD 26.13 Billion |
| Growth Rate (2026 - 2031) | 14.52% CAGR |
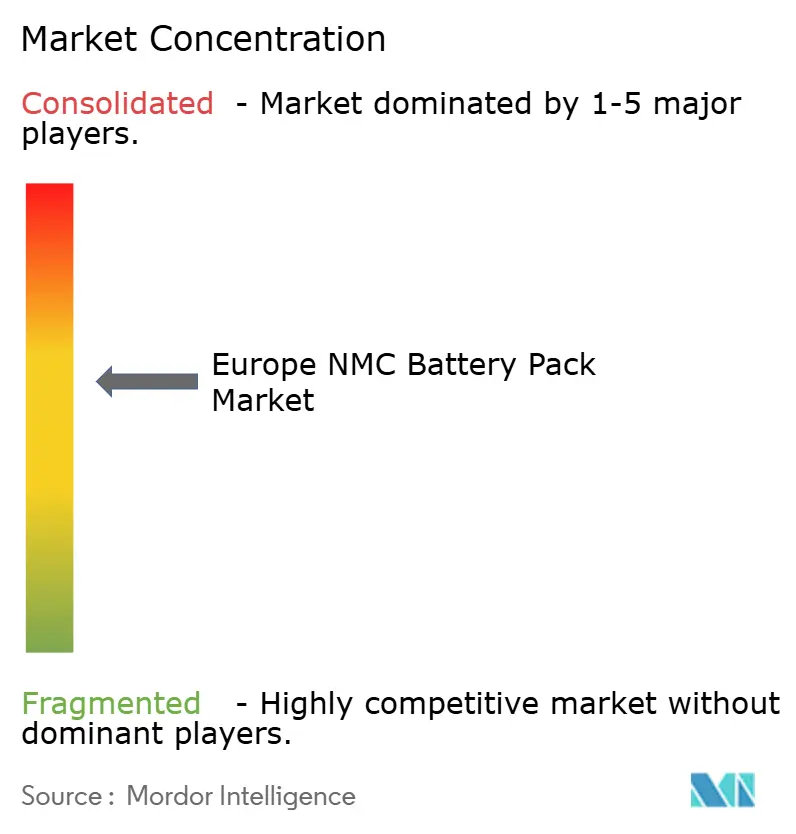
| Market Concentration | Medium |
Major Players *Disclaimer: Major Players sorted in no particular order Image © Mordor Intelligence. Reuse requires attribution under CC BY 4.0. | |
Europe NMC Battery Pack Market Analysis by Mordor Intelligence
The Europe NMC battery pack market size is expected to grow from USD 11.59 billion in 2025 to USD 13.27 billion in 2026 and is forecast to reach USD 26.13 billion by 2031 at 14.52% CAGR over 2026-2031. This upswing is fueled by the Fit-for-55 mandate, record gigafactory investments, and the rapid adoption of more than 400 V architectures that underpin fast-charging passenger car launches. Tight CO₂ targets have made high-energy-density NMC chemistries a compliance necessity, while emerging local-content incentives intensify the pull for domestic battery production hubs. Supply-chain attention has shifted from cobalt scarcity to nickel and lithium price swings, prompting OEMs and pack integrators to secure long-term offtake contracts. Finally, second-life revenue streams in stationary storage provide a cushion against raw material volatility and help sustain profitability across the value chain.
Key Report Takeaways
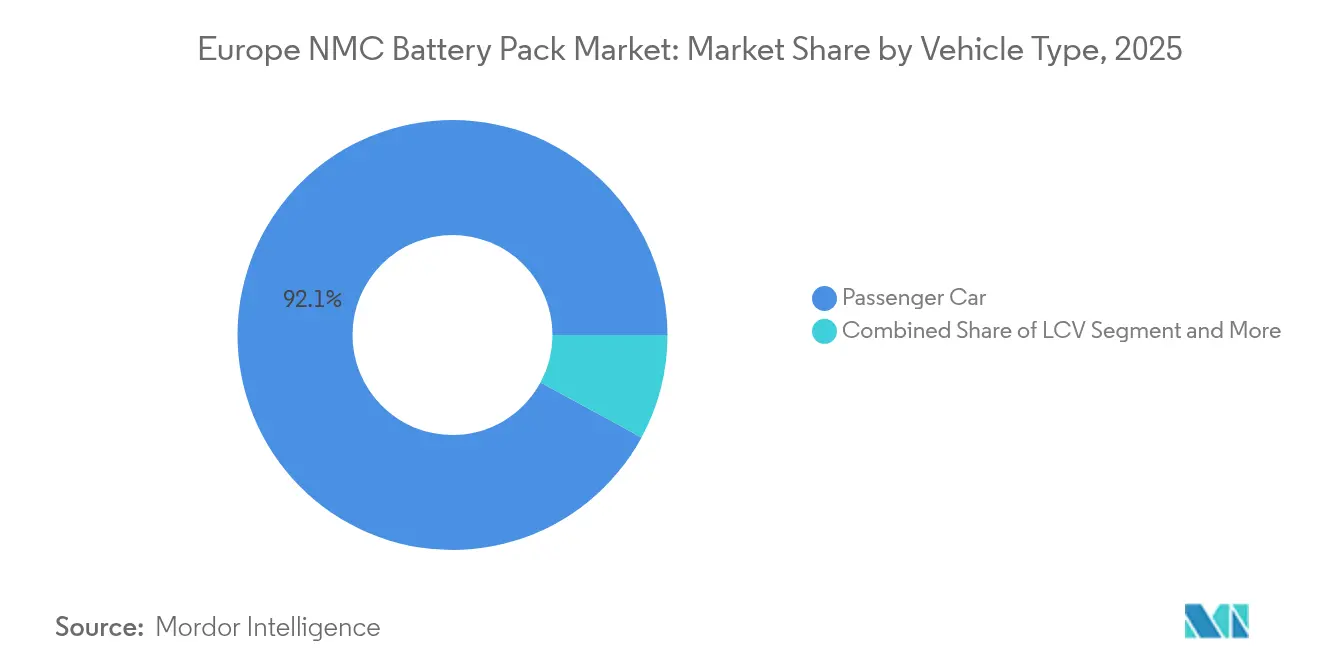
- By vehicle type, passenger cars led with 92.10% of Europe NMC battery pack market share in 2025, whereas medium and heavy-duty trucks show the fastest 24.12% CAGR through 2031.
- By propulsion type, BEVs captured 83.70% share of the Europe NMC battery pack market size in 2025, and this segment is projected to rise at 18.95% CAGR.
- By material, NMC 622 held 41.90% share in 2025; NMC 811 is on course for an 17.98% CAGR as suppliers pursue cobalt-lean chemistries.
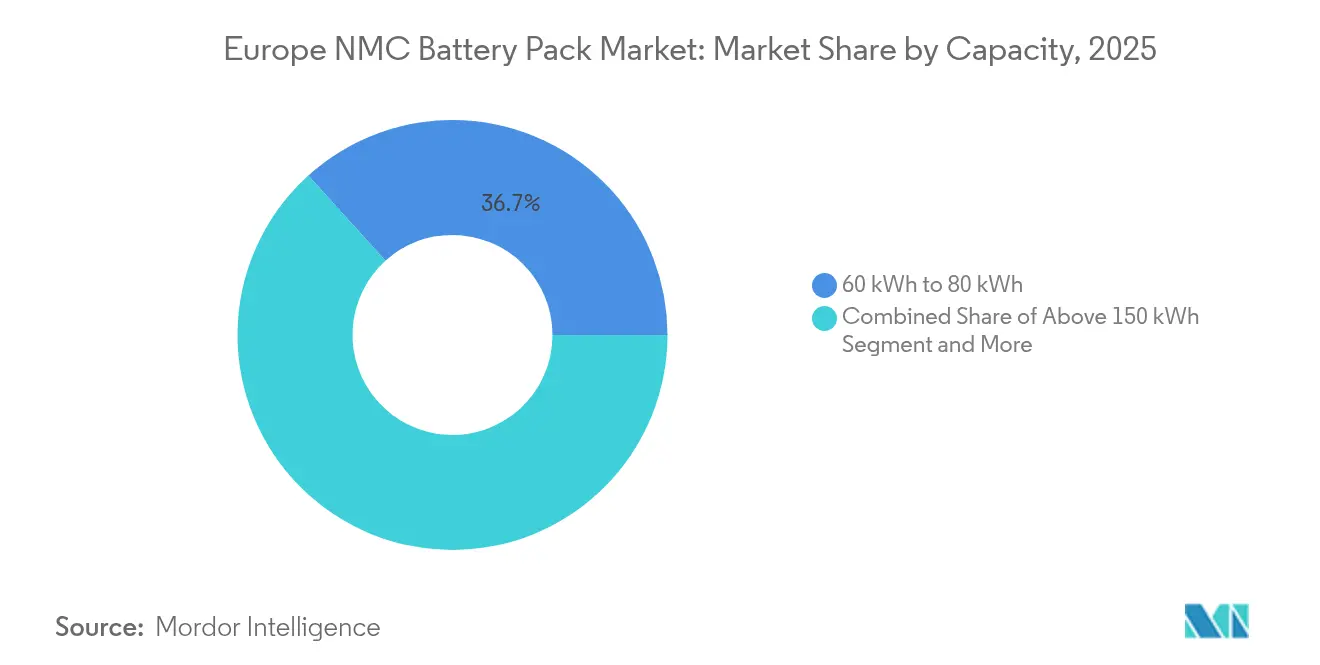
- By capacity, packs rated 60 to 80 kWh held 36.70% share in 2025, while the packs above 150 kWh will expand at a 14.78% CAGR.
- By battery form, prismatic cells accounted for 48.70% share in 2025, whereas cylindrical formats will expand at a 16.22% CAGR by 2031.
- By voltage class, 400-600 V packs commanded 64.70% share in 2025; the above 800 V category is advancing at 15.89% CAGR.
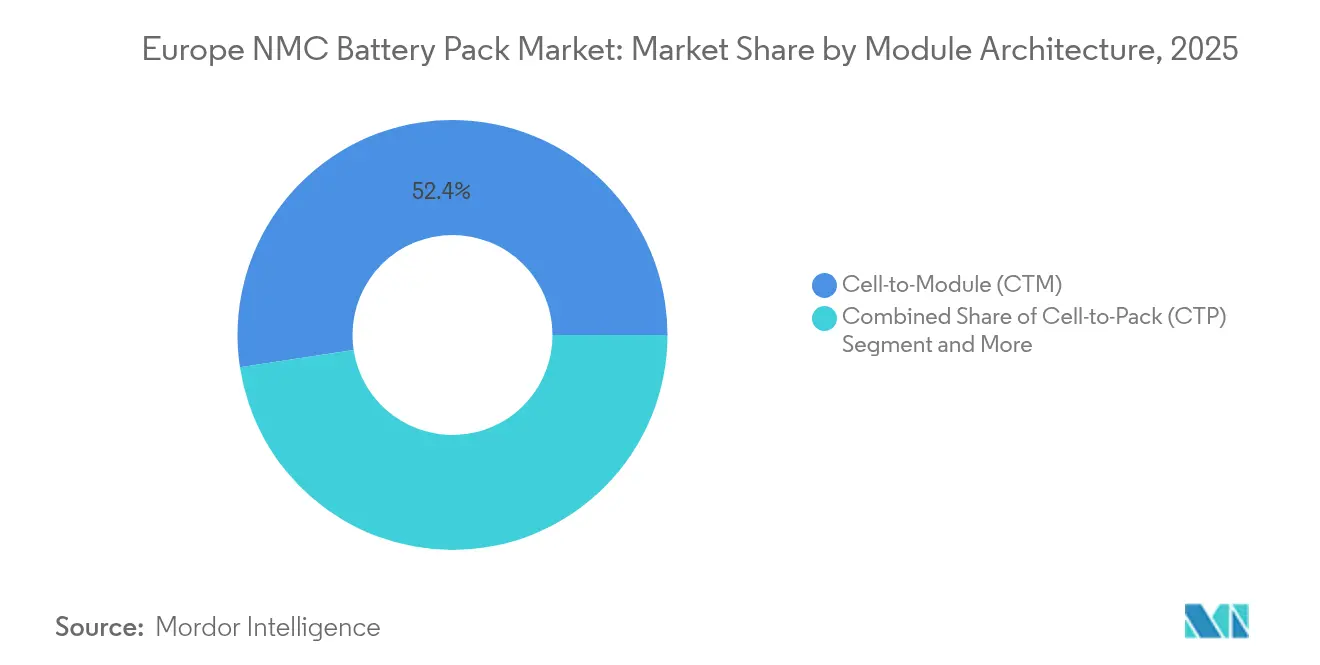
- By module architecture, cell-to-module (CTM) accounted for 52.40% share in 2025, while cell-to-pack (CTP) designs are expanding at 16.72% CAGR.
- By component, cathode captured 49.60% share of the Europe NMC battery pack market size in 2025, and this segment is projected to rise at 15.06% CAGR.
- By country, Poland dominated with 46.10% share in 2025, while Hungary is poised for a 29.41% CAGR to 2031.
Note: Market size and forecast figures in this report are generated using Mordor Intelligence’s proprietary estimation framework, updated with the latest available data and insights as of 2026.
Europe NMC Battery Pack Market Trends and Insights
Drivers Impact Analysis*
| Driver | (~) % Impact on CAGR Forecast | Geographic Relevance | Impact Timeline |
|---|---|---|---|
| EU Fit-for-55 Targets | +3.2% | EU-wide, strongest in Germany, France, Italy | Medium term (2-4 years) |
| European Gigafactories Scale-Up | +2.8% | Northern and Central Europe, Poland, Hungary | Long term (≥4 years) |
| IRA-Style Local-Content Rules | +2.4% | United Kingdom and EU manufacturing hubs | Long term (≥4 years) |
| OEM Shift to Architectures | +2.1% | Premium segments across EU, early move in Germany and Sweden | Short term (≤2 years) |
| Reduced Pack-Level Cobalt Content | +1.9% | EU cost advantage | Medium term (2-4 years) |
| Second-Life Storage Revenue | +1.6% | Grid-intensive regions: Germany, Denmark, Netherlands | Medium term (2-4 years) |
| Source: Mordor Intelligence | |||


EU Fit-for-55 CO₂ Targets Accelerating OEM Battery Demand
Europe’s 55% fleet-wide CO₂ reduction target for passenger cars by 2030 has prompted every volume OEM to accelerate capital investment toward electrification [1]“Fit-for-55: Delivering the EU Green Deal,” European Commission, ec.europa.eu. Average new-car emissions increased in 2024, underscoring the need to incorporate higher-capacity NMC packs that achieve a 600 km range on the WLTP cycle. Stellantis and Volkswagen now expect BEVs to increase their European sales mix by 2030, effectively locking in multi-year demand visibility for 80 kWh battery systems. Premium makers with higher baseline emissions face steeper penalties, giving pack suppliers with demonstrated competence in 400-600 V greater pricing leverage. As a result, the European NMC battery pack market is on a structurally firm demand footing through the decade.
Rapid Scale-Up of European Gigafactories (Northvolt, ACC, Verkor)
A significant number of committed cell investments are reshaping the continent, featuring Northvolt’s 60 GWh Heide plant and ACC’s multi-country network backed by debt financing [2]“Northvolt Receives €900 Million German Aid,” Clean Energy Wire, cleanenergywire.org. Verkor’s Dunkirk facility, financed through a package led by the European Investment Bank, will feed Renault. Yet, there are concerns that a significant portion of the publicized pipeline might not materialize, signaling potential execution challenges for smaller players. For the Europe NMC battery pack market, partial realization still expands regional cell output versus 2024 and eases the logistics burden tied to Asian imports.
IRA-Style Local-Content Rules in United Kingdom and EU Post-2027
Reflecting the benefits of the United States IRA, the European Commission introduces a substantial initiative, while the United Kingdom unveils its Advanced Manufacturing Plan, both linking subsidies to the domestic battery value chain. Rules of origin complexities pose compliance costs, but they also erect barriers to low-cost Asian imports. Consequently, multinational cell makers, including LG Energy Solution and Samsung SDI, have accelerated Polish and Hungarian expansions to protect share in the Europe NMC battery pack market.
OEM Shift to ≥ 400 V/800 V Architectures for Fast-Charging
Automotive OEMs upgrading to 800V packs can slash charge times to a few minutes, thereby elevating consumer acceptance. The European Alternative Fuels Infrastructure Regulation mandates 400 kW chargers every 60 km by 2025, further propelling demand for high-voltage designs. Suppliers able to certify more than 800 V systems under UN ECE R100 enjoy a differentiator, yet must absorb longer homologation cycles. In turn, the Europe NMC battery pack market rewards firms investing in advanced thermal and insulation solutions that tame higher voltage stresses.
Restraints Impact Analysis*
| Restraint | (~) % Impact on CAGR Forecast | Geographic Relevance | Impact Timeline |
|---|---|---|---|
| Nickel and Lithium Volatility | -1.8% | EU manufacturing costs | Short term (≤2 years) |
| Recycling Capacity Lagging | -1.4% | EU-wide, focus Germany and France | Long term (≥4 years) |
| Slow Homologation Above 800 V Packs | -1.2% | EU regulatory approval | Medium term (2-4 years) |
| Rising ESG Scrutiny Intermediates | -0.9% | EU compliance | Medium term (2-4 years) |
| Source: Mordor Intelligence | |||
Nickel and Lithium Supply–Demand Volatility Through 2027
Nickel prices fluctuated significantly in 2024 amid changes in Indonesian exports and geopolitical uncertainty surrounding Russian supply. Lithium carbonate has fallen from its 2022 peaks, yet it still carries a margin of risk for pack makers that rely on spot procurement. With raw materials accounting for a significant share of cell costs, volatility hinders profitability in the European NMC battery pack market until new Finnish and German refining projects come online.
Recycling Capacity Lagging Pack Scrap Generation After 2028
Europe's recycling capacity is significantly lower than the projected waste volume by 2030. Northvolt’s 125,000 t plant is the largest, yet a continental shortfall of looms, exposing OEMs to costly export or landfill routes. This bottleneck clouds the sustainability narrative that underpins the Europe NMC battery pack market.
*Our forecasts treat driver/restraint impacts as directional, not additive. The impact forecasts reflect baseline growth, mix effects, and variable interactions.
Segment Analysis
By Vehicle Type: Commercial Segments Drive Future Growth
Passenger cars held a 92.10% share of the Europe NMC battery pack market in 2025, while medium and heavy-duty trucks are expected to expand at a 24.12% CAGR. The EU's heavy-vehicle CO₂ rule will force a significant reduction by 2030, thereby escalating demand for 300 kWh packs in regional haulage fleets. Light commercial vans benefit from e-commerce, while city-bus operators in Germany and France deploy zero-emission units to meet municipal targets.
Large-capacity trucks spur design changes—such as liquid cooling, robust housing, and high-cycle durability—that few suppliers can deliver at scale. Passenger-car volumes still anchor the Europe NMC battery pack market, but differentiated truck specs open profitable niches for integrators with chemistry and pack-engineering versatility.


By Propulsion Type: BEV Dominance Accelerates
BEVs captured 83.70% share of the Europe NMC battery pack market size in 2025, and the segment is set to advance at 18.95% CAGR as Euro 7 rules raise PHEV costs. Average BEV pack capacity climbed in 2024, amplifying cell demand across the continent.
PHEV packs of 10-20 kWh remain in fleet-compliance niches, yet their share erodes as OEMs bring forward 2030 ICE phase-out dates. The Europe NMC battery pack market thus skews toward higher-energy designs, favoring suppliers with proven thermal management and fast-charge validation.
By Material: High-Nickel Transition Gains Momentum
NMC 622 dominated at 41.90% in 2025, but NMC 811 is on course for an 17.98% CAGR as cobalt prices and ESG pressure steer chemistry roadmaps. The Europe NMC battery pack market size for NMC 811 is projected to rise sharply once Northvolt and CATL complete dedicated high-nickel lines.
Higher nickel content delivers significant range gains yet demands precise moisture control and ceramic coating during cell assembly. Firms lacking such expertise may stay on NMC 622, risking share loss in premium BEV contracts.
By Capacity: Premium Segments Drive Size Expansion
The 60-80 kWh band held 36.70% Europe NMC battery pack market share in 2025 as it matches range expectations for premium SUVs. Packs above 150 kWh are gaining at 14.78% CAGR on luxury sedans and long-haul truck entries.
Larger packs require sandwich cooling plates, low-impedance busbars, and robust crash structures. Suppliers that master these features secure higher ASPs, reinforcing revenue concentration within the Europe NMC battery pack market.
By Battery Form: Prismatic Leadership Faces Cylindrical Challenge
Prismatic cells controlled 48.70% in 2025 because European automakers value packing efficiency. Cylindrical formats, catalyzed by Tesla’s Berlin 4680 line, are expanding at 16.22% CAGR.
Cylindrical lines achieve faster takt times and simpler scaling, while pouch architectures serve niche shapes in sports cars. Flexible factories able to shift across form factors will outperform single-format specialists inside the Europe NMC battery pack industry.
By Voltage Class: High-Voltage Transition Accelerates
The 400-600 V class held 64.70% of the Europe NMC battery pack market in 2025, yet above 800 V packs grow at 15.89% CAGR as OEMs chase sub-20-minute charging.
Component libraries, including IGBTs and ceramic capacitors, must be upgraded to withstand higher voltage stress, raising the bill-of-materials cost. Suppliers with component partnerships mitigate this hurdle and gain early-adopter OEM contracts.
By Module Architecture: CTP Innovation Challenges Traditional CTM
Cell-to-Module (CTM) remained the standard at a 52.40% share in 2025, but Cell-to-Pack (CTP) variants logged a 16.72% CAGR within the European NMC battery pack market. Eliminating module casings yield energy-density gains.
CTP adoption compresses supplier tiers, favoring vertically integrated players that own cell, structure, and BMS IP. Module-only specialists must pivot to offering added-value services, such as rapid prototyping, to stay relevant.
By Component: Cathode Dominance Reflects Value Concentration
Cathodes absorbed 49.60% of the pack value in 2025 and are expected to advance at a 15.06% CAGR, underscoring their leverage on chemistry and cost. Europe aims to increase its cathode demand domestically over the coming years, yet only two plants were operational in 2024.
Vertical integration moves from precursor to finished cathode, defines strategic differentiation and margin capture in the Europe NMC battery pack market.
Geography Analysis
Poland’s 46.10% share underscores its appeal to Asian investors, who prize low operating costs and proximity to German OEMs. The LG Energy Solution and SK bolster the European NMC battery pack market size in Poland On complexes near Wrocław, which are expected to exceed 50 GWh once fully ramped. Hungary follows with a 29.41% CAGR as CATL erects a Debrecen site, complemented by Samsung SDI’s expansion in Göd.
Germany remains the continent’s automotive anchor, pairing domestic pack demand with Northvolt’s Heide project backed in state aid. France strengthens supply security through ACC’s Billy-Berclau plant and Verkor’s Dunkirk gigafactory, both of which tap into French funding. Italy’s Termoli project complements ACC’s tri-national footprint, although timeline clarity remains uncertain.
The United Kingdom, navigating post-Brexit rules, concentrates incentives under its Advanced Manufacturing Plan to secure domestic cell capacity for Nissan and Jaguar Land Rover. Sweden’s Skellefteå campus, powered by hydro-electricity, supplies “green” cells to the broader European NMC battery pack market. Spain and the Czech Republic court future investments tied to Stellantis-CATL joint ventures, solidifying a pan-European mosaic that mitigates geopolitical risk and shortens supply chains.
Competitive Landscape
The Europe NMC battery pack market shows moderate concentration. CATL, LG Energy Solution, and Samsung SDI safeguard lead positions by combining proven yield learning curves with aggressive European capacity build-outs. ACC, and Verkor tap public financing and sustainability branding to chip at Asian dominance.
Technology leadership hinges on high-nickel chemistries, 800 V architectures, and CTP designs that eliminate modules to gain energy density. Northvolt’s closed-loop recycling and renewable-power sourcing offer OEMs carbon-footprint benefits, while ACC’s tri-country presence helps mitigate supply-chain shocks.
Strategic moves include CATL-BMW joint development of Qilin packs, LG Energy Solution’s long-term procurement deal with Stellantis, and Northvolt-Volvo’s Novo Energy plant in Sweden, each securing multi-year cell offtake and bolstering ecosystem resilience[3]“Novo Energy Construction Start,” Northvolt, northvolt.com. Suppliers threading vertical integration from cathode to pack gain cost control and quality assurance, reinforcing their share prospects within the Europe NMC battery pack industry.
Europe NMC Battery Pack Industry Leaders
LG Energy Solution, Ltd.
Contemporary Amperex Technology Co., Limited (CATL)
Samsung SDI Co., Ltd.
ACC (Automotive Cells Company SE)
Groupe Renault
- *Disclaimer: Major Players sorted in no particular order

Recent Industry Developments
- December 2024: Automotive Cells Company revealed plans for fresh debt to fund the second production block at its northern France gigafactory, targeting higher NMC output even as broader EV demand softened.
- March 2024: Novo Energy, a Northvolt–Volvo Cars venture, broke ground on its Gothenburg plant to supply high-performance prismatic NMC cells for next-generation EVs.


Europe NMC Battery Pack Market Report Scope
Bus, LCV, M&HDT, Passenger Car are covered as segments by Body Type. BEV, PHEV are covered as segments by Propulsion Type. 15 kWh to 40 kWh, 40 kWh to 80 kWh, Above 80 kWh, Less than 15 kWh are covered as segments by Capacity. Cylindrical, Pouch, Prismatic are covered as segments by Battery Form. Laser, Wire are covered as segments by Method. Anode, Cathode, Electrolyte, Separator are covered as segments by Component. Cobalt, Lithium, Manganese, Natural Graphite, Nickel are covered as segments by Material Type. France, Germany, Hungary, Italy, Poland, Sweden, UK, Rest-of-Europe are covered as segments by Country.| Passenger Car |
| LCV (Light Commercial Vehicle) |
| Medium and Heavy-Duty Truck |
| Bus |
| BEV (Battery Electric Vehicle) |
| PHEV (Plug-in Hybrid Electric Vehicle) |
| 111 |
| 523 |
| 622 |
| 712 |
| 811 |
| Less than 15 kWh |
| 15 kWh to 40 kWh |
| 40 kWh to 60 kWh |
| 60 kWh to 80 kWh |
| 80 kWh to 100 kWh |
| 100 kWh to 150 kWh |
| Above 150 kWh |
| Cylindrical |
| Pouch |
| Prismatic |
| Below 400 V (48-350 V) |
| 400-600 V |
| 600-800 V |
| Above 800 V |
| Cell-to-Module (CTM) |
| Cell-to-Pack (CTP) |
| Module-to-Pack (MTP) |
| Anode |
| Cathode |
| Electrolyte |
| Separator |
| France |
| Germany |
| Hungary |
| Italy |
| Poland |
| Sweden |
| United Kingdom |
| Rest of Europe |
| By Vehicle Type | Passenger Car |
| LCV (Light Commercial Vehicle) | |
| Medium and Heavy-Duty Truck | |
| Bus | |
| By Propulsion Type | BEV (Battery Electric Vehicle) |
| PHEV (Plug-in Hybrid Electric Vehicle) | |
| By Material | 111 |
| 523 | |
| 622 | |
| 712 | |
| 811 | |
| By Capacity | Less than 15 kWh |
| 15 kWh to 40 kWh | |
| 40 kWh to 60 kWh | |
| 60 kWh to 80 kWh | |
| 80 kWh to 100 kWh | |
| 100 kWh to 150 kWh | |
| Above 150 kWh | |
| By Battery Form | Cylindrical |
| Pouch | |
| Prismatic | |
| By Voltage Class | Below 400 V (48-350 V) |
| 400-600 V | |
| 600-800 V | |
| Above 800 V | |
| By Module Architecture | Cell-to-Module (CTM) |
| Cell-to-Pack (CTP) | |
| Module-to-Pack (MTP) | |
| By Component | Anode |
| Cathode | |
| Electrolyte | |
| Separator | |
| By Country | France |
| Germany | |
| Hungary | |
| Italy | |
| Poland | |
| Sweden | |
| United Kingdom | |
| Rest of Europe |


Market Definition
- Battery Chemistry - NCM battery type is considred under the scope of battery chemistry.
- Battery Form - The types of battery forms offered under this segment include Cylindrical, Pouch and Prismatic.
- Body Type - Body types considered under this segment include, passenger cars, LCV (light commercial vehicle), M&HDT (medium & heavy duty trucks)and buses.
- Capacity - Various types of battery capacities inldude under theis segment are 15 kWH to 40 kWH, 40 kWh to 80 kWh, Above 80 kWh and Less than 15 kWh.
- Component - Various components covered under this segment include anode, cathode, electrolyte, separator.
- Material Type - Various material covered under this segment include cobalt, lithium, manganese, natural graphite, nickel, other material.
- Method - The types of method covered under this segment include laser and wire.
- Propulsion Type - Propulsion types considered under this segment include BEV (Battery electric vehicles), PHEV (plug-in hybrid electric vehicle).
- ToC Type - ToC 4
- Vehicle Type - Vehicle type considered under this segment include passenger vehicles, and commercial vehicles with various EV powertrains.
| Keyword | Definition |
|---|---|
| Electric vehicle (EV) | A vehicle which uses one or more electric motors for propulsion. Includes cars, buses, and trucks. This term includes all-electric vehicles or battery electric vehicles and plug-in hybrid electric vehicles. |
| PEV | A plug-in electric vehicle is an electric vehicle that can be externally charged and generally includes all electric vehicles as well as plug-electric vehicles as well as plug-in hybrids. |
| Battery-as-a-Service | A business model in which the battery of an EV can be rented from a service provider or swapped with another battery when it runs out of charge |
| Battery Cell | The basic unit of an electric vehicle's battery pack, typically a lithium-ion cell, that stores electrical energy. |
| Module | A subsection of an EV battery pack, consisting of several cells grouped together, often used to facilitate manufacturing and maintenance. |
| Battery Management System (BMS) | An electronic system that manages a rechargeable battery by protecting the battery from operating outside its safe operating area, monitoring its state, calculating secondary data, reporting data, controlling its environment, and balancing it. |
| Energy Density | A measure of how much energy a battery cell can store in a given volume, usually expressed in watt-hours per liter (Wh/L). |
| Power Density | The rate at which energy can be delivered by the battery, often measured in watts per kilogram (W/kg). |
| Cycle Life | The number of complete charge-discharge cycles a battery can perform before its capacity falls under a specified percentage of its original capacity. |
| State of Charge (SOC) | A measurement, expressed as a percentage, that represents the current level of charge in a battery compared to its capacity. |
| State of Health (SOH) | An indicator of the overall condition of a battery, reflecting its current performance compared to when it was new. |
| Thermal Management System | A system designed to maintain optimal operating temperatures for an EV's battery pack, often using cooling or heating methods. |
| Fast Charging | A method of charging an EV battery at a much faster rate than standard charging, typically requiring specialized charging equipment. |
| Regenerative Braking | A system in electric and hybrid vehicles that recovers energy normally lost during braking and stores it in the battery. |


Research Methodology
Mordor Intelligence follows a four-step methodology in all its reports.
- Step-1: Identify Key Variables: To build a robust forecasting methodology, the variables and factors identified in Step-1 are tested against available historical market numbers. Through an iterative process, the variables required for market forecast are set and the model is built based on these variables.
- Step-2: Build a Market Model: Market-size estimations for the historical and forecast years have been provided in revenue and volume terms. Market revenue is calculated by multiplying the volume demand with volume-weighted average battery pack price (per kWh). Battery pack price estimation and forecast takes into account various factors affecting ASP, such as inflation rates, market demand shifts, production costs, technological developments, and consumer preferences, providing estimations for both historical data and future trends.
- Step-3: Validate and Finalize: In this important step, all market numbers, variables, and analyst calls are validated through an extensive network of primary research experts from the market studied. The respondents are selected across levels and functions to generate a holistic picture of the market studied.
- Step-4: Research Outputs: Syndicated Reports, Custom Consulting Assignments, Databases & Subscription Platforms


