
E-Commerce Reverse Logistics Market Size and Share
Market Overview
| Study Period | 2020 - 2031 |
|---|---|
| Market Size (2026) | USD 144.47 Billion |
| Market Size (2031) | USD 276.35 Billion |
| Growth Rate (2026 - 2031) | 13.85 % |
| Fastest Growing Market | Asia-Pacific |
| Largest Market | Asia-Pacific |
| Market Concentration | Low |
Major Players *Disclaimer: Major Players sorted in no particular order Image © Mordor Intelligence. Reuse requires attribution under CC BY 4.0. | |
E-Commerce Reverse Logistics Market Analysis by Mordor Intelligence
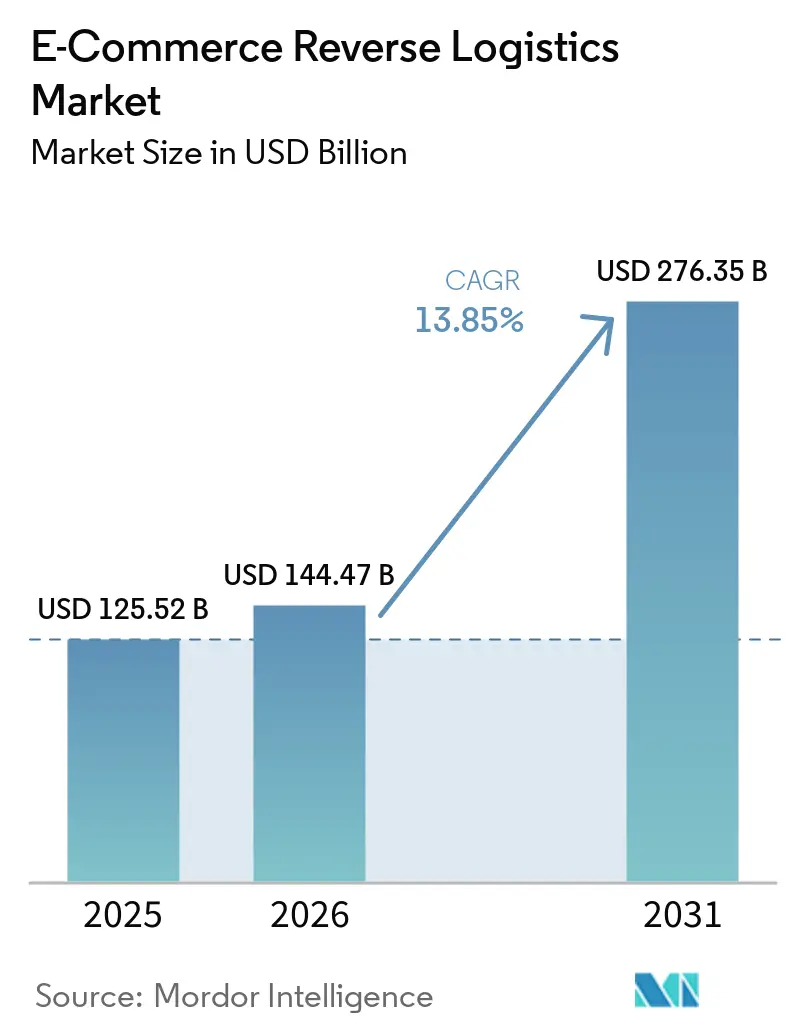
The e-commerce reverse logistics market size was valued at USD 125.52 billion in 2025 and is estimated to grow from USD 144.47 billion to reach USD 276.35 billion by 2031, growing at a CAGR of 13.85% between 2026 and 2031.
Rising online order volumes are enlarging the pool of goods that retailers, carriers, and brands need to collect, inspect, restock, resell, recycle, or dispose of. The United States retail e-commerce sales reached USD 340.2 billion in the second quarter of 2026 and represented 17.1% of total retail sales, which continued to place pressure on return-processing capacity. The National Retail Federation put the United States merchandise returns at USD 849.9 billion in 2025, while online purchases had a 15.8% return rate.[1] The e-commerce reverse logistics market is, therefore, becoming more closely tied to retail margin management, customer retention, fraud control, and regulatory compliance. Operators are prioritizing dense drop-off networks, faster refunds, condition-based routing, and systems that help determine the most suitable destination for each returned item.
Key Report Takeaways
- By return type, commercial returns held 38.60% of the e-commerce reverse logistics market share in 2025, while end-of-life returns recorded the highest projected CAGR at 15.60% through 2031.
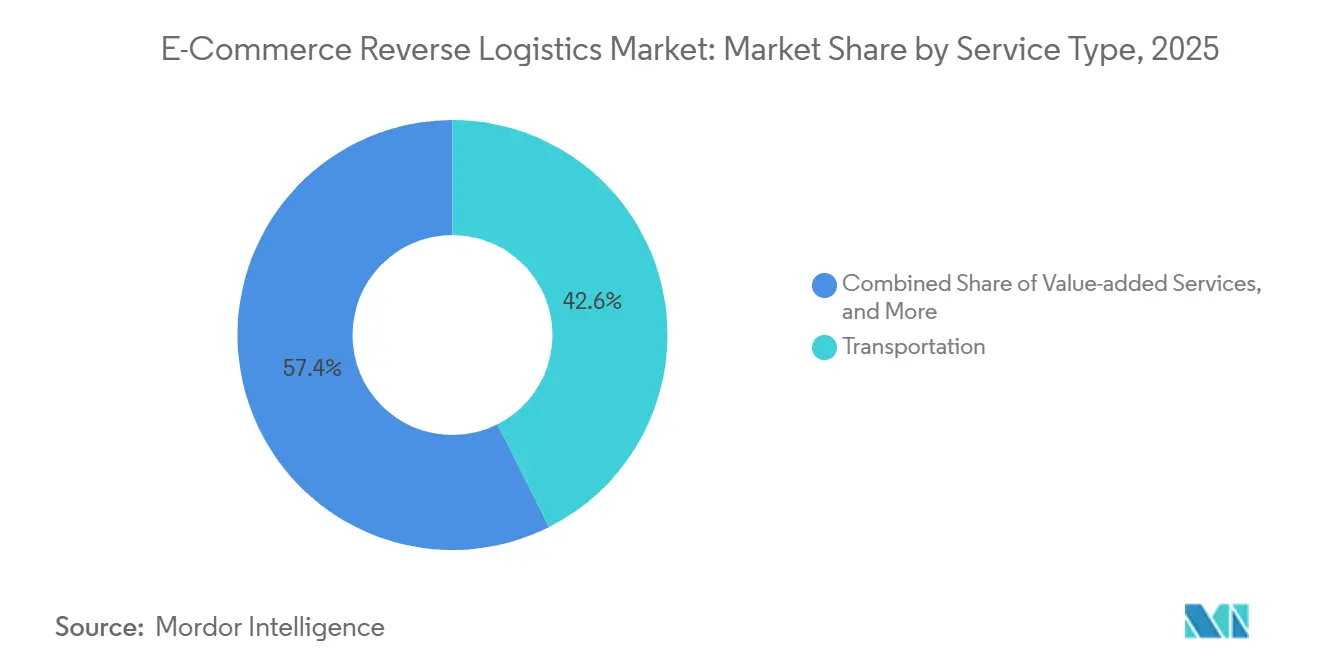
- By service type, transportation held 42.55% of the e-commerce reverse logistics market share in 2025, while value-added services recorded the highest projected CAGR at 15.72% through 2031.
- By product category, fashion and apparel held 27.15% of the e-commerce reverse logistics market size in 2025, while luxury goods recorded the highest projected CAGR at 14.95% through 2031.
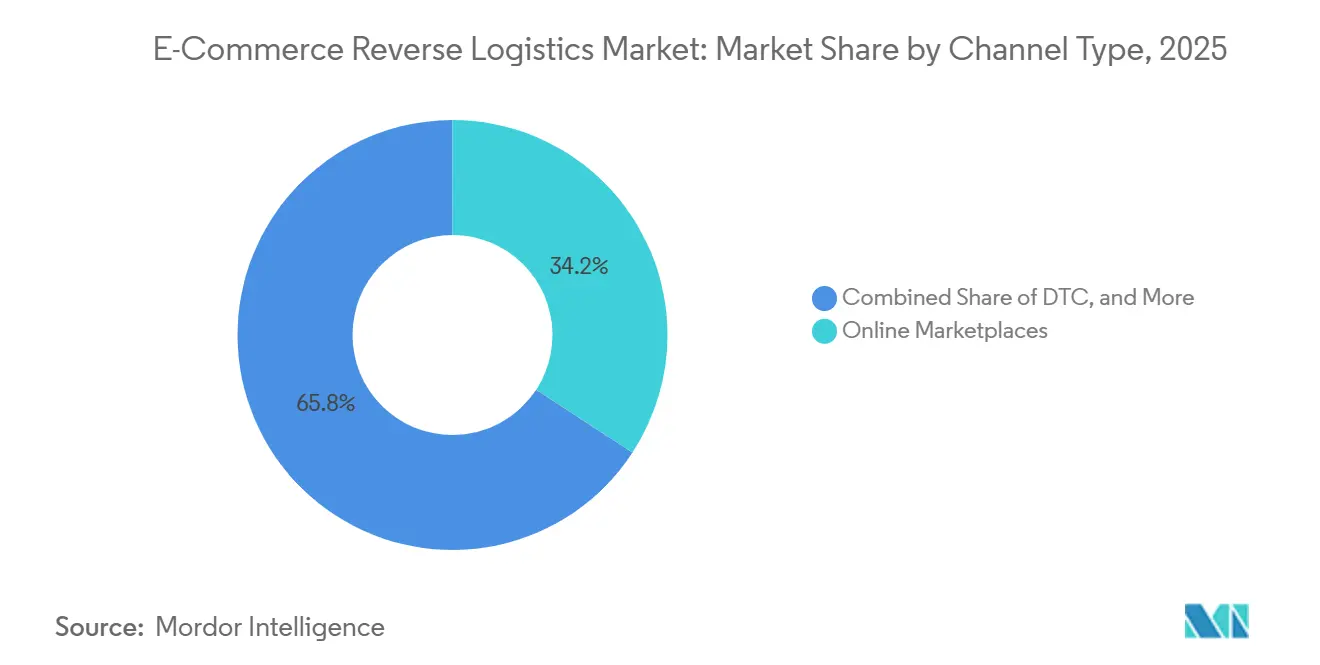
- By channel type, online marketplaces held 34.20% of the e-commerce reverse logistics market share in 2025, while social commerce recorded the highest projected CAGR at 15.85% through 2031.
- By geography, Asia-Pacific held 35.50% of the e-commerce reverse logistics market size in 2025 and recorded the highest projected CAGR at 15.51% through 2031.
Note: Market size and forecast figures in this report are generated using Mordor Intelligence’s proprietary estimation framework, updated with the latest available data and insights as of January 2026.
Global E-Commerce Reverse Logistics Market Trends and Insights
Drivers Impact Analysis*
| Driver | (~) % Impact on CAGR Forecast | Geographic Relevance | Impact Timeline |
|---|---|---|---|
| Rising E-Commerce Order Volumes | +3.5% | Global, most pronounced in Asia-Pacific, North America, and Western Europe | Short term (≤ 2 years) |
| Customer Expectations for Frictionless Returns | +2.8% | Global, highest urgency in North America and the EU, emerging across Asia-Pacific | Short term (≤ 2 years) |
| Circular-Economy and Extended Producer Responsibility Requirements | +2.0% | EU core, with spillover to North America, Australia, and East Asia | Medium term (2-4 years) |
| Predictive Analytics and Automated Returns Decisioning | +1.8% | North America and the EU as early adopters, with Asia-Pacific scaling rapidly | Medium term (2-4 years) |
| Cross-Border Return Consolidation | +1.5% | Asia-Pacific, the EU-UK corridor, and North America-Latin America lanes | Medium term (2-4 years) |
| Product-Level Return Identity and Data Portability | +0.8% | EU mandate through ESPR, with early voluntary adoption in North America | Long term (≥ 4 years) |
| Source: Mordor Intelligence | |||
Rising E-Commerce Order Volumes
The United States retail e-commerce sales grew 12.2% year-over-year in the second quarter of 2026 and reached USD 340.2 billion.[2] These sales represented 17.1% of total retail sales of the United States, sustaining a larger flow of goods that may later enter return channels. Each expansion in online purchasing increases the physical volume that needs collection, transportation, inspection, and disposition. The e-commerce reverse logistics market gains from this volume effect because online orders generally create more return activity than purchases completed in stores. Mobile-led shopping and social discovery purchases also make product assessment more difficult before delivery. Providers are responding by increasing processing capacity near major customer clusters and by linking carrier events with warehouse decisions.
Customer Expectations for Frictionless Returns
Convenient return methods have become an important part of how consumers judge online sellers and third-party return services. The National Retail Federation reported that close to two-thirds of online shoppers acknowledged at least 1 damaging return behavior, including wardrobing and bracketing. Box-free and label-free returns can reduce consumer effort and shorten the time between a return request and a refund decision. The e-commerce reverse logistics market benefits when retailers use accessible drop-off points because consolidation can reduce individual pickup activity. The same convenience can increase unnecessary return behavior when policy rules and product verification are weak. Retailers are balancing simpler customer journeys with item checks, customer history reviews, and clearer policy controls.
Circular Economy and Extended Producer Responsibility Requirements
The Packaging and Packaging Waste Regulation entered into force in February 2025 and set harmonized rules for packaging and waste management in the European Union. Directive 2025/1892, adopted in September 2025, extended producer responsibility requirements for textiles and footwear across EU member states. The Digital Product Passport Registry launched in July 2026, creating infrastructure for accessible product-level lifecycle data through scannable identifiers.[3] These measures increase the need for documented collection, sorting, reuse, recycling, and end-of-life processing. The e-commerce reverse logistics market has a larger role where brands need proof that returned products reached an authorized destination. Providers with traceable workflows can support producer obligations while reducing the risk that usable products move into uncontrolled disposal channels.
Predictive Analytics and Automated Returns Decisioning
Condition-based routing allows a returned item to be directed toward restocking, resale, donation, repair, recycling, or disposal. This approach moves key decisions earlier in the return process rather than waiting until a product reaches a warehouse. The e-commerce reverse logistics market is gaining value from systems that connect product condition, demand signals, carrier data, and available recovery channels. Loop Returns introduced its Intelligent Disposition engine in March 2026 for routing returned items using real-time secondary-market pricing information. Early routing can reduce unnecessary transport and limit the time that returned inventory remains unavailable for sale. It also requires reliable data capture at the drop-off point and consistent handling standards across the carrier network.
Restraints Impact Analysis*
| Restraint | (~) % Impact on CAGR Forecast | Geographic Relevance | Impact Timeline |
|---|---|---|---|
| High Cost of Reverse Transportation and Handling | -1.6% | Global, most acute in North America and the EU for low-value categories | Short term (≤ 2 years) |
| Fragmented Recycling and Recovery Infrastructure | -0.9% | Emerging markets in Asia-Pacific, Middle East and Africa, and South America, with a secondary effect in the EU | Long term (≥ 4 years) |
| Returns Fraud, Wardrobing and Product Substitution | -0.8% | Global, with the highest incidence in North America and growth in Asia-Pacific | Short term (≤ 2 years) |
| Cross-Border Customs, Tax and Compliance Complexity | -0.7% | EU-UK corridor, United States-Latin America lanes, and intra-ASEAN flows | Medium term (2-4 years) |
| Source: Mordor Intelligence | |||
High Cost of Reverse Transportation and Handling
Reverse transportation and handling remain difficult because products move from many households to a smaller number of processing sites. Each item can require pickup or drop-off acceptance, inspection, condition grading, relabeling, and a separate disposition decision. The e-commerce reverse logistics market faces particular pressure in low-value categories where return costs can consume much of the original order margin. The National Retail Federation found that transportation cost escalation and carrier rate increases were among the top 2 reasons retailers introduced return fees in 2025, cited by 40% of merchants. Multi-brand consolidation can improve load density, but it depends on enough nearby drop-off locations and compatible sorting processes. Smaller operators can struggle to achieve the scale needed to make reverse freight and handling economical.
Returns Fraud, Wardrobing, and Product Substitution
Returns fraud includes policy abuse, label tampering, product substitution, and repeated return activity that does not meet the seller's stated conditions. Appriss Retail reported USD 100 billion in preventable returns-related losses for the United States retailers in 2025. The National Retail Federation also reported that close to two-thirds of online shoppers admitted to at least 1 damaging return practice. The e-commerce reverse logistics market requires verification processes that determine whether the correct product was returned and whether its condition supports resale or refund. These checks add handling time and cost, particularly in fashion, footwear, and electronics. Product identity data and strong documentation can make fraud controls more consistent, although providers still need trained staff and clear retailer rules.
*Our forecasts treat driver/restraint impacts as directional, not additive. The impact forecasts reflect baseline growth, mix effects, and variable interactions.
Segment Analysis
By Return Type: Commercial Returns Anchors Volume as End-of-Life Scales
Commercial returns held 38.60% of the e-commerce reverse logistics market share in 2025. The segment remained the largest because marketplace exchanges and standard online return policies create frequent, repeatable reverse flows. Both B2C and B2B buyers contribute to this activity when goods are exchanged, rejected, or returned under contractual arrangements. Commercial return programs favor operators that can process high volumes with predictable service levels. The e-commerce reverse logistics market remains dependent on consistent intake rules when retailers manage a broad mix of return reasons. Repairable returns are important in consumer electronics and home appliances, where refurbishment can extend a product's useful life. End-of-use returns also support brand programs that retrieve products after their primary use period. Recall returns remain smaller in volume but require fast network response, specialized handling, and detailed regulatory documentation. The broad mix of return reasons means providers need different routing rules for ordinary exchanges, repair candidates, and safety-related retrievals.
End-of-life returns are forecast to grow at a CAGR of 15.60% through 2031. This growth reflects extended producer responsibility rules that place collection and recovery obligations on producers. Directive 2025/1892 extended these requirements to textile and footwear producers across EU member states.[4] The e-commerce reverse logistics market size for this segment grows as informal disposal flows move into recorded collection and recovery processes. Brands need partners that can document the movement of end-of-life products and separate reuse candidates from material recovery. Collection points, sorting capability, and certified downstream channels become more important where producer responsibility rules apply. Operators with existing recovery relationships can offer a more complete service to brands. Those without collection capacity may face a weaker position when customers require evidence of compliant disposition.
By Service Type: Value Added Services Outpaces, Transportation as the Margin Driver
Transportation held 42.55% of the e-commerce reverse logistics market size in 2025. Every returned product needs at least 1 carrier or collection touchpoint, making transportation the physical base of the service chain. Carriers collect parcels from households, accept them at drop-off sites, and move them to consolidation or processing locations. Network density affects both consumer convenience and the cost per returned item. The e-commerce reverse logistics market depends on this physical layer even as software improves return authorization and product tracking. Transportation providers also generate tracking events that can trigger refund approvals and warehouse planning. The service remains essential even where retailers use in-store return options because goods often need onward movement. High volume does not automatically create high margins because reverse routes are less predictable than outbound delivery routes. Providers are, therefore, seeking denser collection networks and better consolidation before linehaul movements begin.
Value-added services are forecast to grow at a CAGR of 15.72% through 2031. These services include refurbishment, resale support, condition-graded routing, and brand-specific recovery workflows. They are important because an item can have a different economic outcome depending on how quickly and accurately it is assessed. The e-commerce reverse logistics market gains value when a product is restored to inventory or directed to the most suitable recovery channel without avoidable delay. Retailers in fashion and electronics are placing more weight on recovered value per unit when selecting service providers. Condition grading, authentication, repair coordination, and connections to secondary marketplaces support this objective. Warehousing and processing remain important because they provide the space and operational control required before an item can reenter inventory. The strongest service combinations connect transport visibility with processing decisions and clear reporting for the retailer.

By Product Category: Fashion Defines the Core While Luxury Redefines the Premium Return
Fashion and apparel held 27.15% of the e-commerce reverse logistics market share in 2025. The category leads because fit, style, size, and product presentation can only be assessed fully after delivery. The National Retail Federation cited structural online return rates of 25% to 30% for apparel and up to 40% for footwear. The e-commerce reverse logistics market needs detailed apparel inspection because wearable products can no longer move directly back into inventory after every return. Fashion returns often require inspection for wear, packaging condition, tags, and signs of wear before restock decisions are made. Consumer Electronics and Home and Living also contribute significant volumes. Electronics require data security checks and detailed condition assessment, while home products can create handling issues because of their size and varied packaging. Grocery, health and wellness, and beauty and personal care face hygiene and safety limits that can make centralized recovery difficult. These categories may rely more heavily on local disposal, in-store credits, or restricted return policies.
Luxury goods registered at a CAGR of 14.95% through 2031. Luxury returns demand a more controlled process because authentication, condition certification, and brand presentation can affect resale value. The e-commerce reverse logistics market supports this category through dedicated pathways that protect pricing and limit unauthorized diversion. Stronger resale activity creates a need to verify product provenance before an item is returned to the primary channel or offered through a secondary outlet. Each handling step needs to preserve chain-of-custody information and avoid damage to packaging or the product itself. Automotive parts and accessories also create technically demanding returns, often linked to warranty, defects, or incorrect fitment. Part-level traceability is important in these cases because manufacturers need evidence for quality reviews and supplier accountability. Providers that can manage authentication and traceability are better positioned in categories where product value and product history are both material.
By Channel Type: Online Marketplaces Lead Volume While Social Commerce Sets Growth Pace
Online marketplaces held 34.20% of the e-commerce reverse logistics market size in 2025. Marketplace models concentrate buyer activity, seller participation, and return policy administration on the same platform. This scale can generate high volumes of exchanges and refunds across a broad range of product categories. Marketplace operators need consistent return processes because sellers may use different fulfillment methods and have different inventory locations. The e-commerce reverse logistics market has a central role in helping platforms maintain customer trust while controlling the operational burden on individual sellers. DTC Websites generally have lower return rates because brands can provide more detailed product information and retain control over policy design. Mobile apps increase transaction activity but do not reduce the need for clear return instructions or reliable tracking. The channel mix favors providers that can support both platform-wide rules and brand-specific exceptions.
Social commerce registered at a CAGR of 15.85% through 2031. The channel creates a distinct return requirement because purchases can be influenced by short-form content, creator promotion, and rapid checkout decisions. Dedicated carrier arrangements show that the e-commerce reverse logistics market is adapting to the different return behavior associated with social selling. Retailers need simple handoff options because social commerce customers often expect a return process that is as quick as the original purchase. Fraud detection is also important because high-volume, low-friction programs can attract policy abuse. Channel-specific returns services can help platforms maintain confidence among buyers and sellers while reducing the administrative burden on smaller merchants.
Geography Analysis
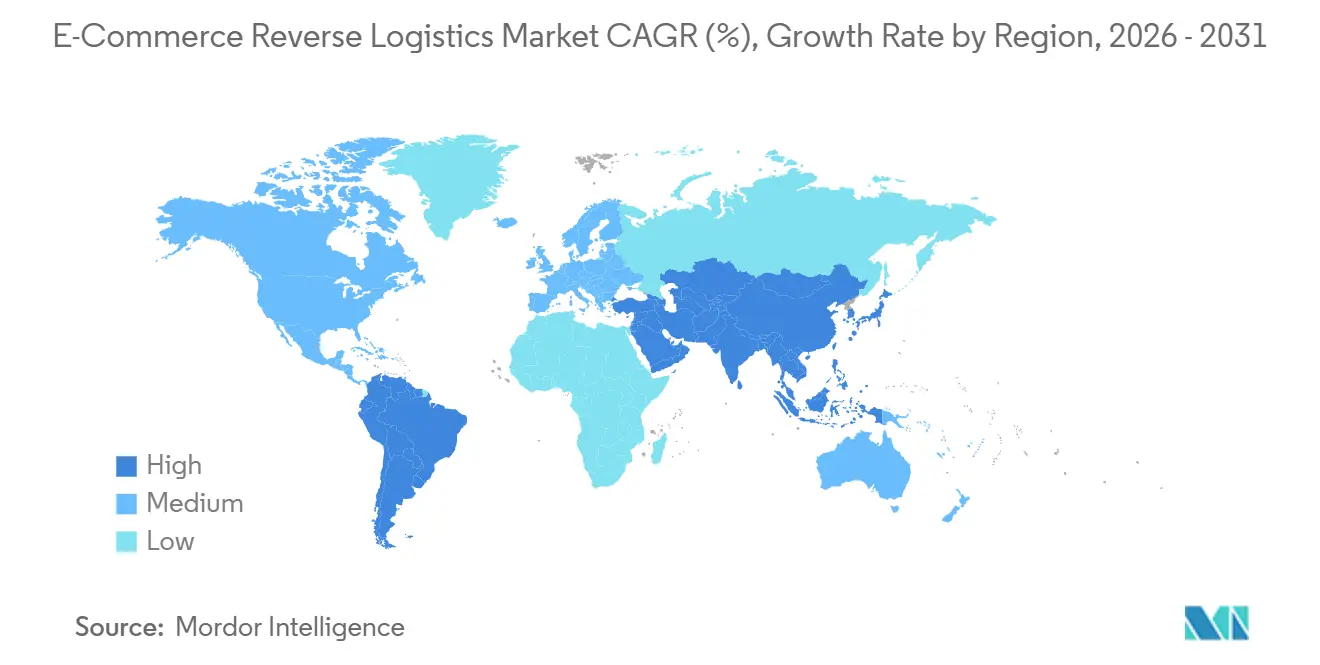
Asia-Pacific held 35.50% of the e-commerce reverse logistics market share in 2025 and is forecast to grow at a CAGR of 15.51% through 2031. The region leads because of its large online retail base and the expansion of digital retail across China, India, and Southeast Asia, while China accounted for 39% of national retail sales through e-commerce in 2026. The scale of online activity creates demand for dedicated collection, sorting, and transport capacity, and India and Southeast Asia are adding online buyers faster than many reverse networks are becoming mature. Nippon Express launched NX Return Plus in March 2026 to manage transportation, packaging procurement, and scheduling for device collection returns across Japan. Australia also offers favorable conditions for consolidated drop-off networks because e-commerce demand is concentrated in major urban areas.
North America is the second-largest regional market and relies increasingly on an aggregated, drop-off-based return infrastructure. The United States e-commerce sales grew 12.2% year-over-year in the second quarter of 2026, which sustained demand for return processing and transportation services. The region has a large base of established retailers, carriers, parcel networks, and technology platforms, while Canada and Mexico remain secondary markets with important cross-border flows. DHL eCommerce and the United States Postal Service announced a multi-year exclusive agreement in May 2026 worth more than USD 10 billion for last-mile parcel delivery across 170 million delivery points. The United States Customs and Border Protection changes, effective October 2026, add compliance requirements to cross-border e-commerce flows.
Europe is defined by regulations that are shaping return collection, product data, and end-of-life disposition, including the Packaging and Packaging Waste Regulation, Directive 2025/1892, and the July 2026 launch of the Digital Product Passport Registry. Germany, the United Kingdom, France, and the Nordic countries account for much of the region's e-commerce return activity. GEODIS launched a dedicated reverse logistics service at its Torija, Spain, site in April 2025, including capacity for large product returns. South America, the Middle East, and Africa offer longer-term growth potential, with Brazil leading South America through its expanding digital consumer base.
Competitive Landscape
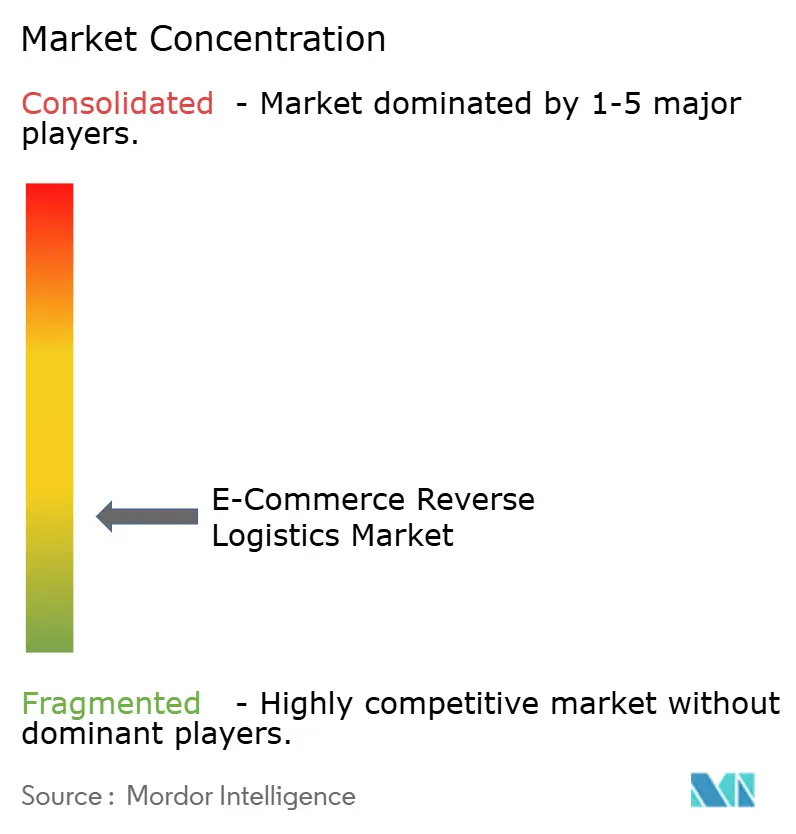
The e-commerce reverse logistics market is fragmented, with integrated logistics groups competing alongside specialized returns technology platforms. Large providers offer carrier capacity, warehouses, cross-border services, and broader supply chain relationships, while specialist platforms compete through retailer-facing software, multi-carrier routing, return portals, fraud controls, and disposition decisions. The e-commerce reverse logistics market also has room for mid-sized technology providers serving brands with 500 to 5,000 daily returns. These brands may prefer flexible routing platforms over full-service third-party logistics agreements. The e-commerce reverse logistics industry, therefore, includes large network operators and focused software providers with different routes to customer value.
Acquisitions remained an important route to broader capability. DSV completed its acquisition of DB Schenker in May 2025 for EUR 15.3 billion (USD 15.7 billion), creating a third-party logistics network across more than 90 countries. CMA CGM agreed in July 2026 to acquire FedEx Supply Chain for USD 1.4 billion through CEVA Logistics, adding nearly 150 North American warehouses. Blue Yonder acquired Optoro in August 2025 and acquired full ownership of Inmar Post-Purchase Solutions in June 2025 through its Doddle subsidiary, extending its returns management, inventory remarketing, and drop-off capabilities. These moves show how software and logistics companies are extending their reach beyond a single returns function.
Regulatory readiness is becoming a competitive factor in the e-commerce reverse logistics market because brands increasingly need documented evidence of recycling, reuse, or compliant end-of-life treatment. Firms that combine collection capacity with product-level data may be better placed to serve regulated categories under the EU policy framework. GEODIS launched 2 complementary returns solutions for its Americas customers in June 2025, covering return request automation and warehouse disposition optimization GEODIS. NYK Group expanded Yusen Logistics' European healthcare logistics capabilities through its acquisition of the Walden Group healthcare logistics business in December 2025.
E-Commerce Reverse Logistics Industry Leaders
-
DHL Group
-
DSV A/S
-
CMA CGM Group
-
FedEx
-
United Parcel Service of America, Inc. (UPS)
- *Disclaimer: Major Players sorted in no particular order
Recent Industry Developments
- September 2026: UPS entered an agreement with TikTok Shop to provide no-box, no-label returns for United States sellers through its Happy Returns subsidiary, leveraging nearly 10,000 Return Bar locations inside Ulta Beauty, Staples, and UPS stores. The deal targets the fast-growing social commerce channel and incorporates automated fraud detection to flag and quarantine suspicious return packages.
- September 2026: GEODIS, Auchan Retail, and SEQUENCE ROBOTICS deployed a robotic returns sorting solution at Villabe, France, using 30 autonomous mobile robots capable of sorting 2,300 consumer units per hour for returned cultural products from Auchan hypermarkets.
- May 2026: DHL eCommerce and the United States Postal Service signed a multi-year exclusive contract for the United States last-mile parcel delivery valued at more than USD 10 billion, the largest agreement in their 25-year relationship with DHL handling pickup, sorting, and linehaul and USPS completing the final mile across 170 million delivery points.
- April 2026: UPS and Happy Returns expanded the Return Bar network to 10,000 United States drop-off locations, adding more than 1,700 sites through new partnerships with Annex Brands and Package Hub Business Centers, making the network more than three times the size of the next-largest alternative.
Global E-Commerce Reverse Logistics Market Report Scope
| Commercial Returns |
| Repairable Returns |
| End-of-Use Returns |
| End-of-Life Returns |
| Recall Returns |
| Transportation |
| Warehousing and Storage |
| Returns Processing |
| Value Added Services |
| Fashion and Apparel |
| Consumer Electronics |
| Beauty and Personal Care |
| Home and Living |
| Grocery and Fast-Moving Consumer Goods |
| Health and Wellness Products |
| Automotive Parts and Accessories |
| Luxury Goods |
| Other Product Categories |
| DTC (Direct-to-Consumer) Websites |
| Online Marketplaces |
| Social Commerce |
| Mobile Apps |
| Others |
| North America | United States |
| Canada | |
| Mexico | |
| South America | Brazil |
| Argentina | |
| Peru | |
| Chile | |
| Rest of South America | |
| Europe | Germany |
| United Kingdom | |
| France | |
| Italy | |
| Spain | |
| Russia | |
| Nordics (Denmark, Finland, Iceland, Norway, and Sweden) | |
| Rest of Europe | |
| Asia-Pacific | China |
| India | |
| Japan | |
| South Korea | |
| Australia | |
| Southeast Asia (ASEAN) | |
| Rest of Asia-Pacific | |
| Middle East and Africa | Saudi Arabia |
| United Arab Emirates | |
| Qatar | |
| South Africa | |
| Nigeria | |
| Egypt | |
| Rest of Middle East and Africa |
| By Return Type | Commercial Returns | |
| Repairable Returns | ||
| End-of-Use Returns | ||
| End-of-Life Returns | ||
| Recall Returns | ||
| By Service Type | Transportation | |
| Warehousing and Storage | ||
| Returns Processing | ||
| Value Added Services | ||
| By Product Category | Fashion and Apparel | |
| Consumer Electronics | ||
| Beauty and Personal Care | ||
| Home and Living | ||
| Grocery and Fast-Moving Consumer Goods | ||
| Health and Wellness Products | ||
| Automotive Parts and Accessories | ||
| Luxury Goods | ||
| Other Product Categories | ||
| By Channel Type | DTC (Direct-to-Consumer) Websites | |
| Online Marketplaces | ||
| Social Commerce | ||
| Mobile Apps | ||
| Others | ||
| By Geography | North America | United States |
| Canada | ||
| Mexico | ||
| South America | Brazil | |
| Argentina | ||
| Peru | ||
| Chile | ||
| Rest of South America | ||
| Europe | Germany | |
| United Kingdom | ||
| France | ||
| Italy | ||
| Spain | ||
| Russia | ||
| Nordics (Denmark, Finland, Iceland, Norway, and Sweden) | ||
| Rest of Europe | ||
| Asia-Pacific | China | |
| India | ||
| Japan | ||
| South Korea | ||
| Australia | ||
| Southeast Asia (ASEAN) | ||
| Rest of Asia-Pacific | ||
| Middle East and Africa | Saudi Arabia | |
| United Arab Emirates | ||
| Qatar | ||
| South Africa | ||
| Nigeria | ||
| Egypt | ||
| Rest of Middle East and Africa | ||
Key Questions Answered in the Report
What is the size of the e-commerce reverse logistics market?
The e-commerce reverse logistics market reached USD 125.52 billion in 2025 and is forecast to reach USD 276.35 billion by 2031 at a CAGR of 13.85%.
Which return type has the largest share?
Commercial returns held 38.60% share in 2025, supported by recurring exchange and marketplace return activity.
Which service is growing fastest in reverse logistics?
Value-added services is forecast to grow at a CAGR of 15.72% through 2031, supported by refurbishment, resale, and condition-based routing.
Why are fashion returns important for logistics providers?
Fashion and apparel held 27.15% share in 2025, while online apparel return rates were 25% to 30% and footwear rates reached up to 40%.
Which region leads global reverse logistics demand?
Asia-Pacific held 35.50% share in 2025 and is forecast to grow at a CAGR of 15.51% through 2031.
How do producer responsibility rules affect returns operations?
EU requirements for packaging, textiles, footwear, and product-level information increase the need for documented collection, recovery, and end-of-life handling.