Market Overview
| Study Period | 2021 - 2031 |
|---|---|
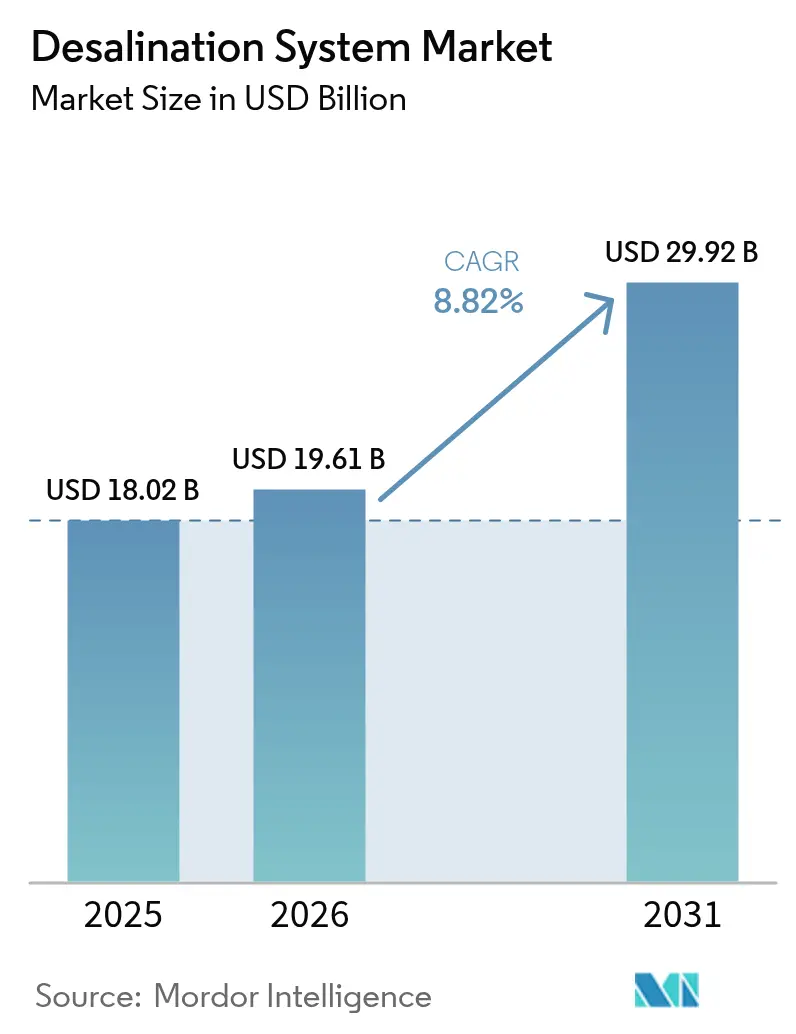
| Market Size (2026) | USD 19.61 Billion |
| Market Size (2031) | USD 29.92 Billion |
| Growth Rate (2026 - 2031) | 8.82% CAGR |
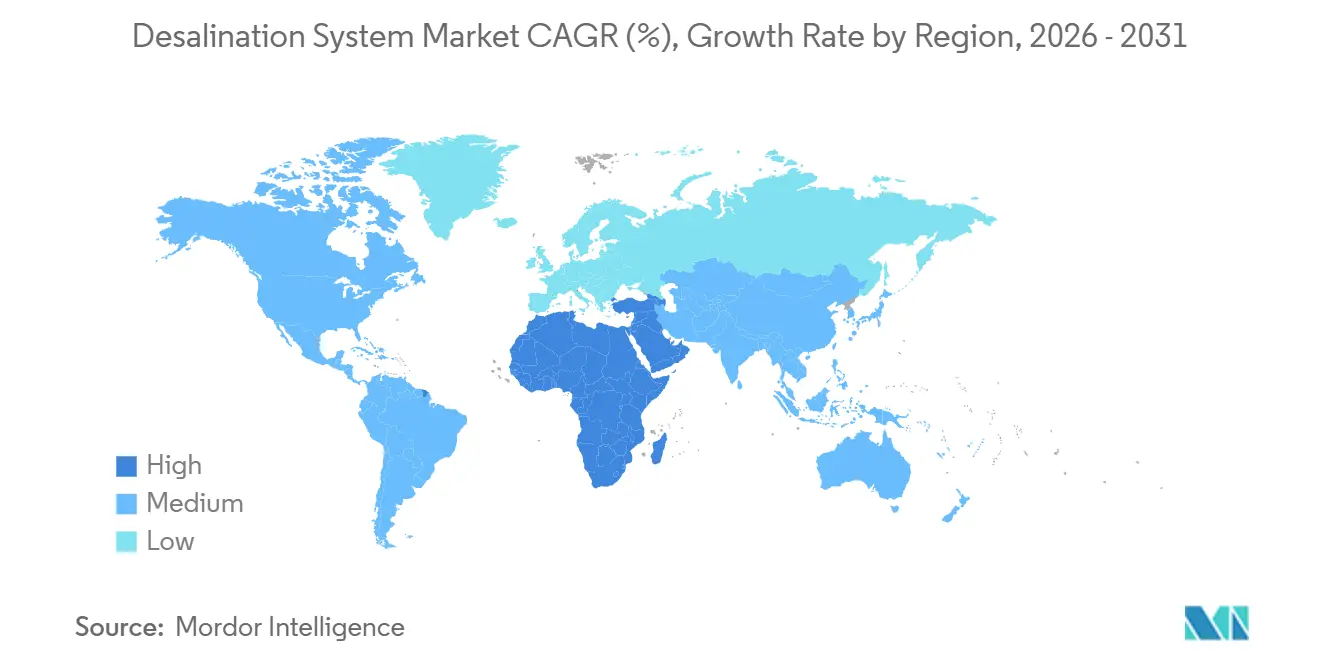
| Fastest Growing Market | Middle East and Africa |
| Largest Market | Middle East and Africa |
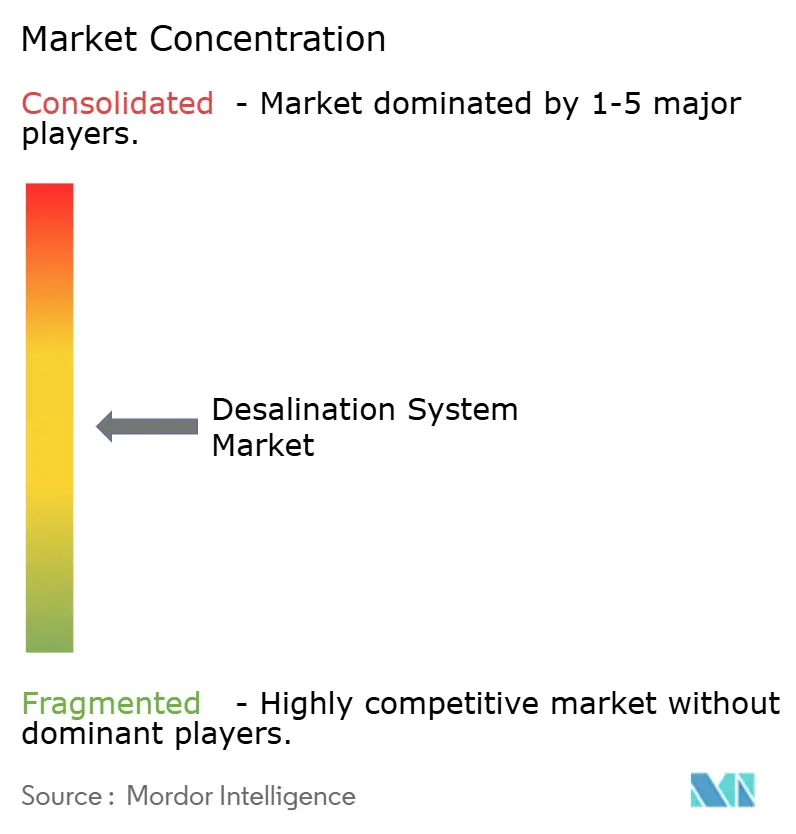
| Market Concentration | Medium |
Major Players *Disclaimer: Major Players sorted in no particular order Image © Mordor Intelligence. Reuse requires attribution under CC BY 4.0. | |
Desalination System Market Analysis by Mordor Intelligence
The Desalination System Market size is projected to expand from USD 18.02 billion in 2025 and USD 19.61 billion in 2026 to USD 29.92 billion by 2031, registering a CAGR of 8.82% between 2026 to 2031. The upward trajectory reflects policy choices that frame desalination as core infrastructure for national water security rather than an emergency measure. Sovereign water-security funds are underwriting multibillion-dollar public-private partnerships, semiconductor foundries and green-hydrogen developers are building on-site plants to avert supply interruptions, and reverse-osmosis (RO) energy-recovery costs keep falling in real terms. Industrial reuse mandates in Asia-Pacific accelerate technology adoption, while hybrid RO-electrodialysis units open inland mining opportunities. Against this backdrop, turnkey EPC bidding wars are giving way to technology licensing deals that monetize proprietary membranes, pressure-exchanger devices, and modular containerized units.
Key Report Takeaways
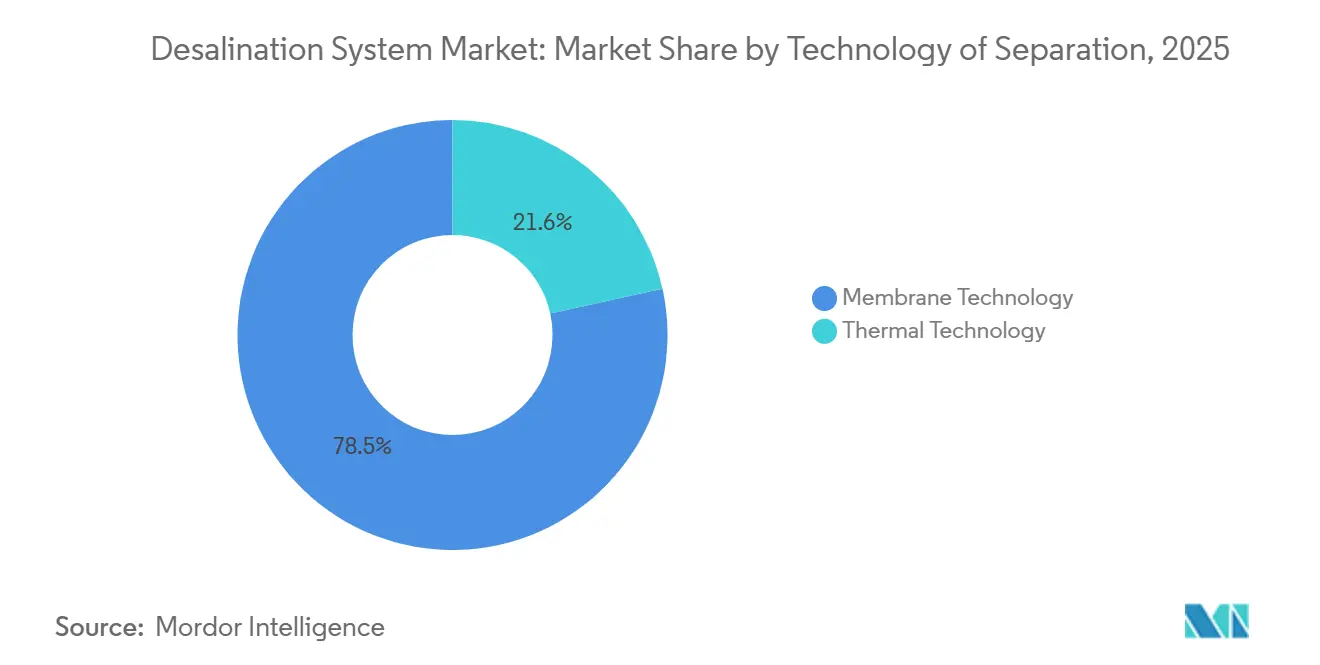
- By technology, membrane processes led with 78.45% of desalination system market share in 2025; the same segment is forecast to expand at a 10.55% CAGR through 2031.
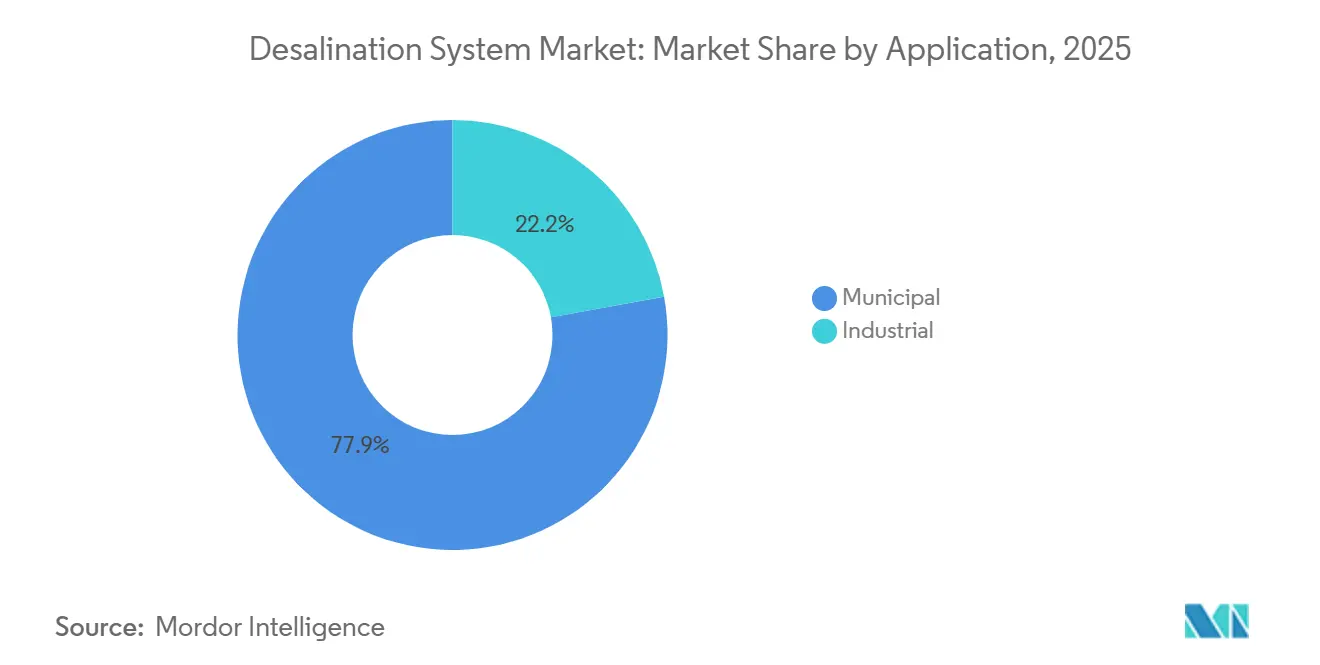
- By application, municipal accounted for 77.85% of the desalination system market size in 2025, while the industrial segment is advancing at a 10.28% CAGR through 2031.
- By geography, Middle-East and Africa dominated with 52.70% share of the desalination system market size in 2025 and is expanding at a 10.46% CAGR to 2031.
Note: Market size and forecast figures in this report are generated using Mordor Intelligence’s proprietary estimation framework, updated with the latest available data and insights as of 2026.
Global Desalination System Market Trends and Insights
Drivers Impact Analysis*
| Driver | (~) % Impact on CAGR Forecast | Geographic Relevance | Impact Timeline |
|---|---|---|---|
| Rapid Municipal Water Demand in MENA Region | +2.1% | Middle-East and Africa, with spillover to North Africa coastal cities | Medium term (2-4 years) |
| Industrial Reuse Mandates (Semiconductor, Pharma) | +1.8% | Asia-Pacific core (Taiwan, South Korea, India), secondary in North America | Short term (≤ 2 years) |
| Falling RO Capex and Energy-Recovery Costs | +1.5% | Global, with fastest adoption in cost-sensitive emerging markets | Long term (≥ 4 years) |
| Green-Hydrogen Cluster Demand (Coastal Deserts) | +1.3% | Middle-East (Saudi Arabia, UAE, Oman), Australia, Chile | Medium term (2-4 years) |
| Sovereign Water-Security Funds Underwriting PPPs | +1.2% | Middle-East and Africa, selective Asia-Pacific (Singapore, Indonesia) | Long term (≥ 4 years) |
| Source: Mordor Intelligence | |||


Rapid Municipal Water Demand in MENA Region
Per-capita renewable freshwater in Gulf Cooperation Council states fell below 100 m³ per year, less than 10% of the global scarcity benchmark. Saudi Arabia targets 8.5 million m³ /day of new RO capacity by 2030, a 60% jump over 2025 output. Egypt let contracts for three plants totaling 1.5 million m³ /day in 2025 to secure Suez Canal corridor growth. Algeria budgeted USD 4.2 billion for coastal desalination through 2028 to offset 40% distribution losses. Commissioning ramps in 2026-2027, adding 2.1 percentage points to baseline CAGR as network effects spur follow-on phases.
Industrial Reuse Mandates (Semiconductor, Pharma)
Zero-liquid-discharge rules require fabs to recycle at least 90% of process water in Taiwan and 95% in India. Taiwan’s 2024 rule changes accelerated on-site RO retrofits that now treat brackish groundwater and reclaimed effluent. South Korea subsidizes up to 40% of desalination capex for industrial plants above 5,000 m³ /day, boosting pharma API adoption. Compliance deadlines cluster in 2026-2027, lifting CAGR by 1.8 points.
Falling RO CAPEX and Energy-Recovery Costs
Membrane commoditization cut installed costs 18% between 2020 and 2025, while pressure-exchanger efficiency climbed to 98.5%, pushing specific energy to 2.2 kWh /m³. DuPont’s 2024 membranes deliver 15% higher flux, trimming pressure-vessel counts. Toray’s longer-life fibers lower annual replacement costs 25%[1]Toray Industries, “2024 Technical Bulletin on Biofouling,” toray.com . Lower capex unlocks projects across Sub-Saharan Africa and Southeast Asia, adding 1.5 points to long-run CAGR.
Green-Hydrogen Cluster Demand (Coastal Deserts)
Electrolyzers need 9-12 L of ultrapure water per kilogram of hydrogen, integrating desalination into project blueprints. NEOM’s 650 t /day hydrogen hub pairs a 300,000 m³ /day RO facility with renewable power. Oman, Australia, and Chile issued tenders in 2025 that tie water supply to offtake contracts, moving from engineering to construction and contributing 1.3 CAGR points.
Restraints Impact Analysis*
| Restraint | (~) % Impact on CAGR Forecast | Geographic Relevance | Impact Timeline |
|---|---|---|---|
| RO Membrane Fouling and Scaling | -0.9% | Global, acute in tropical and subtropical coastal zones with high algal activity | Short term (≤ 2 years) |
| Environmental Impact of Brine Discharge | -0.7% | North America (California, Texas), Europe (Spain, Greece), selective Asia-Pacific (Australia) | Medium term (2-4 years) |
| High Project Capex Sensitivity to Energy Prices | -1.1% | Middle-East and Africa (subsidy-dependent markets), South America | Short term (≤ 2 years) |
| Source: Mordor Intelligence | |||
RO Membrane Fouling and Scaling
Organic fouling cuts permeate flux up to 35% within 18 months at high-throughput Gulf plants. Rising sea-surface temperatures extend algal bloom seasons by 6-8 weeks, raising total organic carbon 25%. Biofilm-forming microbes resist chlorine pretreatment; incidents rose 22% year-on-year. Scaling in high-recovery systems shortens membrane life to 4.5 years. Countermeasures add USD 0.12-0.20 /m³ to opex, shaving 0.9 points off CAGR until fouling-resistant membranes commercialize.
Environmental Impact of Brine Discharge
California’s 2025 Ocean Plan limits salinity deviation to 2 ppt within 100 m of outfall, forcing co-location or expensive diffusers. Spain imposed a Mediterranean permit moratorium pending zero-impact solutions. Australia’s Great Barrier Reef rules demand 15:1 dilution, lifting capex by USD 0.22-0.30 /m³. Compliance costs suppress CAGR by 0.7 points until pilot-scale brine concentrators mature.
*Our forecasts treat driver/restraint impacts as directional, not additive. The impact forecasts reflect baseline growth, mix effects, and variable interactions.
Segment Analysis
By Technology of Separation: Membrane Dominance Driven by Efficiency Gains
Membrane processes captured 78.45% of desalination system market share in 2025 and are projected to grow at a 10.55% CAGR through 2031. The desalination system market size for membrane technologies is set to outpace thermal methods as RO energy intensity falls below 2.5 kWh /m³ and energy-recovery devices approach 98% efficiency. Electrodialysis reversal (EDR) is gaining ground in inland brackish-water applications where total dissolved solids remain under 5,000 mg/L, cutting energy consumption compared with high-pressure RO. Hybrid MED-RO plants handle RO reject streams, pushing overall recovery above 70% while holding costs within 8% of pure RO configurations. Thermal multi-stage flash and multi-effect distillation decline except where power-plant waste heat is free, yet selective Gulf projects still move forward under co-generation economics.
Thermal technologies, although losing share, remain vital in Kuwait and UAE where existing infrastructure and fuel subsidies offset higher energy intensity. Vapor-compression units persist on offshore platforms that prize compactness over cost. Nanofiltration, ultrafiltration, and microfiltration increasingly serve as pretreatment buffers that extend RO membrane life by up to 35% in turbid waters such as the Yangtze Delta. Component partnerships dominate procurement strategy: membrane suppliers license chemistry to regional fabricators, while energy-recovery OEMs sign performance-based contracts indexed to kWh/m³ metrics, embedding devices into competitor plants.

By Application: Industrial Segment Accelerates on Compliance Pressure
Municipal held 77.85% of the desalination system market size in 2025, anchored by megacity investments from Singapore to Los Angeles. Singapore’s PUB sourced 30% of national demand from five plants in 2025 and is building a sixth for 137,000 m³ /day by 2027. Cape Town awarded a 300,000 m³ /day concession in 2024 after its 2018 water crisis. The desalination system market size for municipal projects grows steadily as climate-induced droughts intensify.
Industrial demand is the fastest-growing slice, expanding at a 10.28% CAGR as manufacturers internalize water risk. TSMC’s Fab 18 integrated a 50,000 m³ /day RO facility that recycles 92% of process water. Pfizer’s Kalamazoo expansion added a 15,000 m³ /day EDR line delivering 0.1 µS/cm ultrapure output. Data centers in Arizona use 8,000 m³ /day of desalinated groundwater for cooling, lowering municipal draws by 35%. Mining companies in Chile and Australia pipe coastal RO water 50 km inland, meeting corporate pledges to cut freshwater extraction 30% by 2030. Industrial appetite positions the segment as the primary volume driver through 2031.
Geography Analysis
The Middle-East and Africa commanded 52.70% of the desalination system market share in 2025 and is projected to grow at a 10.46% CAGR to 2031, buoyed by Saudi Arabia’s USD 200 billion National Water Strategy and Egypt’s Suez Canal corridor build-out. ACWA Power’s 2.4 million m³ /day Yanbu plant, scheduled for 2028 at USD 0.42 /m³ tariff, illustrates economies of scale. UAE’s Taweelah complex reached 909,000 m³ /day in 2025 and plans another 200,000 m³ /day by 2027. Algeria’s ADE financed 450,000 m³ /day through the African Development Bank, underscoring MDB-sovereign collaboration.
In Asia-Pacific, India cleared five projects totaling 600,000 m³ /day in Gujarat alone during 2025 to meet zero-discharge mandates for electronics hubs. China’s Tianjin complex scales to 500,000 m³ /day by 2026 to backstop groundwater deficits in the North China Plain. Japan invests USD 450 million in volcanic-heat MED pilots across Okinawa and Kyushu. The desalination system market size in Asia-Pacific benefits from industrial clusters tethered to coastal corridors.
North America and Europe move cautiously under stricter environmental scrutiny. California’s Huntington Beach plant gained conditional clearance in 2025 after a USD 120 million marine-habitat package. Spain’s 200,000 m³ /day Almería plant embeds zero-liquid-discharge brine concentrators. South America’s growth centers on Chile’s mining belt, where 400,000 m³ /day of incremental capacity cuts Andean aquifer withdrawals 30% by 2031. Brazil’s Fortaleza feasibility study targets 150,000 m³ /day by 2028 to hedge multi-year droughts.

Competitive Landscape
The top five EPC contractors controlled roughly 53% of global contract value in 2025, placing the desalination system market at a moderate concentration level. Yet technology vendors wield pricing power through patented membranes and pressure-exchanger devices that define plant efficiency. ACWA Power operates 78% of its portfolio under 25-year IWPs with availability-based tariffs, reducing exposure to commodity energy swings[2]ACWA Power, “2024 Annual Report,” acwapower.com . Veolia licenses modular RO skids to emerging-market utilities, collecting annuity-style revenue from membrane replacements.
Hybrid inland systems remain a white-space segment. Fluence’s NIROBOX snagged 12 contracts across Latin American lithium projects and Australian cattle stations during 2024-2025. Nanostone Water’s capacitive deionization pilots in California treat ag-drainage water at 30% lower energy intensity than RO. Energy Recovery Inc. protects its 187-patent pressure-exchange moat, sustaining gross margins above 60% and forcing rivals to license technology.
Desalination System Industry Leaders
Veolia
Doosan Enerbility
Toray Industries, Inc.
IDE Technologies
ACCIONA
- *Disclaimer: Major Players sorted in no particular order

Recent Industry Developments
- December 2025: IDE Technologies secured a contract by the Brihanmumbai Municipal Corporation (BMC) to design and construct a large-scale seawater reverse osmosis (SWRO) desalination plant in Manori, Mumbai. It also signed a 20-year operations and maintenance agreement to manage the facility after commissioning, ensuring a reliable supply of high-quality drinking water to Mumbai, India’s financial capital.
- September 2025: Researchers at the Indian Institute of Science (IISc) developed a siphon-powered thermal desalination system that converted seawater into clean drinking water more quickly, cost-effectively, and efficiently compared to conventional methods. The system incorporated a composite siphon consisting of a fabric wick and a grooved metal surface, where the fabric wick drew salty water from a reservoir, and gravity facilitated a continuous flow to prevent salt crystallization by flushing it away.


Global Desalination System Market Report Scope
The purpose of a desalination system is to clean or purify brackish water or seawater and supply water with total dissolved solids. The desalination system includes several technologies, among which reverse osmosis is largely used for the purification process.
The desalination system market is segmented by technology of separation, application, and geography. By separation technology, the market is segmented into membrane technology and thermal technology. Membrane technology is further segmented into electrodialysis (ED), electrodialysis reversal (EDR), reverse osmosis (RO), and other membrane technologies such as nanofiltration, ultrafiltration, and microfiltration. Thermal technology is further segmented into multi-stage flash distillation (MSF), multi-effect distillation (MED), and vapor compression distillation. By application, the market is segmented into municipal and industrial. The report also covers the size and forecasts for the desalination system in 15 countries across major regions. For each segment, the market sizing and forecasts have been done on the basis of value (USD).
By Technology of Separation
| Membrane Technology | Electrodialysis (ED) |
| Electrodialysis Reversal (EDR) | |
| Reverse Osmosis (RO) | |
| Other Membrane Technologies (Nanofiltration, Ultrafiltration, Microfiltration) | |
| Thermal Technology | Multi-stage Flash Distillation (MSF) |
| Multi-effect Distillation (MED) | |
| Vapor Compression Distillation |
By Application
| Municipal |
| Industrial |
By Geography
| Asia-Pacific | China |
| India | |
| Japan | |
| Rest of Asia-Pacific | |
| North America | United States |
| Canada | |
| Mexico | |
| Europe | Germany |
| United Kingdom | |
| Spain | |
| Rest of Europe | |
| South America | Brazil |
| Chile | |
| Rest of South America | |
| Middle-East and Africa | Saudi Arabia |
| United Arab Emirates | |
| Algeria | |
| Egypt | |
| Rest of Middle-East and Africa |
| By Technology of Separation | Membrane Technology | Electrodialysis (ED) |
| Electrodialysis Reversal (EDR) | ||
| Reverse Osmosis (RO) | ||
| Other Membrane Technologies (Nanofiltration, Ultrafiltration, Microfiltration) | ||
| Thermal Technology | Multi-stage Flash Distillation (MSF) | |
| Multi-effect Distillation (MED) | ||
| Vapor Compression Distillation | ||
| By Application | Municipal | |
| Industrial | ||
| By Geography | Asia-Pacific | China |
| India | ||
| Japan | ||
| Rest of Asia-Pacific | ||
| North America | United States | |
| Canada | ||
| Mexico | ||
| Europe | Germany | |
| United Kingdom | ||
| Spain | ||
| Rest of Europe | ||
| South America | Brazil | |
| Chile | ||
| Rest of South America | ||
| Middle-East and Africa | Saudi Arabia | |
| United Arab Emirates | ||
| Algeria | ||
| Egypt | ||
| Rest of Middle-East and Africa | ||


Key Questions Answered in the Report
How large will global desalination capacity become by 2031?
Installed capacity underpinning the desalination system market is projected to support USD 29.92 billion in annual revenues by 2031, reflecting an 8.82% CAGR from 2026 to 2031.
Which technology will dominate new plant orders over the next five years?
Membrane-based reverse osmosis is expected to remain predominant, expanding at a 10.55% CAGR as energy-recovery devices push specific consumption toward 2 kWh /m³.
Why are industrial users accelerating adoption?
Semiconductor, pharmaceutical, data-center, and mining operators must meet zero-liquid-discharge or high-recycle mandates, driving the industrial application segment at a 10.28% CAGR through 2031.
How sensitive are project economics to energy prices?
Energy comprises up to 50% of RO operating costs; a sustained USD 10 per-barrel oil increase can add USD 0.08-0.12 /m³ to levelized water cost, threatening subsidy-dependent plants.
Page last updated on:


