
Craft Soda Market Size and Share
Market Overview
| Study Period | 2022 - 2032 |
|---|---|
| Market Size (2027) | USD 0.87 Billion |
| Market Size (2032) | USD 1.13 Billion |
| Growth Rate (2027 - 2032) | 5.37 % |
| Fastest Growing Market | Asia-Pacific |
| Largest Market | North America |
| Market Concentration | Low |
Major Players *Disclaimer: Major Players sorted in no particular order Image © Mordor Intelligence. Reuse requires attribution under CC BY 4.0. | |
Craft Soda Market Analysis by Mordor Intelligence
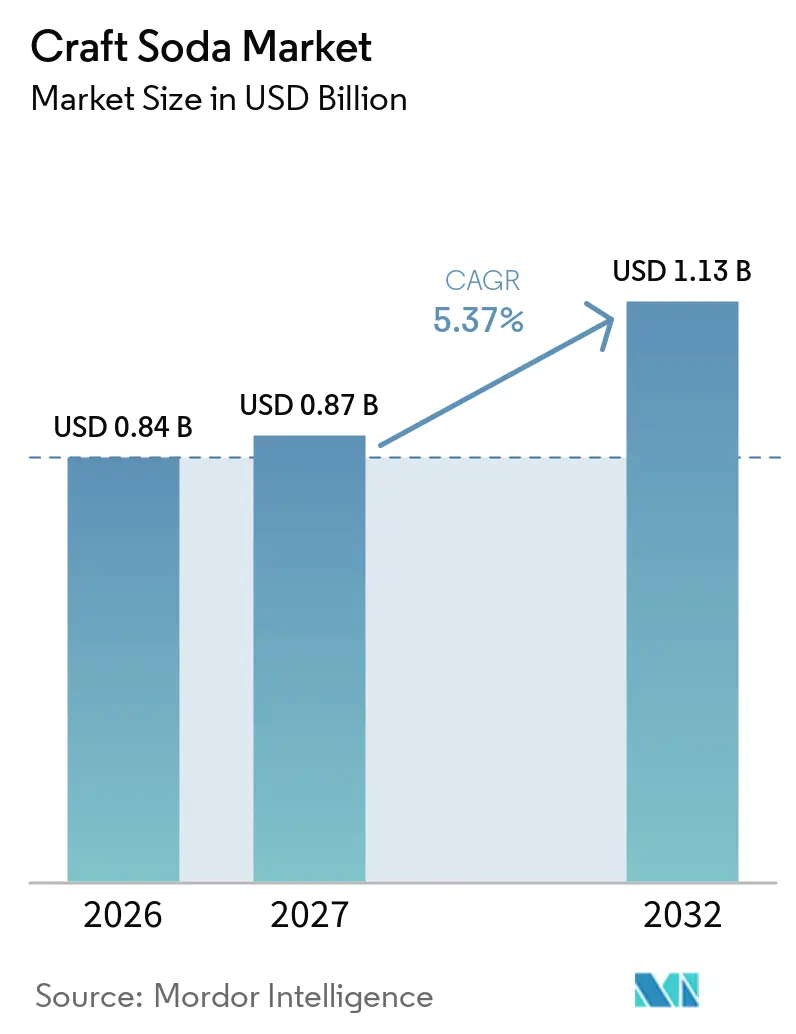
The craft soda market size is expected to grow from USD 0.84 billion in 2026 to USD 0.87 billion in 2027 and is forecast to reach USD 1.13 billion by 2032 at 5.37% CAGR over 2027-2032. The craft soda market is benefiting from a gradual shift in consumer preferences away from mass-produced soft drinks toward small-batch beverages featuring distinctive flavors, recognizable ingredients, and differentiated product formulations. Premium pricing strategies are supporting revenue growth, even as unit volume expansion remains comparatively moderate. Meanwhile, sugar levies, front-of-pack labeling initiatives, and public health campaigns are encouraging manufacturers to develop lower-sugar alternatives and adopt simpler ingredient formulations. These evolving preferences are creating opportunities for brands to combine familiar soda flavors with natural ingredients, functional attributes, and innovative flavor combinations.
Key Report Takeaways
- By flavor, cola held 46.09% of the craft soda market share in 2026, while fruit-flavored soda is projected to grow at a CAGR of 6.88% through 2032.
- By ingredient type, conventional formulations held 81.18% of the craft soda market share in 2026, while organic formulations are projected to grow at a 7.03% CAGR through 2032.
- By packaging type, glass bottles held 54.37% of packaging sales in 2026, while cans are projected to grow at a 6.72% CAGR through 2032.
- By distribution channel, off-trade held 59.71% of channel sales in 2026, while on-trade is projected to grow at a 6.56% CAGR through 2032.
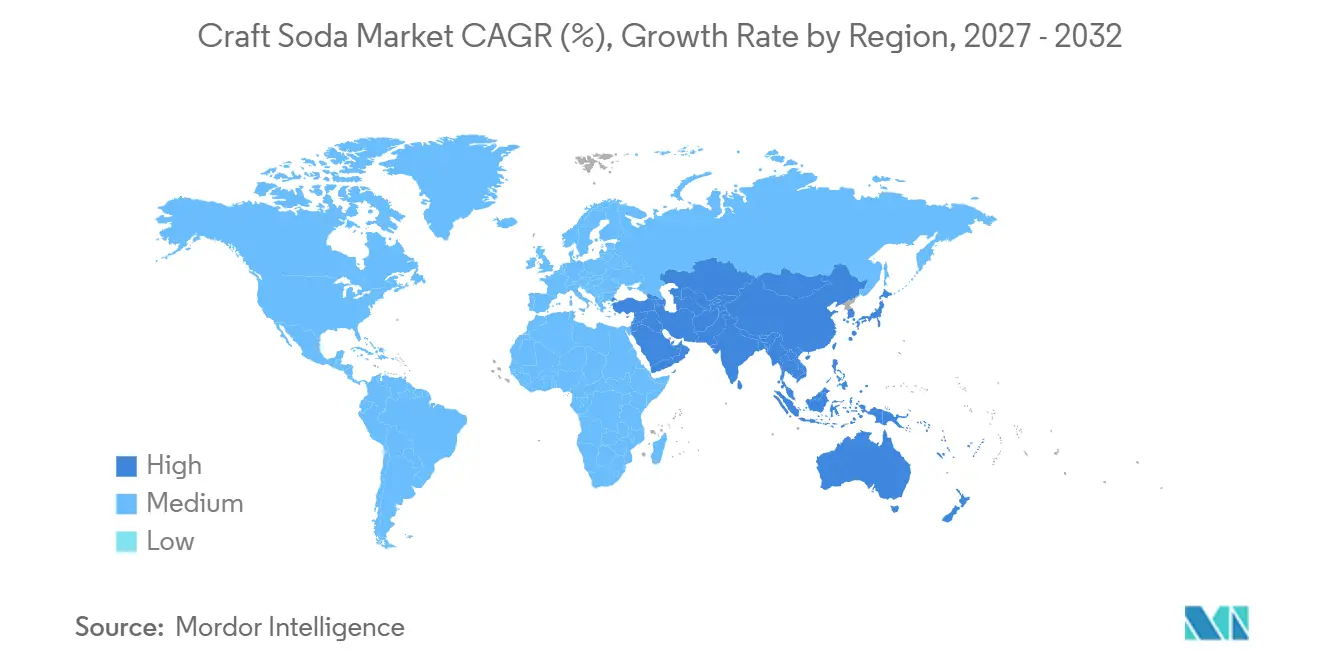
- By geography, North America held 32.76% of regional sales in 2026, while Asia-Pacific is projected to grow at a 6.82% CAGR through 2032.
Note: Market numbers in this report are based on Mordor Intelligence's proprietary estimation framework, which combines nine months of actuals with Q4 projections for base year 2026.
Market Trends and Insights
Drivers Impact Analysis of Craft Soda Market*
| Driver | (~) % Impact on CAGR Forecast | Geographic Relevance | Impact Timeline |
|---|---|---|---|
| Growing consumer preference for premium and artisanal beverages | +1.4% | Global, highest intensity in North America and Western Europe | Long term (≥ 4 years) |
| Rising demand for unique flavors and innovative taste profiles | +1.0% | Global, with Asia-Pacific as the emerging growth frontier | Medium term (2-4 years) |
| Increasing interest in natural ingredients and authentic formulations | +0.9% | Global, particularly Europe, North America, and Japan | Long term (≥ 4 years) |
| Growing popularity of small-batch and locally produced beverages | +0.7% | North America and Western Europe, with early-stage Asia-Pacific traction | Medium term (2-4 years) |
| Rising consumer willingness to pay for differentiated beverage products | +0.8% | North America, Europe, and urbanizing Asia-Pacific markets | Long term (≥ 4 years) |
| Increasing demand for low-sugar and reduced-calorie beverage alternatives | +0.9% | Global; strongest in markets with active sugar levies: United Kingdom, United Arab Emirates, and select United States cities | Short term (≤ 2 years) |
| Source: Mordor Intelligence | |||
Growing Consumer Preference for Premium and Artisanal Beverages
Premiumization has durable relevance in the craft soda market because provenance, ingredient disclosure, and production methods can signal product quality to consumers. Craft sodas can sell at 2 to 3 times the per-unit price of mass-produced alternatives when the flavor and formulation justify the difference. This premium supports brands that use small-batch production and local sourcing, particularly in North America and Western Europe. It also allows local producers to compete on product distinction rather than on the scale advantages held by global soft drink brands. Jones Soda reported FY2025 revenue of USD 25.3 million, up 41.9% year over year, while its adjusted gross margin increased from 27% to 32%, showing how a premium position can improve revenue and margins. Consumers' willingness to pay also gives the craft soda market more room to absorb differentiated flavors, premium packaging, and verified ingredient claims.
Rising Demand for Unique Flavors and Innovative Taste Profiles
Flavor novelty remains an important reason in the craft soda market for consumers to try a craft soda, especially when brands offer profiles beyond familiar North American regional classics. Yuzu, calamansi, ginger, lemongrass, and pandan appeal to urban consumers in Asia-Pacific because they connect local food traditions with a modern non-alcoholic format. Cola, orange, and lime are also used in customized soda drinks that add cream, fruit syrups, or herbs in foodservice settings. These combinations create a route for brands to remain accessible while offering a more distinctive drinking occasion. A well-timed fruit range can give retailers a reason to refresh the shelf while keeping a recognizable soda proposition. Flavor additions can support incremental trial when they bring a genuinely different taste profile rather than only a new package design.
Increasing Interest in Natural Ingredients and Authentic Formulations
Natural ingredients and authentic formulations are becoming increasingly important in the craft soda market, as they help manufacturers differentiate their products from conventional mass-produced carbonated soft drinks. Consumers are showing greater interest in beverages made with recognizable ingredients, natural flavorings, and simpler formulations, encouraging brands to reduce artificial additives and explore organic and GMO-free ingredient options. UNESDA's 2025 report highlights the continued focus on added-sugar reduction across the European Union and the United Kingdom's soft drinks industries, reinforcing the importance of developing beverages that align with evolving health preferences[1]. Furthermore, claims such as organic, GMO-free, no artificial additives, and naturally flavored can help improve ingredient transparency and strengthen consumer trust when adequately substantiated. Certifications such as USDA Organic and compliance with the EU Organic Regulation can provide additional assurance regarding qualifying ingredients and production practices, helping brands establish credibility, differentiate premium offerings, and improve their positioning across specialty retail and mainstream distribution channels.
Increasing Demand for Low-Sugar and Reduced-Calorie Beverage Alternatives
Low-sugar and reduced-calorie choices are gaining importance in the craft soda market as health awareness and policy measures direct more attention toward added sugar. The U.S. Food and Drug Administration proposed a front-of-package Nutrition Info box in January 2025 that would display added sugar, saturated fat, and sodium on most packaged foods[2]. The United Kingdom will reduce the lower Soft Drinks Industry Levy threshold from 5g to 4.5g of total sugar per 100ml from January 2028. The UAE announced a tiered volumetric excise model in July 2025 that links tax treatment to sugar content per 100ml[3]. These measures encourage producers to review formulas before regulatory changes take effect. Zero-sugar products without artificial ingredients are positioned to benefit when consumers compare products more closely at the shelf.
Restraints Impact Analysis of Craft Soda Market*
| Restraint | (~) % Impact on CAGR Forecast | Geographic Relevance | Impact Timeline |
|---|---|---|---|
| Higher production costs compared with mass-produced soft drinks | -1.4% | Global, most acute for small-batch North American and European producers | Long term (≥ 4 years) |
| Stringent food safety, labeling, and beverage regulatory requirements | -0.6% | Global; most layered in North America (FDA), EU (EFSA), and GCC markets | Medium term (2-4 years) |
| Intense competition from established soft drink brands | -0.9% | Global, with particular channel pressure in North America and Europe | Short term (≤ 2 years) |
| Volatility in the prices of sugar, flavorings, and other raw materials | -0.7% | Global; amplified in markets with limited domestic sourcing infrastructure | Medium term (2-4 years) |
| Source: Mordor Intelligence | |||
Higher Production Costs Compared with Mass-Produced Soft Drinks
Production costs remain a persistent constraint in the craft soda market because small-batch producers do not have the purchasing scale of mass-market beverage groups. Glass bottles have higher per-unit costs than cans or PET, and the difference widens when volumes are limited. Certified-organic ingredients, botanical extracts, real fruit juice, and natural cane sugar can also cost more than conventional soda inputs. Commodity volatility in sugar, flavorings, and other materials adds uncertainty for brands with limited ability to hedge or pass through cost increases. Mid-tier producers face particular pressure because artisans can maintain a higher price position while multinational-owned brands can draw on larger production systems. These conditions can narrow margins and make it harder for independent brands to preserve the price premium that supports the craft soda market.
Stringent Food Safety, Labeling, and Beverage Regulatory Requirements
Food safety, labeling, and beverage requirements create additional pressure in the craft soda market and a heavier administrative burden for smaller producers in the craft soda market. The FDA proposal would require packaging changes within 3 to 4 years if it is finalized, creating a fixed cost that is more difficult to absorb at low production volumes. The revised UK levy threshold requires brands to assess whether sugar levels could expose them to higher costs from January 2028. European packaging rules, organic standards, and ingredient labeling requirements may also differ from rules in North America and GCC markets. At the same time, established soft drink companies can use their regulatory teams, retail relationships, and broad portfolios to increase competition for shelf space. This combination makes compliance and channel access more demanding for independent craft soda producers.
*Our forecasts treat driver/restraint impacts as directional, not additive. The impact forecasts reflect baseline growth, mix effects, and variable interactions.
Craft Soda Market Segment Analysis
By Flavor. Cola Retains Scale While Fruit Innovation Builds Demand
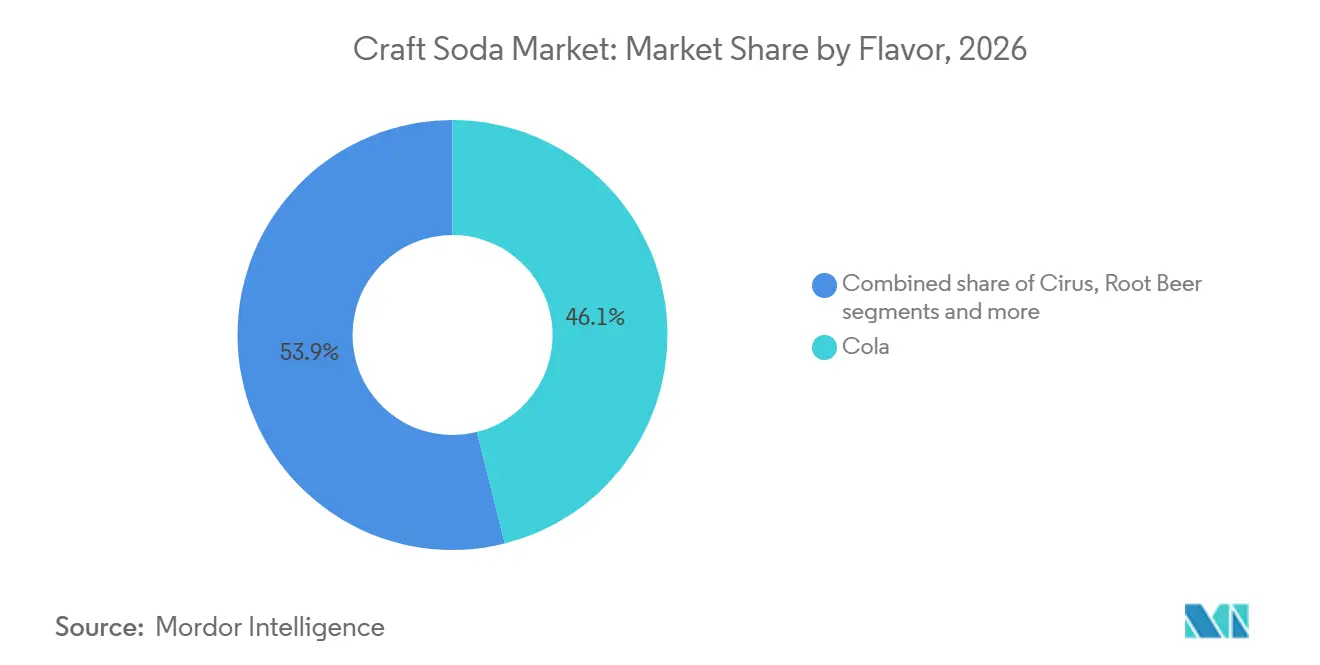
Cola accounted for 46.09% of the craft soda market share in 2026, supported by its established consumer recognition and widespread appeal across age groups. Its familiar taste profile makes it a preferred choice among consumers seeking alternatives to conventional mass-produced soft drinks while retaining traditional soda flavors. Craft soda manufacturers leverage this familiarity by offering distinctive formulations, premium ingredients, and small-batch production methods. Variations such as natural cola extracts, reduced-sugar formulations, and distinctive spice blends help brands differentiate their products from mainstream cola beverages. The flavor also benefits from its versatility across retail channels, restaurants, cafés, and specialty beverage outlets.
Fruit-flavored soda is projected to register a CAGR of 6.88% through 2032, driven by growing consumer interest in diverse and distinctive beverage flavors. Consumers are increasingly exploring alternatives to traditional cola, creating opportunities for craft soda manufacturers to introduce fruit-based formulations with premium positioning. Flavors such as citrus, berry, cherry, peach, and tropical fruit allow brands to differentiate their offerings and appeal to varied taste preferences. The segment also benefits from the small-batch production model, which enables manufacturers to experiment with seasonal ingredients, flavor combinations, and regionally inspired recipes. Additionally, demand for beverages featuring recognizable ingredients and natural flavor profiles is encouraging product innovation within the category.

By Ingredient Type. Conventional Formulations Lead While Organic Products Expand
Conventional formulations accounted for 81.18% of the craft soda market share in 2026, supported by their broad availability, established manufacturing processes, and relatively accessible pricing compared with organic alternatives. These products allow manufacturers to offer a diverse range of flavors while maintaining cost efficiency across production and distribution. Conventional craft sodas also benefit from established ingredient sourcing networks, enabling brands to serve a wider consumer base through supermarkets, convenience stores, specialty retailers, and foodservice outlets. Their established market presence supports consumer familiarity and encourages repeat purchases among buyers seeking distinctive soda flavors without a substantial price premium.
Organic formulations are projected to register a CAGR of 7.03% through 2032, driven by increasing consumer interest in ingredient transparency and products made with organically sourced ingredients. Consumers seeking premium beverage options are showing greater interest in craft sodas that align with their preferences for recognizable ingredients and organic production practices. This trend is encouraging manufacturers to develop formulations using certified organic flavoring ingredients, sweeteners, and other permitted components. Organic craft sodas also provide brands with opportunities to differentiate their products through premium positioning and distinctive flavor profiles.
By Packaging Type. Glass Supports Premium Positioning While Cans Expand Use Cases
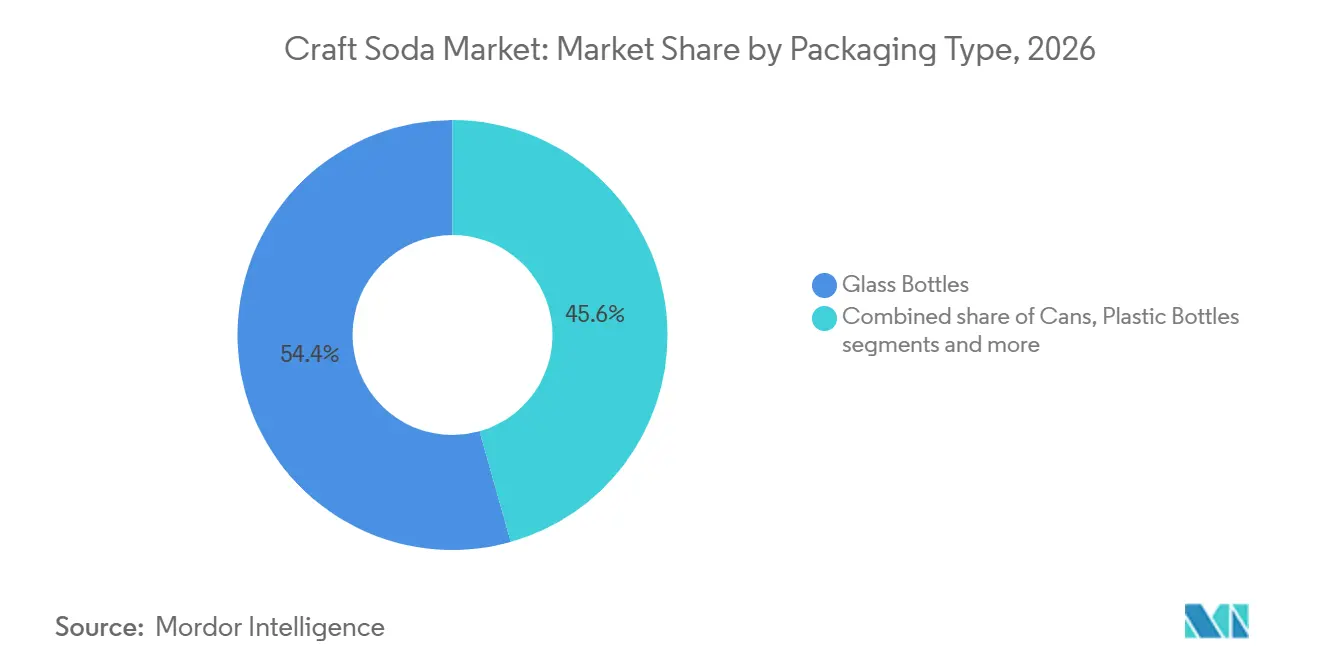
Glass bottles accounted for 54.37% of craft soda packaging sales in 2026, supported by their strong association with premium beverage presentation and product quality. Their transparent construction allows consumers to view the beverage, while their weight and finish contribute to a more premium perception compared with several alternative packaging formats. Craft soda manufacturers favor glass bottles to reinforce brand identity, differentiate products from mass-market soft drinks, and appeal to consumers seeking distinctive beverage experiences. Glass packaging also helps preserve flavor integrity by providing an effective barrier against external contaminants and gas exchange when appropriately sealed.
Cans are projected to register a CAGR of 6.72% through 2032, driven by their portability, convenience, and suitability for on-the-go consumption. Their lightweight construction makes transportation and handling easier for consumers, retailers, and distribution partners compared with heavier glass packaging. Cans also offer opportunities for creative branding through printed designs, vibrant colors, and distinctive graphics that help craft soda brands stand out on retail shelves. Their compact structure supports efficient storage and transportation, making them suitable for supermarkets, convenience stores, online retail, and foodservice establishments.
By Distribution Channel. Off-Trade Provides Scale While On-Trade Encourages Trial
The off-trade distribution channel accounted for 59.71% of craft soda market sales in 2026, supported by the widespread availability of products through supermarkets, hypermarkets, convenience stores, specialty beverage retailers, and e-commerce platforms. These channels allow consumers to purchase craft sodas for household consumption, social gatherings, and personal use. The availability of multiple flavors, packaging formats, and price points enables retailers to cater to a broad range of consumer preferences.
The on-trade distribution channel is projected to register a CAGR of 6.56% through 2032, driven by growing opportunities to introduce craft sodas through restaurants, cafés, bars, hotels, and other foodservice establishments. These venues allow consumers to experience distinctive flavors and premium beverage offerings while dining out or participating in social occasions. The growing emphasis on differentiated beverage menus is encouraging foodservice operators to incorporate craft sodas as alternatives to conventional soft drinks. Their varied flavor profiles and premium positioning also enable establishments to pair beverages with specific cuisines and enhance the overall dining experience.
Geography Analysis
North America Craft Soda Market
North America accounted for 32.76% of the craft soda market sales in 2026, supported by established demand for premium beverages, diverse flavor offerings, and a well-developed retail distribution network. Consumers in the region are increasingly exploring alternatives to conventional carbonated soft drinks, creating opportunities for craft soda brands to differentiate their products through distinctive flavors, small-batch production, and premium ingredients. The presence of specialty beverage retailers, supermarkets, convenience stores, and established e-commerce platforms facilitates product accessibility across the United States and Canada.
APAC Craft Soda Market
Asia-Pacific is projected to register the fastest growth in the craft soda market, with a CAGR of 6.82% through 2032, driven by evolving beverage preferences, expanding urban populations, and increasing exposure to premium beverage products. Rising disposable incomes in several regional economies are creating opportunities for consumers to explore differentiated soft drinks beyond conventional carbonated beverages. Countries such as China, Japan, Australia, and India offer opportunities for manufacturers to introduce craft sodas featuring locally inspired ingredients, fruit flavors, and distinctive formulations. The region's diverse culinary traditions also support the development of beverages incorporating regional fruits, herbs, spices, and other recognizable ingredients.
EMEA and South America Craft Soda Market
Europe represents an important craft soda market, supported by demand for premium beverages, distinctive flavors, and innovative ingredients. Its developed retail infrastructure and foodservice sector facilitate distribution through supermarkets, specialty stores, cafés, restaurants, and bars. In South America, established carbonated beverage consumption and diverse fruit availability create opportunities for craft sodas featuring regional flavors. Brazil, Argentina, and Chile offer potential for locally inspired formulations and premium positioning, supported by expanding modern retail channels. In the Middle East and Africa, hospitality development, foodservice expansion, and demand for diverse non-alcoholic beverages are creating opportunities for craft soda manufacturers.
Competitive Landscape
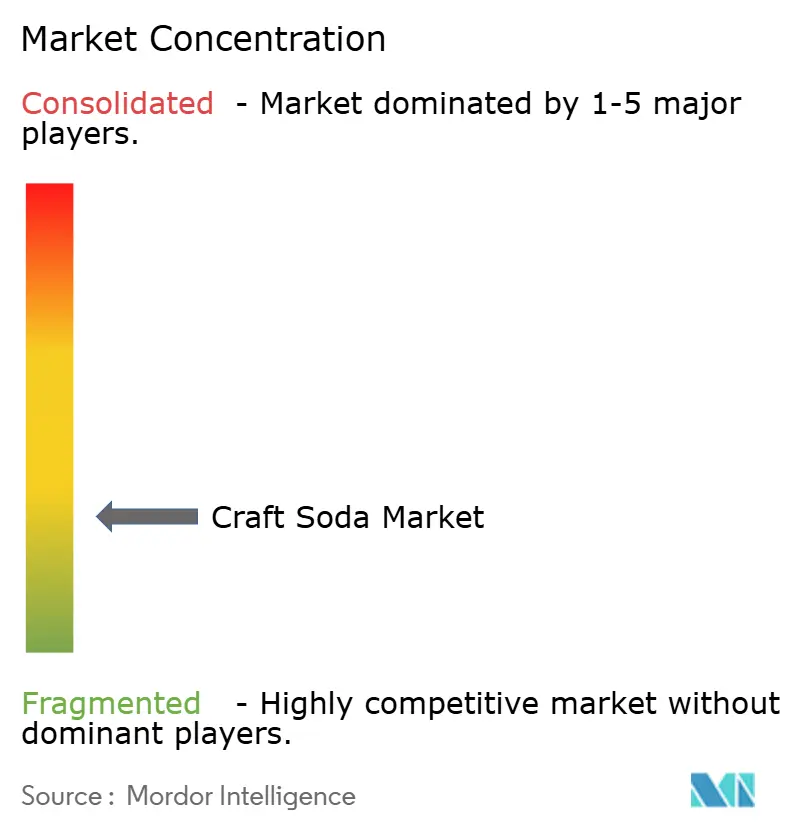
The craft soda market has a fragmented structure, and no single company has broad pricing or distribution control across all regions and channels. The field includes micro-regional producers, craft-native brands building national distribution, botanical specialists, functional soda entrants, and multinational companies using acquisitions or sub-brands. Keurig Dr Pepper Canada also partnered with Cove Soda to increase access across more than 7,000 retail doors. These moves show that distribution capability and established brand identity are both important competitive assets.
Craft-native scale-builders such as Jones Soda and Zevia are focusing on flavor launches, national retail placement, and marketing partnerships. Jones Soda widened its club-channel presence through Costco in August 2025. Premium specialists including Fever-Tree and Fentimans use botanical positioning and formats such as slimline cans or ready-to-drink products to create new occasions. Functional brands such as Cove Soda and Living Things use probiotics, prebiotics, cleaner labels, and distributor relationships to scale.
White space remains where certified-organic, prebiotic, and non-GMO claims meet mainstream grocery distribution. The craft soda market can attract consumers who want functional benefits but still expect enjoyable taste and transparent ingredients. Competitive pressure remains high because large companies can use established channel relationships and independent brands must protect product authenticity as they scale. The category remains fragmented because the top 10 players hold less than 30% of sales, and no leading company has broad control of pricing or distribution across the category.
Craft Soda Industry Leaders
-
Jones Soda Co.
-
Reed's, Inc.
-
The Coca-Cola Company
-
Sprecher Brewing Company
-
PepsiCo, Inc.
- *Disclaimer: Major Players sorted in no particular order
Craft Soda Market Companies Covered in this Report
- Jones Soda Co.
- Reed's, Inc.
- Sprecher Brewing Company
- Boylan Bottling Company
- Maine Root Beverages
- The Coca-Cola Company
- PepsiCo, Inc.
- Keurig Dr Pepper Inc.
- Fever-Tree Drinks plc
- Bundaberg Brewed Drinks Pty Ltd
- Fentimans Ltd.
- SIPP eco beverage co. Inc.
- DRY Soda, Inc.
- Appalachian Brewing Company
- Q Mixers
- Fritz-Kola GmbH
- Orca Beverage, Inc.
- Wild Bill's Craft Beverage Co.
- Zevia PBC
- Ale-8-One Bottling Company
Recent Industry Developments in Craft Soda Market
- July 2026: Jones Soda Co. announced a national club-store rollout of Fallout-themed Vault-Tec Official Beverage Ration products across the United States and Canada, extending its entertainment-inspired beverage strategy into larger retail formats.
- July 2026: Jones Soda Co. expanded its zero-sugar craft soda range into club stores across Western Canada, introducing Berry Lemonade, Orange & Cream, Cream Soda, and Root Beer to address demand for sugar-free beverage alternatives.
- March 2025: Hank’s Beverage Company introduced Hank’s ZERO, a four-flavor craft soda range comprising Root Beer, Pompelmo Citrus, Irish Ginger Ale, and Mexicola, targeting consumers seeking zero-sugar and zero-calorie alternatives.
- February 2025: Lady Bird Soda Co. launched its first canned soda range through Albertsons Companies’ Southern Division in Texas, featuring Cactus Pear, Lemon Lime, Grapefruit Soda, and Tejas Cola, with product positioning focused on natural ingredients, reduced sugar, and added fiber.
Global Craft Soda Market Report Scope
The craft soda market refers to the production and sale of small-batch, premium carbonated soft drinks characterized by distinctive flavors, specialized ingredients, and differentiated production methods. The craft soda market is segmented by flavor, ingredient type, packaging type, distribution channel, and geography. Based on flavor, the market is segmented into cola, citrus, root beer, ginger ale and ginger beer, fruit-flavored soda and other product types. Based on ingredient type, the market is segmented into conventional and organic. Based on packaging type, the market is segmented into glass bottles, cans, plastic bottles and other packaging types. Based on geography, the market is segmented into North America, Europe, Asia-Pacific, South America, and Middle East and Africa. The report provides market size and forecasts in both value (USD) and volume (liters) for all the mentioned segments.
Segmentation Overview
| Cola |
| Citrus |
| Root Beer |
| Ginger Ale and Ginger Beer |
| Fruit-Flavored Soda |
| Other Product Types |
| Glass Bottles |
| Cans |
| Plastic Bottles |
| Other Packaging Types |
| Conventional |
| Organic |
| Off-Trade | Supermarkets/Hypermarkets |
| Convenience Stores | |
| Online Retail Stores | |
| Other Distribution Channels | |
| On-Trade |
| North America | United States |
| Canada | |
| Mexico | |
| Rest of North America | |
| Europe | United Kingdom |
| Germany | |
| France | |
| Italy | |
| Spain | |
| Netherlands | |
| Poland | |
| Belgium | |
| Sweden | |
| Rest of Europe | |
| Asia-Pacific | China |
| India | |
| Japan | |
| Australia | |
| South Korea | |
| Thailand | |
| Singapore | |
| Rest of Asia-Pacific | |
| South America | Brazil |
| Argentina | |
| Colombia | |
| Chile | |
| Peru | |
| Rest of South America | |
| Middle East and Africa | South Africa |
| Saudi Arabia | |
| United Arab Emirates | |
| Egypt | |
| Morocco | |
| Nigeria | |
| Türkiye | |
| Rest of Middle East and Africa |
| By Flavor | Cola | |
| Citrus | ||
| Root Beer | ||
| Ginger Ale and Ginger Beer | ||
| Fruit-Flavored Soda | ||
| Other Product Types | ||
| By Packaging Type | Glass Bottles | |
| Cans | ||
| Plastic Bottles | ||
| Other Packaging Types | ||
| By Ingredient Type | Conventional | |
| Organic | ||
| By Distribution Channel | Off-Trade | Supermarkets/Hypermarkets |
| Convenience Stores | ||
| Online Retail Stores | ||
| Other Distribution Channels | ||
| On-Trade | ||
| By Geography | North America | United States |
| Canada | ||
| Mexico | ||
| Rest of North America | ||
| Europe | United Kingdom | |
| Germany | ||
| France | ||
| Italy | ||
| Spain | ||
| Netherlands | ||
| Poland | ||
| Belgium | ||
| Sweden | ||
| Rest of Europe | ||
| Asia-Pacific | China | |
| India | ||
| Japan | ||
| Australia | ||
| South Korea | ||
| Thailand | ||
| Singapore | ||
| Rest of Asia-Pacific | ||
| South America | Brazil | |
| Argentina | ||
| Colombia | ||
| Chile | ||
| Peru | ||
| Rest of South America | ||
| Middle East and Africa | South Africa | |
| Saudi Arabia | ||
| United Arab Emirates | ||
| Egypt | ||
| Morocco | ||
| Nigeria | ||
| Türkiye | ||
| Rest of Middle East and Africa | ||
Key Questions Answered in the Report
What is the expected value of craft soda by 2032?
The market is forecast to reach USD 1.13 billion by 2032, growing at a 5.37% CAGR from 2027 to 2032.
Which flavor leads craft soda sales?
Cola leads by flavor with a 46.09% share in 2026, while fruit-flavored soda has the highest forecast CAGR at 6.88%.
Why are low-sugar sodas gaining attention?
Front-of-pack labeling proposals and sugar-tax changes are increasing consumer and producer attention on added sugar levels.
Which packaging format is growing fastest?
Cans are forecast to grow at a 6.72% CAGR through 2032 because they improve portability and can reduce freight weight.
Which distribution channel is growing fastest?
On-trade distribution is forecast to grow at a 6.56% CAGR through 2032 as restaurants, bars, hotels, and foodservice venues offer more premium non-alcoholic choices.